
Using Enverus’ integrated production, spacing, cost, and economic analytics, teams can evaluate producing assets and undeveloped inventory in a single, traceable workflow, allowing engineers, A&D teams, and executives to move from raw well data to defensible valuation conclusions faster.
Rather than relying on static basin averages, disconnected tools, or opaque models, Enverus applies context‑controlled benchmarking, decline‑based forecasting, and DSU‑level inventory modeling to support technically sound, review‑ready decisions.
Producing asset and undeveloped inventory analysis can be interrogated, exported, and reproduced for technical review.

Asset valuation workflows are often slowed by fragmented data, inconsistent assumptions, and limited traceability between outputs and underlying wells. Enverus removes these bottlenecks by:
Enverus follows a structured modeling sequence that mirrors how reservoir engineers and asset teams think about value, moving from defining the right well population to evaluating full DSU-level development economics.
At a high level, the workflow will:
Each step remains fully transparent, allowing teams to interrogate assumptions, audit results, and defend conclusions internally and externally.
Faster, reproducible asset valuations grounded in observed well performance, supporting A&D decisions, capital allocation, and long-range development planning with confidence.
This integrated data framework underpins every step of the asset valuation workflow, ensuring context and traceability are preserved from input to output.
Enverus workflows are built on integrated upstream datasets within a single analytical environment, including:
Data undergo standardization and quality checks prior to analysis. Production timing, completeness, and refresh cadence remain visible to users.
Because production, completion, geologic, and commercial data are analyzed together, benchmarking and forecasting incorporate relevant operating context rather than relying on isolated datasets, reducing blind spots in your analysis.
Asset evaluation requires more than high-quality data; it requires the ability to apply internal assumptions, interpretations, and development philosophies within a controlled analytical framework.
Enverus allows users to incorporate proprietary datasets directly into the workflow so that well population definition, benchmarking, forecasting, inventory modeling, and economics reflect how teams actually evaluate assets internally.
Users can integrate inputs such as Areas of Interest (AOIs), internal tiering maps, geologic interpretations, completion designs, and cost assumptions directly into the modeling sequence. These inputs then flow consistently through every downstream step, from defining the well population to evaluating DSU-level development economics.
To support alignment across technical and commercial teams, organizations can establish shared definitions and publish a controlled “golden dataset.” This ensures that subsurface, engineering, A&D, and finance teams are working from the same well lists, filters, and assumptions, reducing reconciliation cycles and improving confidence in final valuation outputs.
All user inputs remain visible, adjustable, and exportable, preserving transparency and enabling results to be reviewed, challenged, and reproduced.
These user-defined inputs propagate through every step of the workflow, ensuring forecasts, inventory, and economics remain internally consistent and technically defensible.
Analysis begins by defining the well set using variables that materially influence performance and cost, such as:
All forecasts, benchmarks, and economic outputs derive directly from this defined population.
The exact well list, filters, and normalization windows remain visible and exportable.
Key contextual variables such as timing, spacing, landing zone, and parent-child sequencing are aligned so performance differences can be interpreted correctly.
Uncontrolled comparisons obscure true performance drivers and lead to misleading conclusions.
Enverus aligns and normalizes contextual variables to support like-for-like evaluation.
The goal is not to homogenize wells, but to control for confounding variables so performance differences are interpretable and you can home in on the true drivers of productivity.
Within the aligned well population, Enverus evaluates engineering and subsurface variables to distinguish design-driven, geologic, and development-order impacts.
Sensitivity testing isolates specific inputs while holding contextual factors constant. This reduces false correlations and clarifies whether observed uplift is design-driven, geologically driven, or development-order driven. Understanding why wells perform differently is critical for forecasting future results and capital decisions.
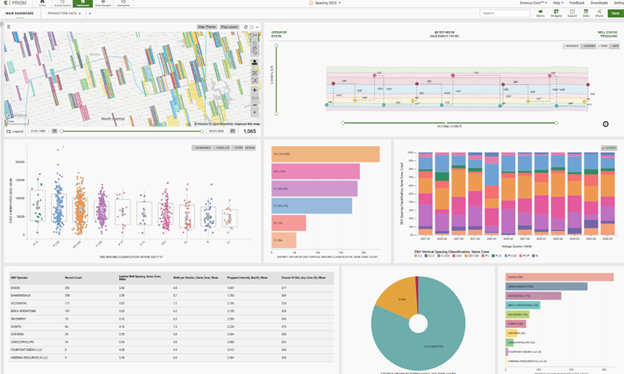
Well spacing is modeled using a pre-calculated, multi-dimensional framework that quantifies spatial proximity, development timing, vertical relationships, and well status.
Spacing is not limited to a single “nearest neighbor distance.” Instead, it incorporates:
Because spacing metrics are structured:
Users can also apply their own assumptions to the spacing model, influencing parent/child classifications based on co-completion timing window, minimum overlap percentage of neighbor wells, and neighbor search radius.
Spacing is a first-order control on performance and inventory economics, and treating it explicitly prevents overstating recovery and value.
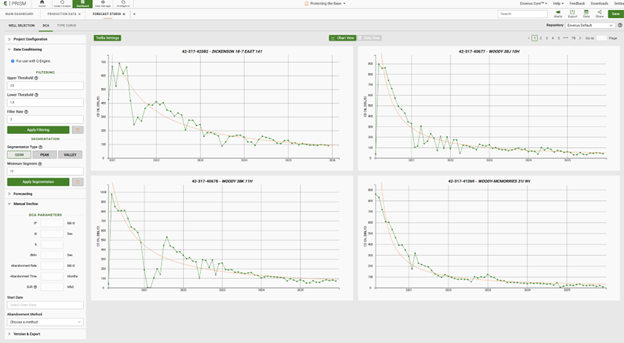
Forecasts are generated using established decline-curve methodologies applied to the defined well population. With Enverus Forecast Studio, you can change assumptions using data conditioning, segmentation, and manually edit Arps DCA parameters. Forecasts grounded in real performance are more defensible than generic basin-wide curves.
Key principles:
Decline parameters for Type Curves reflect the aligned population and normalization period selected by the user.
Type curves are constructed using statistical aggregation techniques applied to the defined well set.
Probability cases (P10, P50, P90) reflect the observed monthly distribution of performance within that population, capturing real variability rather than assumed spreads.
All forecast outputs remain linked to the underlying well list and assumptions.
Your custom forecasts can also be exported directly to Aries & PHDWin to help maintain consistency across engineering and finance workflows.
Undeveloped potential is assessed within drilling spacing units, accounting for spacing density, interference risk, and development sequencing, because asset value is driven by full-development outcomes, not only isolated single-well economics.
Enverus provides structured remaining inventory modeling which can be aligned to Drilling Spacing Units (DSUs) so engineers can evaluate undeveloped potential within a development grid rather than as disconnected single-well cases.
The Enverus Expert Remaining Inventory model provides a pre-generated, play-specific estimate of remaining well locations based on:
The model estimates:
This provides a structured baseline for understanding undeveloped potential in a new area or competitive position without requiring immediate custom modeling.
It is particularly useful for:
For operators with defined spacing philosophies or internal development strategies, Enverus supports customizable future well placement.
Engineers can apply:
Future well locations are generated within the DSU grid according to these assumptions. Because spacing metrics and parent-child logic are integrated into the broader modeling framework, engineers can evaluate:
This prevents overestimating inventory by assuming unconstrained single-well economics.
Inventory is aligned to DSU geometry rather than arbitrary map grids.
This enables evaluation at the unit level:
Because existing and future wells are evaluated together, economic modeling reflects:
This shifts analysis from:
“Is this next well economic?”
to
“What is the value of fully developing this DSU under defined spacing assumptions?”
This allows engineers to test:
All within a consistent, traceable framework.
This supports more defensible valuation and planning:
Capital, operating, and revenue inputs are modeled using driverbased logic aligned to operator behavior and development practices.
Realistic economics require costs and assumptions that reflect how assets are actually developed.
Primary cost drivers include:
Cost inputs are informed by public AFEs, operator capital guidance, SEC filings, and industry cost studies. Inputs are refreshed periodically to reflect evolving development conditions. Where appropriate, modeled costs are scaled to reflect operator-specific capital structures rather than flat regional averages.
Operating and revenue inputs incorporate:
Assumptions are modeled at the play and operator level, aligning economic outputs with realistic operating conditions.
Technical users can:
This allows forecasts and benchmarks to be reviewed, challenged, and reproduced without rebuilding workflows.
Technical discussions can focus on assumptions and drivers rather than data reconciliation.
Many teams use Enverus to establish traceable forecasting and economic inputs, then export outputs into established reserves and economics software.
AI-assisted outputs operate within the same deterministic, traceable framework described above, accelerating analysis without replacing engineering judgment.
Enverus AI deploys energy-native AI agents that securely execute flows across land, trading, operations, finance, and planning, using decades of Enverus intelligence, your proprietary data, and trusted third-party sources.
This is not AI added to software. This is software rebuilt for the AI era.
AI does not replace decline logic, cost modeling, or user-defined well selection. All AI outputs remain linked to the underlying wells, filters, and assumptions.
Engineers retain full control over definitions and final conclusions.
Enverus workflows are built on:
The result is analysis that withstands scrutiny from reservoir engineering, subsurface, finance, and executive stakeholders.
Enverus applies established decline-curve methodologies appropriate to unconventional development. Decline parameters are derived from the defined well population and selected normalization window.
The platform does not impose a single basin-wide curve or fixed parameter set. Forecasts reflect the observed production behavior of the selected wells and can be adjusted by modifying the well population, normalization period, or context filters.
The goal is reproducible decline analysis grounded in observed performance rather than opaque predictive models.
Outliers are not arbitrarily removed. Users retain control over well selection and filtering criteria.
Because type curves are constructed from the defined well population, statistical aggregation reflects the selected dataset. Engineers can:
Probability cases (P10/P50/P90) reflect the actual performance distribution within the selected wells, preserving transparency around variability.
Probability cases are derived from the statistical distribution of performance within the selected well population.
They represent observed variability in decline behavior and cumulative recovery rather than arbitrary uplift or haircut factors applied to a base curve.
Because probability cases are tied to the defined well set, changing the population or context filters directly updates the distribution and resulting cases.
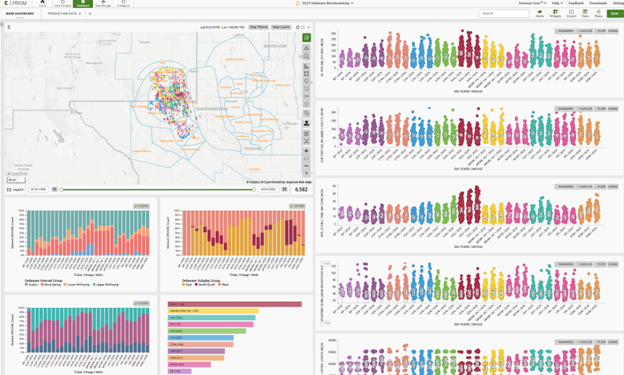
Benchmarking bias is reduced through context control and normalization.
Key controls include:
By reducing confounding variables, the platform supports like-for-like comparisons rather than raw, uncontrolled production overlays.
Engineers can view and adjust all filters used in benchmarking.
Parent-child sequencing can materially affect early-time production and decline behavior.
Users can filter wells based on development order and pad sequencing to evaluate performance within comparable parent or child groups.
Because sequencing remains visible at the well level, engineers can isolate:
This prevents blending fundamentally different production dynamics into a single benchmark.
Normalization windows are user-defined.
Engineers can:
Forecasts derive from observed performance within the selected time window. Immature wells can be included or excluded based on user-defined criteria.
Forecasting and economic outputs are grounded in deterministic, decline-based methodologies and structured cost-driver logic.
AI-assisted features accelerate pattern identification and summarization but do not replace decline calculations, statistical type curve construction, or driver-based cost modeling.
All AI-assisted outputs remain traceable to underlying wells and assumptions.
Well cost inputs are informed by publicly disclosed AFEs, operator capital guidance, SEC filings, and industry cost studies.
Inputs are refreshed periodically to reflect updated disclosures and evolving development conditions.
Operating assumptions (LOE, GP&T, differentials, royalties) are modeled at the play and operator level and updated as new public information becomes available.
Users retain the ability to adjust cost and economic assumptions for scenario testing.
Cost models incorporate primary design and operational drivers such as:
Where applicable, modeled costs are scaled to align with operator-specific capital structures rather than applying flat regional averages.
This allows engineers to compare operator performance within realistic capital frameworks.
Yes. For any forecast, type curve, benchmark, or economic output, users can:
This ensures results can be reproduced internally and defended in technical review meetings.
No. Many teams use Enverus to generate context-controlled forecasting and economic inputs, then export results into established reserves and booking software.
The platform strengthens upstream assumptions while preserving downstream reporting workflows.
Corporate type curves often assume uniform geology, spacing, and development conditions.
Enverus type curves are constructed from user-defined well populations that reflect specific landing zones, vintages, spacing regimes, and development sequencing.
This reduces the risk of overgeneralization and improves defensibility when capital decisions are reviewed.
Yes. Because well selection, context filters, decline logic, and economic inputs are integrated within a single environment, engineers can adjust:
And regenerate outputs without reconstructing the analysis from scratch.
Distances between a subject well and near neighbors are measured every 50 feet along the subject lateral.
At each sampling point, horizontal (2D), vertical, and 3D distances are calculated.
Statistical properties (P25, P50, P75, min, max, mean, standard deviation) are published in the 4D Spacing table for each well pairing.
This provides a distributional view of proximity rather than a single-point estimate.
By default, neighbors are evaluated within a 2,640 ft (½-mile) 3D cylindrical radius.
A 2-mile variant dataset is also available for broader spacing analysis.
This ensures spacing metrics reflect meaningful reservoir interaction distances rather than arbitrary map proximity.
Boundedness metrics classify wells as:
Vertical boundedness is evaluated separately.
This prevents standalone wells from being grouped with interference-prone wells in benchmarking or type curve construction.
Spacing metrics are used as contextual filters during well population selection.
Engineers can construct decline forecasts within:
This reduces interference-driven distortion in decline parameter estimation.

In the oil and gas industry, automated clearing house (ACH) fraud and change-of-bank scams create real exposure on both sides of a royalty payment. For operators, a fraudulent account update can mean sending funds to the wrong place — and...

Most land departments know their title process is slow. Fewer have added up what slow actually costs. Fewer still know there is a solution available right now that changes the economics entirely. Day rates. Duplicate courthouse runs. Ownership errors caught...

People have been calling the top of the Permian for years. And yet, they keep having to walk it back. Our latest Permian inventory analysis from the Enverus Intelligence® Research (EIR) team shows why the basin continues to defy those...

Invoice-only AI can’t prevent pricing errors or budget surprises. Learn why AI in Source-to-Pay delivers better financial control through connected data and context.
Data center demand is creating long‑term gas opportunities in the Permian. See how operators assess feasibility from macro trends to asset‑level supply.

In today’s upstream operations, pricing is rarely as simple as a fixed rate. Market volatility, supply constraints, labor dynamics, and regional variations make it increasingly difficult to manage service and material costs through static contracts. Most operators already acknowledge this...
An essential set of O&G data analytics. Redeploy your team’s bandwidth to higher-value analysis and strategy with clean analytics-ready data sets.
Make optimal asset acquisition and development decisions faster using forecasting, economics and benchmarking workflows for more than 5.4 million North American wells. Increase confidence and collaboration between teams with predictive, prescriptive and predictive forecasting, spacing and geological analytics in one platform.
Buy the best assets, drill and complete superior wells, maximise well performance and demonstrate the value of your company to investors with the most comprehensive inventory, forecasting, geological and spacing data and analytics for the Canadian oil and gas landscape.
Understand drivers of competitor performance and economics for faster deal evaluation, smart design decisions and increased capital efficiency. Whether you need to quickly evaluate oil well performance or run detailed type curve analysis, Enverus offers pre-generated and customizable forecasts and economics in one platform.
Rapidly evaluate inventory with pre-generated sticks and the ability to seamlessly integrate your own data for customizable workflows.
Tune out the noise, get unbiased evaluations and uncover hidden opportunities with advice you can trust from experienced energy and power intelligence advisors.
With Enverus Instant Analyst, you receive answers you can trust, delivered in seconds. Sourcing from 25+ years of vetted data and research on the most trusted SaaS platform designed exclusively for energy.
Securely blend your internal, high-resolution data with Enverus analytics-ready data sets and models.
Arm yourself with the knowledge to inform strategic decisions and grow your business with one source for insights across oil and gas, renewables, carbon capture and ESG.
Whether you need to quickly screen potential deals or run more technical analysis, Enverus Subsurface Solutions can answer your questions with pre-generated interpretations or customizable analytical workflows for optimized asset management.
Find ideal mineral investments and oil and gas deals for sale faster and close with confidence with Enverus title research and oil and gas M&A solutions. Enverus land solutions make it easy to verify ownership record, accurately appraise mineral assets, find deals and clear title. You can focus on specific geographies and get intel on lease dates and contract terms, production records and leasing costs.
Analyze more deals, spot emerging opportunities and stay ahead of the competition with the industry’s most comprehensive M&A database for oil and gas.
Enverus RFx is an AI-powered sourcing solution that simplifies bid management, expands supplier networks and provides transparent insights into pricing and activity. Streamline procurement and focus on your bottom line with Enverus RFx’s advanced technology.
Field Development Studio (FDS) streamlines development planning by integrating PDP forecasts and unique PUD scenarios with customized schedules, offering insights into production impacts and capital requirements for any asset or region.
Future-proof your business by making smarter, faster acquisitions. Screen targets, run scenario analyses, model cash flows, and evaluate asset inventory and production valuations, all on one platform.
Get near-real time insight into all phases of pre-production operation, from pad detection and frac crew activity, to DUCs over time, rig activity and cycle times, you can stay one step ahead with differentiated insights available up to two months ahead of public filings.
Save time and get spend under control with automated procurement workflows from order to invoice in one powerful platform made for oil and gas operations.
Outsource mineral phone and print and mail, so your land and accounting teams can focus on critical work.
Digitize and automate invoice processing and approvals with oil & gas enterprise accounts payable software.
EnergyLink software provides secure and convenient online access to oil and gas owner statements and account information — available 24/7.
Our conventional tools help upstream operators quickly screen fields, forecast production and analyze opportunities without added complexity. Built for lean teams, they deliver fast answers and integrated insights so you can plan confidently, prioritize assets and finish this week’s work faster.
Your team is spending weeks on work that should take days. Enverus and Tracts connect courthouse document retrieval, ownership interpretation, and operational decision-making into a single automated workflow — the only one in the market. Faster drilling decisions. More deals closed before competitors.
Let’s get started!
Let’s get started!
We’ll follow up right away to show you a quick product tour.
Ready to Subscribe?
Ready to Get Started?