The upstream M&A market in 2025 is defined by a paradox: record-high deal values, but fewer buyers. As capital becomes more selective and inventory more scrutinized, the rules of engagement have changed. No longer is it enough to bring production to the table, buyers now demand strategic fit, operational efficiency and data-backed proof of future value.
This e-book is designed to help upstream operators, investors, and analysts navigate this evolving landscape. Drawing on real-world case studies, market data and advanced modeling techniques, we’ll explore how to:
Whether you’re a private operator preparing for exit, a buyer seeking high-quality assets, or an analyst tasked with valuation, this guide will equip you with the insights and tools needed to compete (and win!) in today’s M&A environment.
Let’s begin by examining the market forces reshaping upstream M&A in 2025.
In 2025, the upstream M&A market has shifted from its previous Permian-centric focus to a more geographically diverse landscape. Buyers are now screening a wider range of assets for acquisition opportunities, with growing interest in regions such as the Midland Basin, Eagle Ford, Williston Basin and Western Canada. This diversification is driven by the saturation of core Permian acreage and the emergence of high-quality private opportunities in other basins.
The first quarter of 2025 saw approximately $17 billion in upstream M&A activity. While deal volume remains lower than in previous years, the average deal size has increased significantly. Notable transactions include EQT’s acquisition of Appalachian assets and US Energy’s purchase in the Delaware Basin. Buyers are paying $3–4 million per undeveloped location for inventory that breaks even at $45–50 per barrel, with some moving up the cost curve to target $55–60 breakeven assets.
Recent activity has been dominated by property deals, with dozens of transactions totaling billions in value. While corporate mergers still occur (particularly among public companies), strategic alignment and management compatibility remain key hurdles. The market has seen a shift toward fewer but larger deals, with a growing emphasis on long-term inventory quality over short-term production metrics.
Several macro and strategic factors are shaping the upstream M&A landscape:
To succeed in this evolving environment, upstream companies should consider:
These trends set the stage for the landmark deals we’ll explore next. To see how leading operators are navigating these trends with data-driven strategies, explore our solutions that help you develop and optimize your inventory here.
Two significant M&A deals have shaped the upstream oil and gas market in 2025 so far – Diamondback’s acquisition of Double Eagle and Whitecap’s acquisition of Veren. As we will see a little later, these case studies provide a great foundation for understanding the strategies and approaches used by leading companies in the industry. We will delve deeper into the specifics of these deals in subsequent sections, particularly focusing on asset valuation and development, but let’s quickly go through the basics now.
Diamondback Energy’s acquisition of Double Eagle’s properties in the Midland Basin is a prime example of strategic consolidation in a highly competitive market. Announced in February 2025, this deal involved Diamondback paying approximately $4 billion for Double Eagle’s assets, which included around 40,000 net acres and 342 net locations. The acquisition price per undeveloped location was notably high, at about $7.3 million.
This transaction highlights Diamondback’s focus on expanding its footprint in the Midland Basin, while leveraging the high-quality undeveloped inventory of Double Eagle. Like we hinted at in the introduction, this deal also underscores the importance of strategic fit and operational efficiencies in driving value creation. In the following section we will explore how operators looking to make an exit need to move beyond a straightforward PDP analysis to prove value to potential buyers.

The merger between Whitecap Resources and Veren in the Duvernay-Montney play represents another significant M&A deal in 2025. Valued at nearly $5 billion, this merger combines the strengths of both companies, while creating a new entity with substantial production and inventory capabilities. The combined entity now stands as the sixth largest operator for proved, developed, producing wells in the basin.
Whitecap and Veren’s merger was driven by the strategic alignment of their assets and the potential for enhanced operational efficiencies. In later sections, we will examine the methodologies used to evaluate the combined inventory and production potential of Whitecap and Veren.
These Diamondback and Whitecap case studies illustrate both the dynamic nature of the upstream M&A market in 2025, and signals key shifts in how inventory is assessed and valued in the market going forward. Both deals highlight the importance of strategic fit, operational efficiencies, and accurate asset valuation in driving successful transactions. As we progress through this e-book, we will draw on these examples to illustrate a few proven strategies and approaches for asset valuation as well as development approaches.
In today’s upstream M&A market, undeveloped inventory is often the most valuable (but also the most scrutinized) component of a deal. Buyers are no longer content with vague upside potential. They expect clear, data-backed valuations that demonstrate how undeveloped reserves translate into future cash flow.
That said, it’s getting harder to prove the value of undeveloped assets and potential sellers looking for an exit need to embrace a flexible data-driven approach when assessing existing assets, whether they’re proven or not. To meet these expectations, sellers must move beyond traditional PDP-based metrics. While PDP still plays a role, buyers now prioritize:
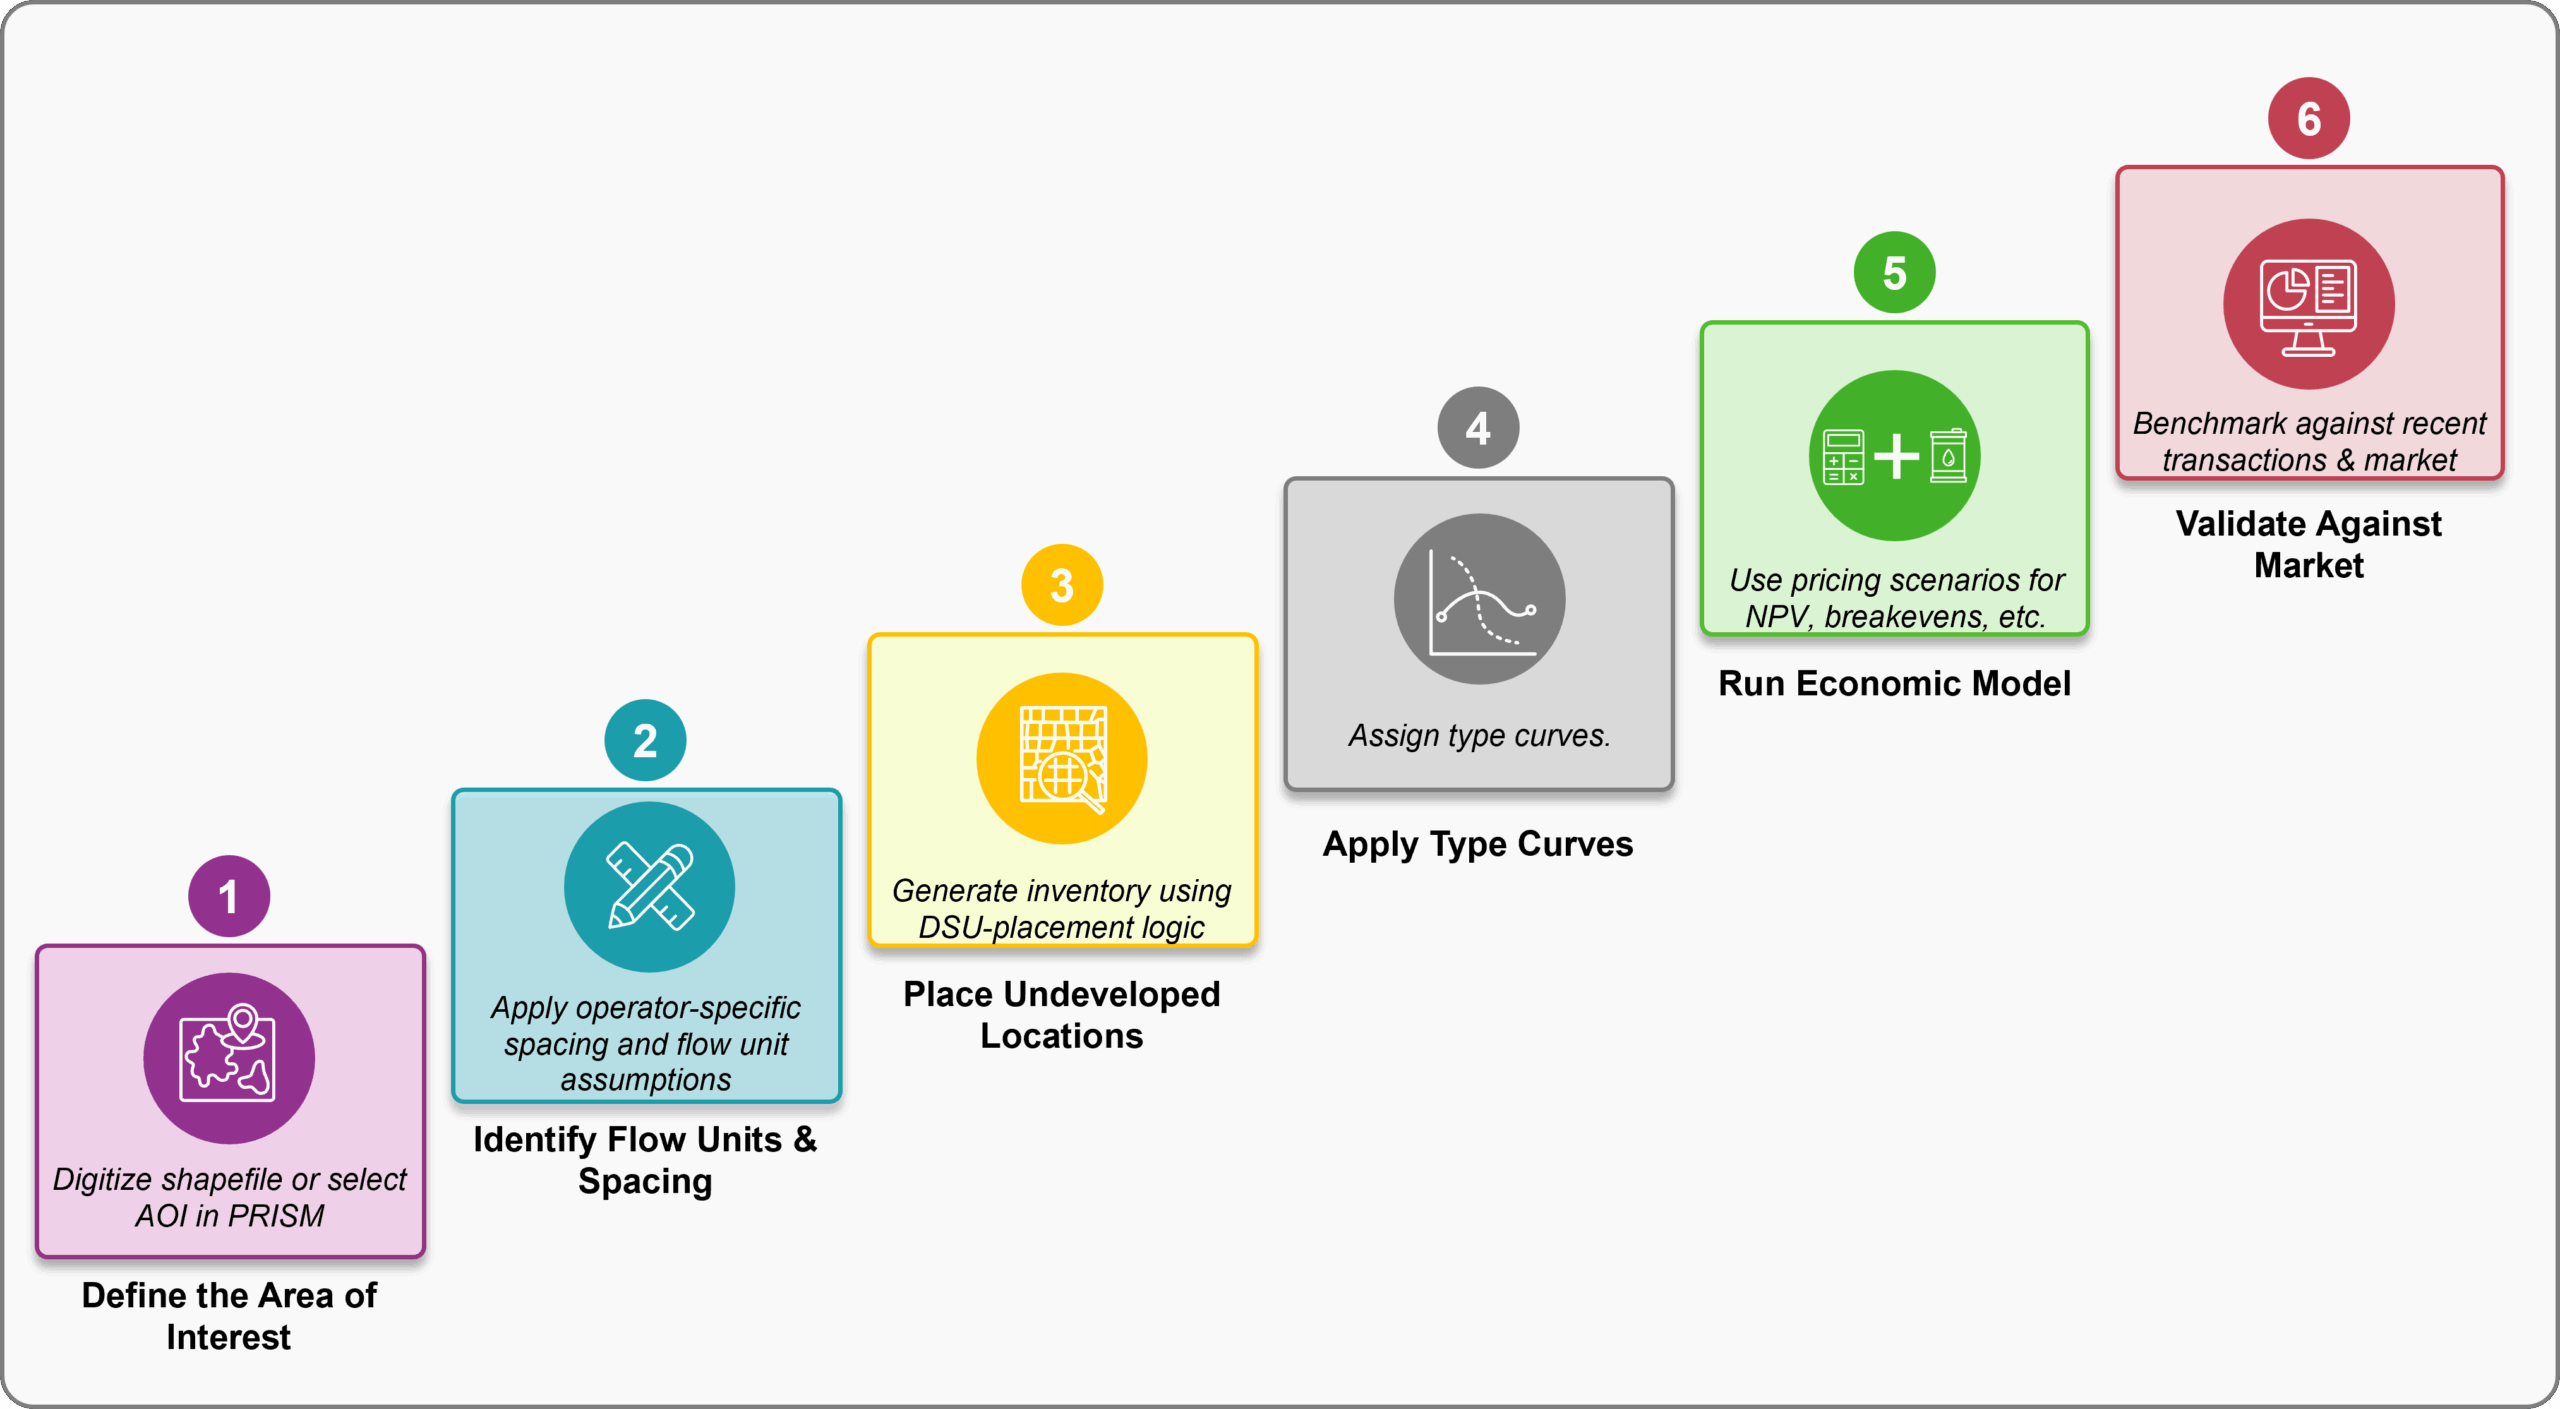
The key is not just using these metrics but showing how they were derived. PRISM enables operators to model undeveloped value at the DSU level, incorporating custom spacing assumptions, flow unit-level intelligence and type curves based on actual operator behavior. This level of granularity builds trust and credibility with buyers.
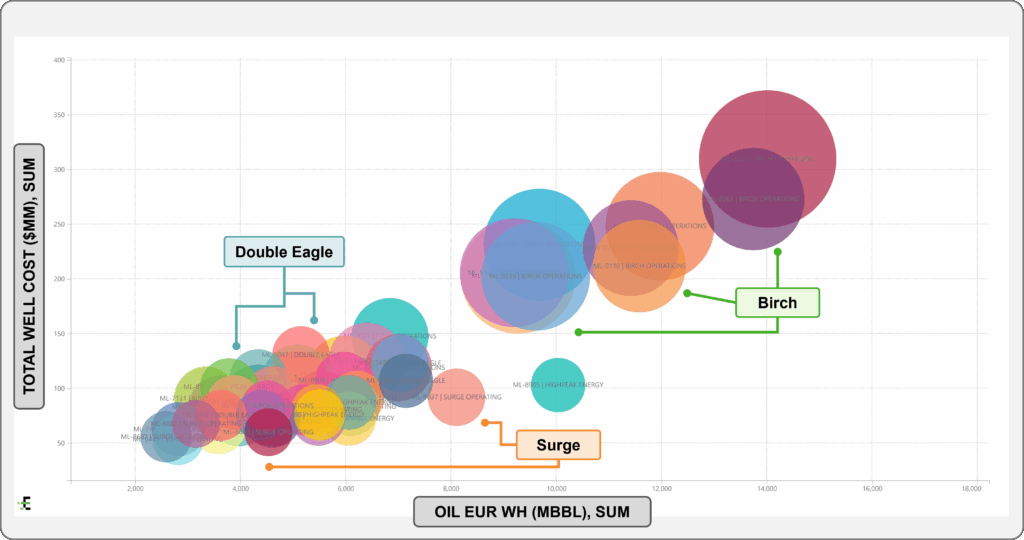
A standout example is the already-mentioned $4 billion acquisition made by Diamondback of Double Eagle’s Midland Basin assets. Despite softening commodity prices, Diamondback paid approximately $7.3 million per undeveloped location. It’s important to note that only 34% of the deal value was attributed to PDP, with the rest driven by undeveloped reserves. Using Enverus PRISM, analysts were able to recreate 401 of the 407 undeveloped locations cited in the deal, allowing us to validate the valuation and offer a peak into how our approach could be replicated in other territories.
To learn more about how Enverus supports this kind of modeling and valuation, visit here.
The Diamondback-Double Eagle example illustrates a broader trend: buyers are willing to pay premiums for undeveloped inventory, but only when the value is proven through rigorous modeling. Sellers who can demonstrate how their inventory was placed, what assumptions were used, and how those assumptions align with regional development patterns are far more likely to command attention, and premium pricing.
Takeaway:
Benchmarking also helps identify operational outliers—both positive and negative. For example, a company with lower D&C costs but similar EURs may offer untapped value. Conversely, high capex with underwhelming recovery can signal inefficiencies or poor development planning.
Takeaways:
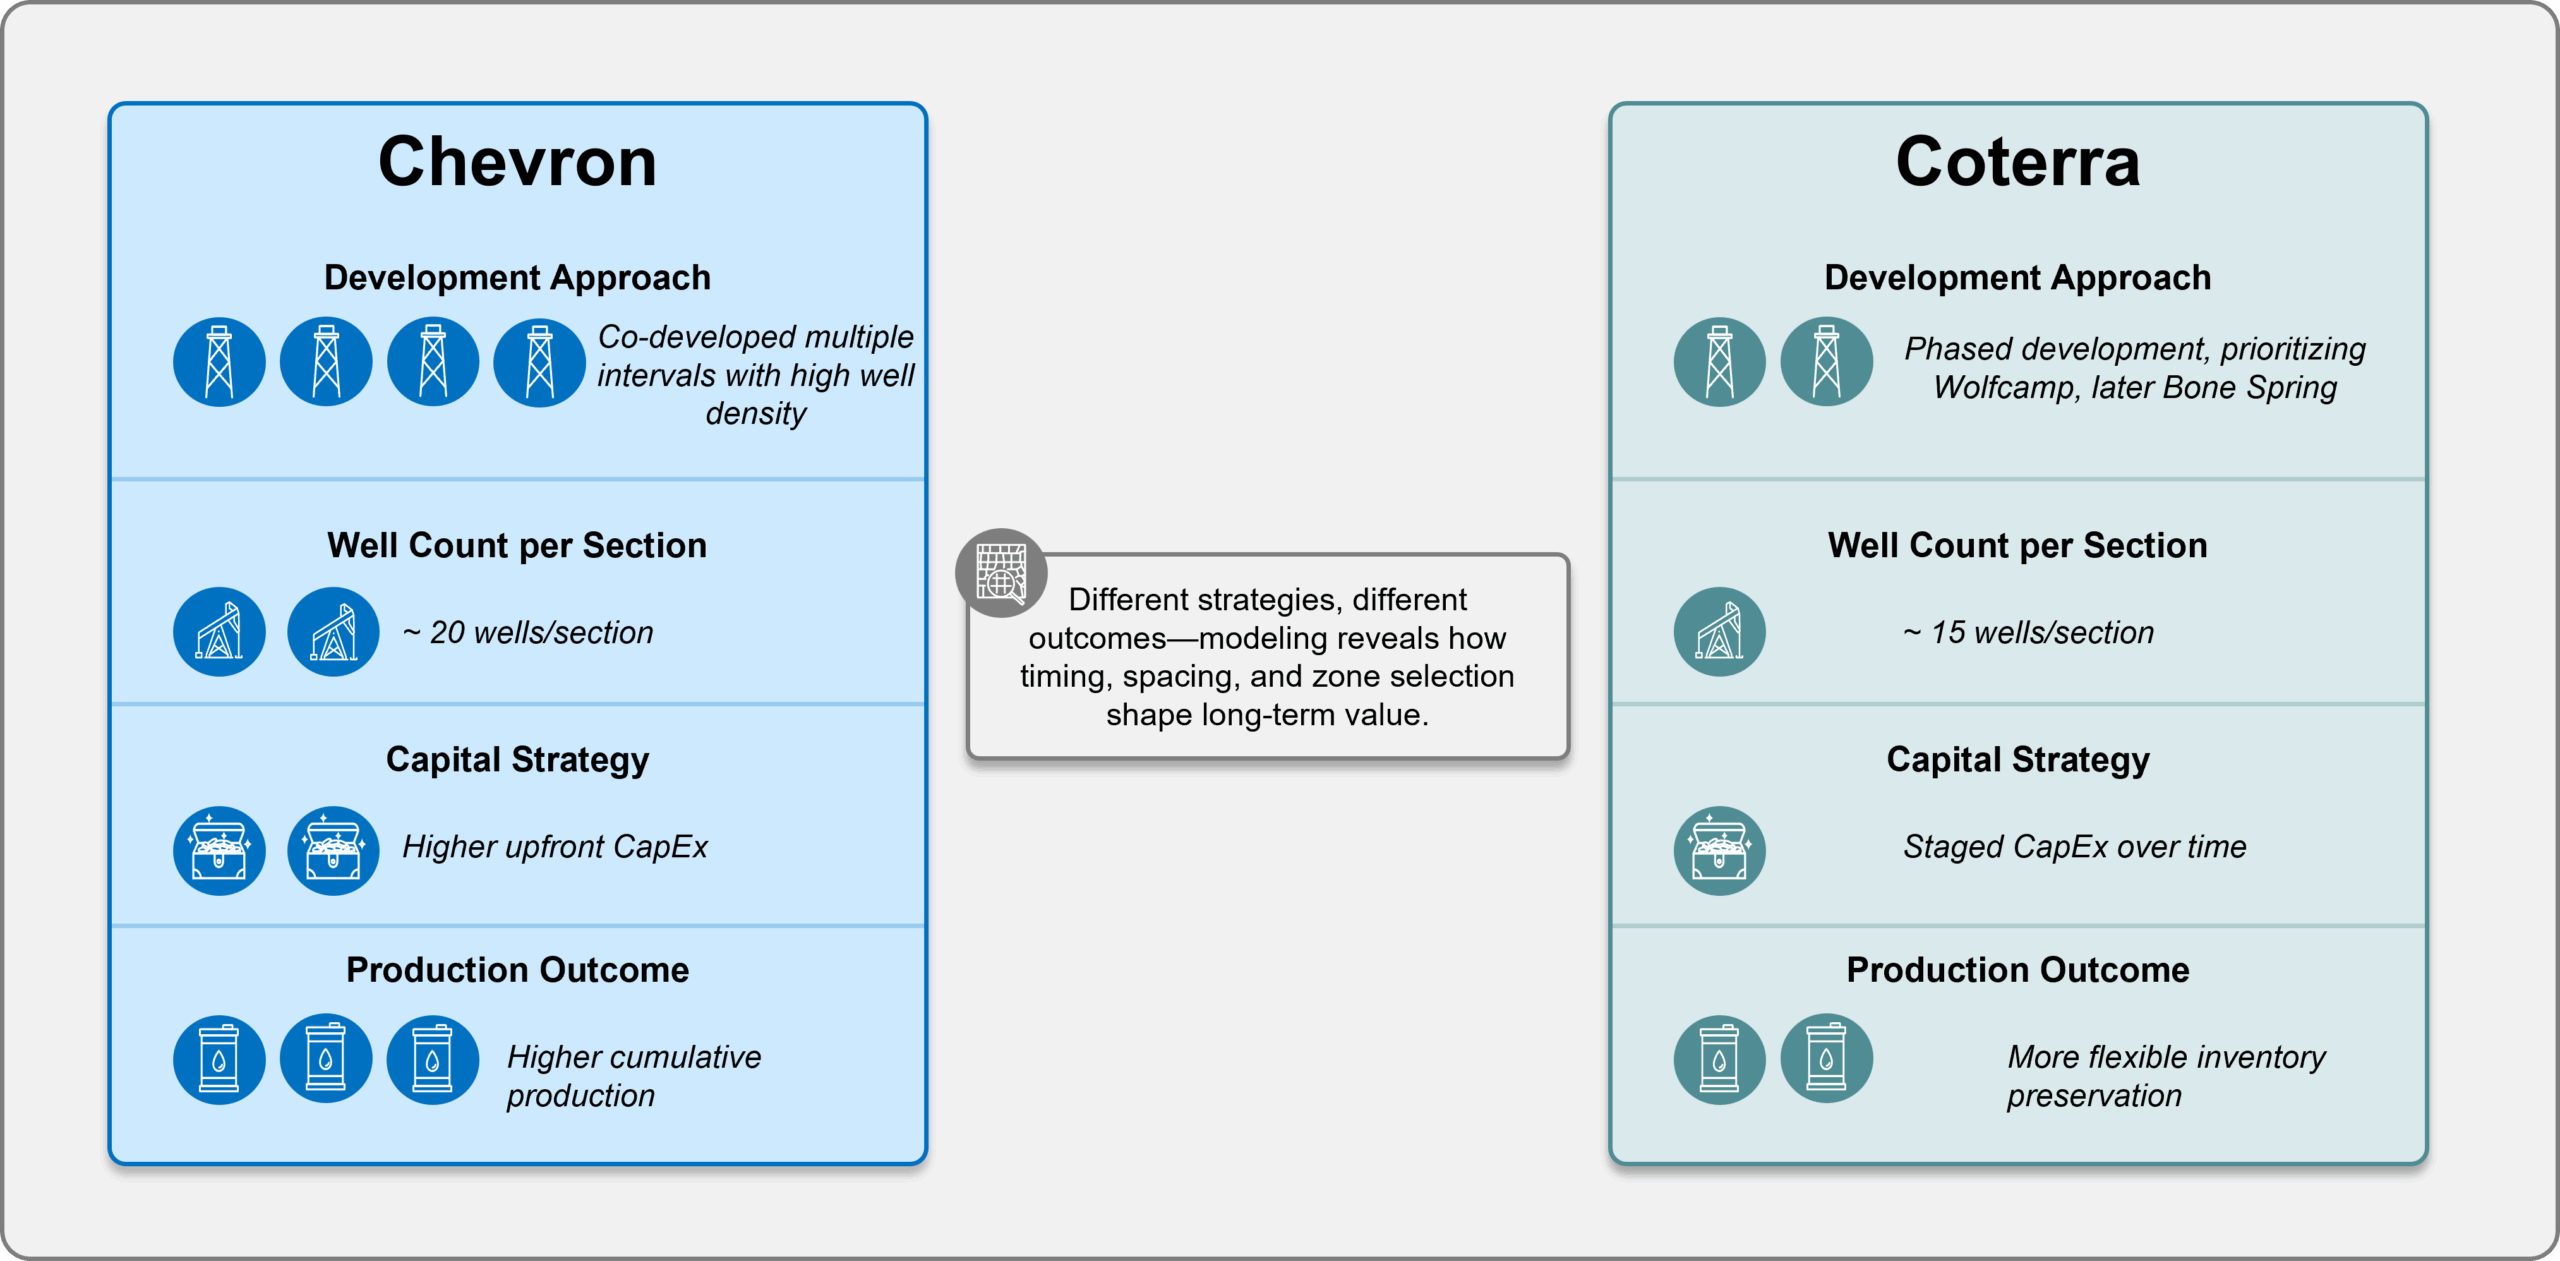
By modeling these scenarios, teams can examine how development sequence, spacing and capital allocation impact outcomes. This type of analysis helps assess potential trade-offs across different strategies.
Takeaway: Development strategy can influence both near-term returns and long-term inventory value. Modeling different scenarios provides important context for decision-making.

Gas-weighted assets are gaining renewed attention in 2025. This shift is supported by rising U.S. LNG exports and moderate price recovery, which have made some gas portfolios more attractive.
However, while interest is growing, buyers remain selective. Assets must show economic viability under a range of assumptions not just in terms of scale but also capital efficiency and future potential.
With PRISM, users can:
The Whitecap and Veren merger offers a timely example. Analysts identified nearly 10,000 undeveloped locations, helping position the combined entity for long-term growth in the Montney and Duvernay.
Takeaway: Gas assets can be competitive when supported by clear, well-documented economics. Modeling helps clarify which opportunities are viable in the current environment.
The 2025 upstream M&A market is shaped by strong deal values and more rigorous buyer expectations. Today, the focus is not only on what assets are producing now, but what they might produce in the future, and more importantly how efficiently that value can be unlocked.
This e-book has covered several important themes:
Common Pitfalls to Avoid:
Tools That Support the Process:
Final Thought: Success in today’s upstream M&A market depends on clear analysis and credible modeling. Demonstrating value rather than just projecting it can help both buyers and sellers make better-informed decisions.
To explore how Enverus workflows support your M&A process, visit our resource library or connect with our team for a custom walkthrough.
People, process and technology for E&P innovators looking to disrupt the old and usher in the future of energy.
Read More About our E&P Solutions
Respond faster to rig and activity trends with real-time GPS and satellite telemetry data analytics.
Read More About Activity Analytics
An essential set of O&G data analytics. Redeploy your team’s bandwidth to higher value analysis and strategy with clean analytics-ready data sets.
Read More About Foundations
Track activity in near-real time to get the most recent and actionable insights on operators, leases, rigs, permits and more across the industry.
Read More About Oilfield Services
Technical research, publications and direct access to industry experts that leverage today’s most advanced analytics and technology to deliver independent, third-party insight into oil and gas, power, liquefied natural gas and renewables.
Read More About Intelligence
Let’s get started!
Let’s get started!
We’ll follow up right away to show you a quick product tour.
Ready to Subscribe?
Ready to Get Started?
Ready to Subscribe?
Sign Up
Power Your Insights