The energy landscape is undergoing a rapid, massive shift, driven by mounting external pressures, evolving political and regulatory policies, consumer preferences and emerging technologies. Inaction in this time of change is no longer an option for businesses, as it poses immense risks and missed opportunities. This Energy Transition Quarterly E-Book has been diligently crafted to equip you with vital insights and strategies to navigate these complex challenges and adapt to the ongoing energy transition.
Enverus Intelligence Research, Inc., a subsidiary of Enverus, provides the Enverus Intelligence® | Research (EIR) products. See additional disclosures.

Date Published: 09/21/2023
Upstream operators are increasingly exploring the energy transition, but many remain hesitant to deploy capital. Any decision, including inaction, must be well informed and deliberate in response to growing stakeholder demands. An upstream operator’s transition strategy will be shaped by the context of its business and assets, the capability of its skill sets and, most importantly, its conviction around the energy transition itself.
Conviction or participation in the energy transition is categorized into three levels: aware, adapt and adopt. Most operators show an awareness of the energy transition by adhering and complying with policy and regulations. Energy transition strategies within the adapt and adopt levels start to involve strategic asset acquisitions. For example, OXY is partnering with TerraLithium, its subsidiary, to develop DLE technology and XOM’s acquisition of DEN for $4.9 billion bolsters its CCUS business.
Upstream operators are uniquely positioned to participate in the energy transition, and this does not require them to invest in something that puts them out of business.
Date Published: 07/20/2023
The attractiveness of IRRs across various energy transition technologies is noteworthy, sometimes surpassing established oil and gas business models. The arrival of these new opportunities often requires strategic partnerships but continues to prove to be economic (sometimes wildly) on a broad scale.
Traditionally, oil and gas wells have demonstrated wider distributions and higher average IRRs, owing to both prevailing sentiments surrounding the energy mix and the inherent geological risk factors involved. This remains the case for most scenarios, but solar and wind projects follow a much different approach. In this case, power purchase agreements are used for different market structures, arranging delivery at a specific rate of return. The further improvement of that structure sees IRR values for solar and wind generation to increase in the long term.
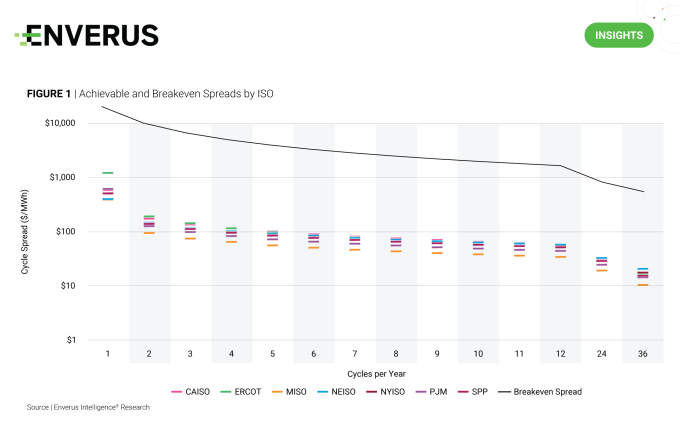
The emergence of new battery storage projects presents an enticing opportunity for significant returns, contingent on optimal storage market conditions. EIR can see a consistent 60%-80% IRR rate for some of the major ISOs across the United States implementing battery storage. The ability to store excess energy and release it during peak demand times not only enhances grid stability but also creates additional revenue streams.
As the energy industry continues to evolve, stakeholders will be rewarded for a watchful eye on emerging opportunities across various sectors.
Date Published: 10/19/2023
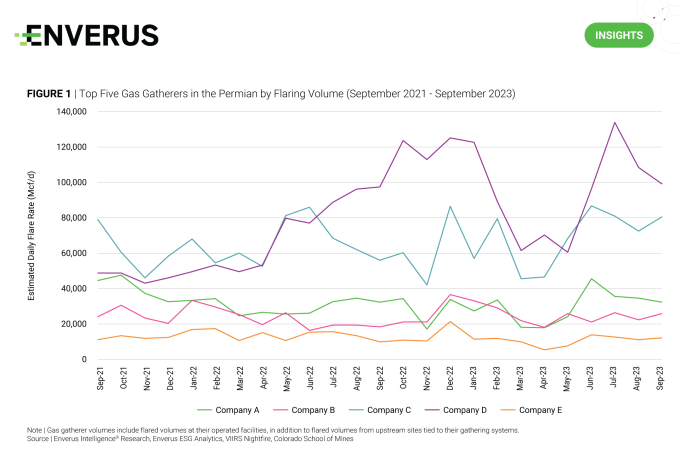
Satellite-detected flaring data for the Permian shows volumes increased by 22% in the 12 months through September, with July rates nearing the three-year highs last seen in December 2022. Flaring rates in the Midland went up to 1.7x that of the Delaware from May to July, with several upstream operators recording sharp increases during those months. But not all operators ramped up on flaring; wells attached to certain gas gathering systems exhibited noticeably higher rates than others.
Stepping back, EIR can speculate that these spikes are related to equipment failures from the extreme heat waves that gripped Texas over the summer, with the effects on emissions garnering negative media attention. They expect excess flaring at the wellhead due to takeaway issues will likely challenge the upstream sector’s ability to achieve its short-term ESG goals, particularly regarding flaring intensity.
Figures are based on nightly irradiance measurements taken by VIIRS instrumentation on board NASA and NOAA satellites. EIR’s recently introduced gas gatherer field allows for quick identification of system bottlenecks that may affect upstream operators. The full dataset is currently available to all ESG Analytics clients.
Date Published: 08/03/2023
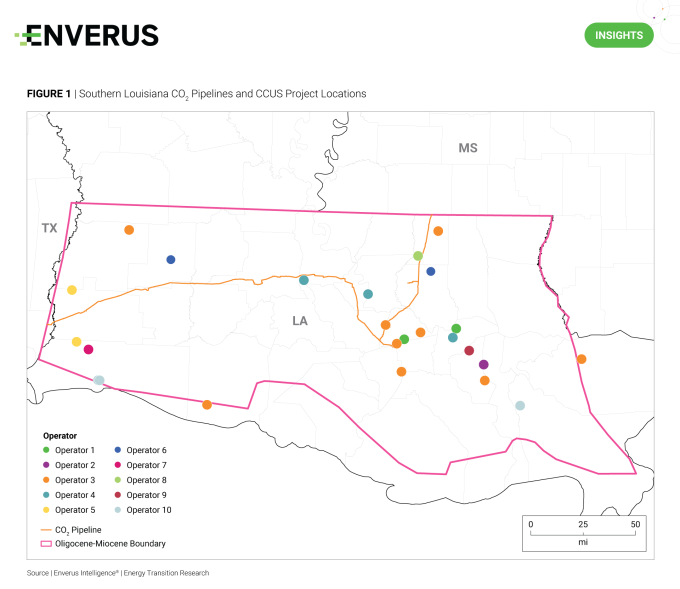
XOM’s recent acquisition of DEN for nearly $5 billion firmly places the buyer and its Low Carbon Solutions business as a leader in CCUS. Its dominant position is even more apparent in southern Louisiana where DEN was very active in securing midstream partnerships and storage sites around its Green and NEJD CO2 pipelines. XOM is now a midstream and/or storage partner in nine of the 22 announced CCUS project in southern Louisiana, as well as being the owner and operator of the only CO2 pipelines in the region. Its CCUS participation includes storing at least 48 mtpa of the 84 mtpa of total planned storage in the area. This does not include volumes related to recent storage announcements for its Libra and Virgo projects that currently do not have annual storage targets.
Current throughput for XOM’s Green pipeline is about 4 mtpa, only 25% of the 16 mtpa capacity. The remaining capacity, however, is far from enough to satisfy the demands of the rapidly expanding southern Louisiana CCUS market. If all announced capture and storage projects in the area go through, at least 50 mtpa of additional transportation capacity will be needed by 2030. Expansion of XOM’s existing CO2 infrastructure and the addition of new CO2 pipelines through new builds or repurposing existing pipelines and rights of way will need to happen in relatively short order to meet project timelines.
Date Published: 10/05/2023
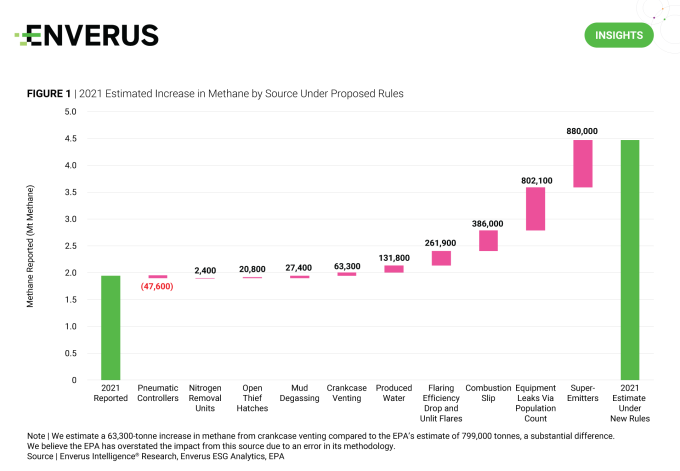
The 2022 IRA accelerated the need for accurate and comprehensive oil and gas emissions reporting to appropriately calculate the “waste emission charge,” or the methane tax. Operators that report under Subpart W of the EPA’s Greenhouse Gas Reporting Program will be required to pay the tax starting in 2024, provided facilities exceed the methane intensity threshold. To improve the accuracy of methane reporting, the IRA directed the EPA to make changes to Subpart W, with the latest ~650-page rulemaking from August. These changes include: 1) requiring data to be reported at a pad or site level, rather than at a basin level; 2) incorporating more empirical data; 3) adjusting bottom-up emission calculation methodologies; and 4) capturing a broad range of emissions sources not currently covered by Subpart W.
Based on EIR’s recalculation of 2021 reported emissions, EIR estimates the EPA’s proposal would have increased recorded methane emissions from the upstream and gathering sectors by 2.5 Mt, more than doubling levels reported that year. This is mainly driven by super-emitters or large release events, changes to equipment leak factors, combustion slip from engines and changes to flaring efficiencies. These changes will impact publicly stated emission targets, likely causing PR headaches, and would have increased total methane tax liabilities threefold to $2.9 billion, had the revisions been in effect in their current form.
Date Published: 09/07/2023
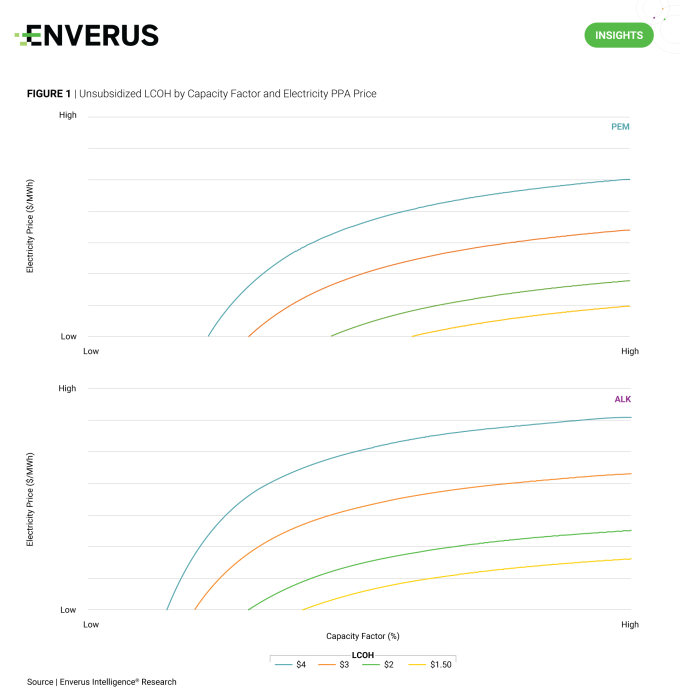
While EIR is still waiting for guidelines from the IRS regarding hydrogen incentives released with the IRA last year, it is clear that supportive policy must be in place for green hydrogen to compete in existing hydrogen markets. EIR’s analysis suggests that unsubsidized green hydrogen projects must secure power purchase agreements (PPAs) below $10-$15/MWh and achieve capacity factors of at least 40%-60% to compete with gray hydrogen, which EIR estimate sells around $1.50/kg. However, meeting these conditions is extremely challenging, underscoring the need for tax incentives such as the 45V hydrogen production tax credit (PTC) to provide competitive returns for green hydrogen.
This point is further emphasized when considering that the average capacity factor for U.S. windfarms built since 2015 is 38%, which is insufficient considering that proton exchange membrane (PEM) and alkaline (ALK) hydrogen electrolyzer projects break even at 53% and 31% capacity factors at $40/MWh PPAs. Increasing the capacity factor from 55%-90%, which simulates an oversized windfarm and grid electricity paired with renewable energy certificates, respectively, raises the PEM NPV by a factor of 24 and the ALK NPV by around 2.5 times. Ensuring tax incentives like the 45V PTC allow projects to use grid electricity paired with renewable energy credits would provide flexibility for projects to meet carbon intensity requirements and support higher capacity factors, in EIR’s view.
Date Published: 08/31/2023
The Vogtle Unit 3 nuclear reactor began its commercial operations at the end of July. Based in Georgia, the facility will provide clean electricity to the southeast U.S. for likely longer than the next half-century. This marks the first U.S. deployment of Westinghouse’s AP1000 Generation III+ reactor. Its completion represents a significant milestone in the U.S. nuclear industry, being the first reactor to be built from scratch in over a decade. Detractors will point to the massively over-budget and over-time project completion, though the next generation of nuclear technology is leaps ahead with regard to safety and project standup time. If a resurgence is to occur, the ability of new advanced nuclear reactors to provide low-emissions baseload power with a fraction of the footprint of renewables positions them well for the grid of the future.
Are we on the brink of a potential resurgence of nuclear deployments? Microsoft and Nucor are among the major U.S. companies to have initiated equity partnerships with advanced reactor companies, signaling an interest and commitment to exploring the potential of utilizing nuclear energy in their operations. Additionally, representatives of eastern European nations have committed to the deployment of dozens of advanced reactors before the end of the decade. Suppliers in the U.S. and abroad look to Europe’s favorable regulatory frameworks and approval processes to lead the adoption of new reactor technologies, expecting that once ground is broken on initial facility sites the North American market will change its tune.
Date Published: 08/17/2023
The Vogtle Unit 3 nuclear reactor began its commercial operations at the end of July. Based in Georgia, the facility will provide clean electricity to the southeast U.S. for likely longer than the next half-century. This marks the first U.S. deployment of Westinghouse’s AP1000 Generation III+ reactor. Its completion represents a significant milestone in the U.S. nuclear industry, being the first reactor to be built from scratch in over a decade. Detractors will point to the massively over-budget and over-time project completion, though the next generation of nuclear technology is leaps ahead with regard to safety and project standup time. If a resurgence is to occur, the ability of new advanced nuclear reactors to provide low-emissions baseload power with a fraction of the footprint of renewables positions them well for the grid of the future.
Are we on the brink of a potential resurgence of nuclear deployments? Microsoft and Nucor are among the major U.S. companies to have initiated equity partnerships with advanced reactor companies, signaling an interest and commitment to exploring the potential of utilizing nuclear energy in their operations. Additionally, representatives of eastern European nations have committed to the deployment of dozens of advanced reactors before the end of the decade. Suppliers in the U.S. and abroad look to Europe’s favorable regulatory frameworks and approval processes to lead the adoption of new reactor technologies, expecting that once ground is broken on initial facility sites the North American market will change its tune.
Date Published: 07/27/2023
Countries around the world are increasingly embracing clean hydrogen as a central pillar of their energy transition strategies, with announced global production expected to increase 42-fold by 2030. Green hydrogen has especially gained widespread attention because of its decarbonization potential, role in energy storage and versatility as an energy carrier.
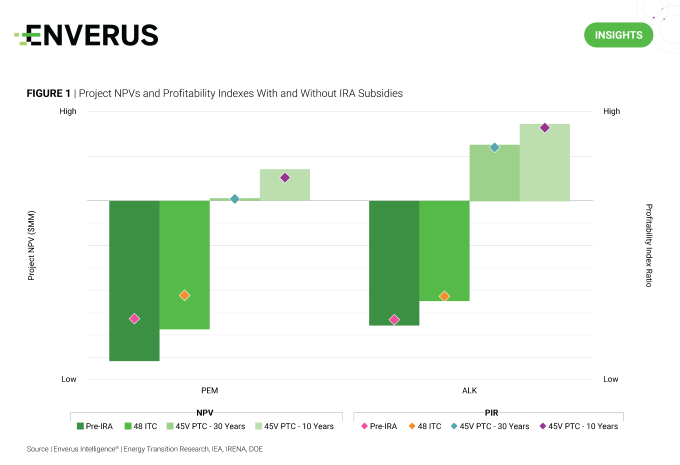
Government incentives like the IRA aim to reduce production costs and support market development by encouraging innovation and driving early supply growth. EIR’s modeling suggests that the IRA’s 45V PTC) meaningfully bolsters economics and drives positive returns among green hydrogen generation projects. Capex only represents a small percentage of overall costs, limiting the relative impact of the IRA’s clean energy investment tax credit (48 ITC) compared to the 45V PTC for both alkaline and PEM electrolyzers.
While the PTC provides support for the first 10 years, EIR notes that net cash flows turn negative for the remainder of the 30-year modeled life after the tax incentives expire. This results in lower NPVs and profitability index ratios for alkaline and PEM projects over a 30-year project life compared to the 10-year scenario. Project operators will likely need to renegotiate power purchase agreements at lower prices, realize extensions to the 45V PTC or secure premiums on the green hydrogen sales price to justify continued production after year 10.
Date Published: 07/06/2023

The Biden administration’s ambitious plan to supercharge EV and alternative fuel corridors with the installation of 500,000 electric chargers has already revved up the expansion of direct current fast chargers (DCFC) to address range anxiety among EV owners. Since the introduction of the EV infrastructure plan in April 2021, more than 16,000 public DCFCs have been installed, contributing to the current total of over 37,000 available across 10,700 charging stations. California, Florida and Texas claim the top spots in terms of fast charger count, representing about 22%, 24% and 26% in each respective state.
Several prominent players have emerged as leaders in the fast-charging network space, including Tesla, Volkswagen (Electrify America) and EVGO. Tesla boasts 2.5 times more fast chargers in its network than Volkswagen and EVGO combined. The overall charger count in the U.S. has surged by an astonishing 38% in just 27 months, with 25% of this growth attributed to the installation of fast chargers. Tesla has spearheaded this expansion, installing around 9,500 new fast chargers, and is now opening its network to non-Tesla vehicles. Consequently, the growth in total DCFCs since the announcement of EV corridors amounts to an impressive 45%.
To meet the charging corridor requirements a station must have at least four 150 kW chargers with CCS connectors and sit within a mile of a designated corridor. According to EIR’s EV infrastructure database, the U.S. has connected almost 108,000 chargers and 45,000 stations located within one mile of both ready and pending EV corridors. Of this total, 8,073 stations offer DCFC capabilities, 571 have at least four 150 kW CCS chargers and 7,502 existing DCFC stations could be retrofitted with additional chargers to meet these requirements.
The significant increase in DCFCs has been instrumental in paving the way for widespread EV adoption. The country is on its way to realizing a comprehensive and accessible charging network, though it has a long way to go before it reaches 500,0000 fast chargers. These developments bode well for the future of electric mobility in the U.S., encouraging further EV adoption and investment in the EV sector.
Date Published: 09/28/2023
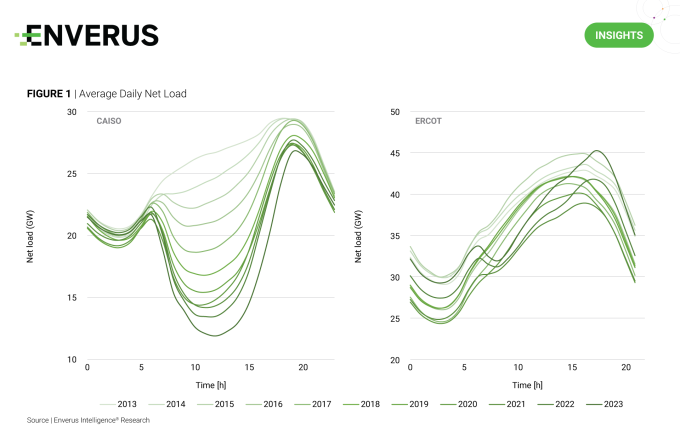
Net load variability poses a challenge for system operators that must balance supply and demand using traditional thermal generation. The figure above shows how the average daily net load (power demand net of renewable generation) has evolved since 2013 in CAISO and ERCOT. CAISO’s net load curve has shifted into the shape of a duck due to the rapid growth in solar generation, both behind and in front of the meter. The ratio of solar installed capacity to peak load in today’s ERCOT system resembles that of CAISO in 2016 (~15%). However, Texas has a closer balance between wind and solar installations than California and wind generation in ERCOT reduces the net load curve in the evening and night hours. This combination will eventually lead to a daily net load profile with a trough in the middle of the night when demand is low and wind is high as well as a trough in the middle of the day when solar generation is strong. EIR expects this profile will present a unique opportunity for batteries to exploit energy arbitrage twice a day in ERCOT, while CAISO’s lack of wind limits arbitrage to cycle once per day.
EIR also expects steeper ramps in the morning and evening, which will force natural gas power plants to adjust their output to meet fluctuating net demand. Such flexible operation requires more frequent maintenance and may result in an overall deterioration of the gas-fired plant’s fuel efficiency. Along with a shrinking capacity factor, this increased cost will pressure profitability and EIR expects thermal generators to bid higher during ramp-up demand hours to offset this pressure. Ultimately this should result in higher peak locational marginal pricing during these ramping hours which again benefits storage assets.
Date Published: 09/14/2023
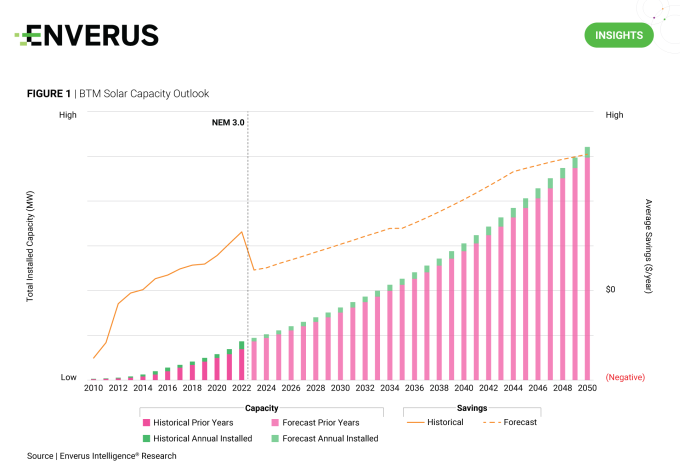
Behind the meter (BTM) solar is a key factor in decreasing load in CAISO, especially in California where it has the most impact on annual demand. The state’s potential for nearly 195 GW of rooftop solar capacity exists, although its full realization is unlikely. The implementation of new building codes mandating rooftop solar installations is set to contribute around 1.5 GW per year to this growing trend. With an existing 9 GW of residential rooftop solar and annual growth of 15%-17%, the recent introduction of the Net Energy Metering (NEM) 3.0 policy is expected to shift the landscape, causing a temporary slowdown in BTM solar installations and a corresponding rise in BTM storage installations. This is due to the policy’s financial disincentives for excessive solar deployment in residential systems.
Nevertheless, the synergy of increasing power prices and diminishing solar costs is poised to enhance the viability of BTM solar installations. By adhering to this trajectory, the prospect of reclaiming pre-NEM 3.0 levels by 2034 emerges, with a projected stable annual growth rate of 5%, leading to over 52 GW total BTM solar capacity by 2050.
Date Published: 08/24/2023
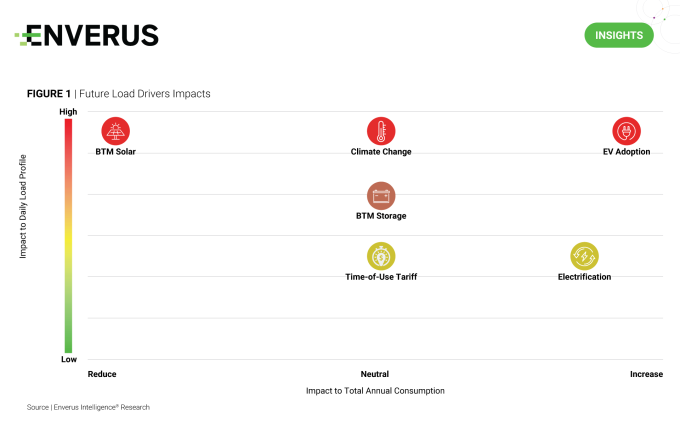
Historical factors and trends are becoming less descriptive of future power demand. The growing pace of electrification and EV adoption are changing the power demand dynamics. At the same time, more customers are installing BTM generation to take control of their energy destiny, which lowers net demand for the grid. One must also consider the long-term impact of climate change, where higher levels of weather variability are changing the energy demand from heating and cooling systems. Things have gotten a lot more complicated.
How can one build a reliable power demand forecast? EIR recently published a long-term demand forecast for CAISO. EIR built an hourly demand outlook from the ground up based on key factors like EV adoption, electrification, BTM generation, climate change and changing tariffs. The figure above summarizes these load drivers and categorizes them based on their impact on total demand and daily load profile. BTM solar and EV adoption, driven by new building codes and state mandates on new vehicle sales, have the biggest impact on future demand in California and are vastly different than historical trends. This type of bottom-up analysis is critical when forming views on future demand in power markets. Because of these future load drivers, EIR expects to not only see an increase in demand of 10% by 2050 but also a big change in the shape of the intraday and seasonal load profiles.
Date Published: 10/12/2023
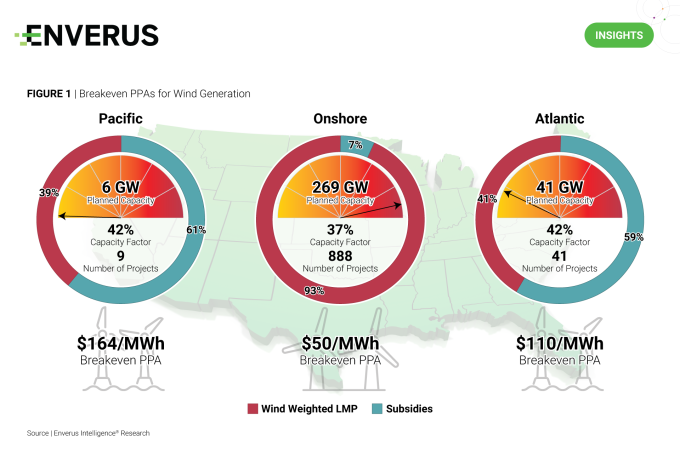
The Biden administration has a goal to deploy 30 GW of offshore wind by 2030. In EIR’s opinion, significant federal incentives will be required to turn this target into reality. Ramping costs, increasing inflation and rising interest rates are negatively impacting the offshore wind industry across the globe. The cost of offshore wind projects increased by 50% from 2021 levels, making them uneconomical. As a result, developers are backing out of their PPAs. For instance, Avangrid and EDP Renewables recently paid penalties to terminate PPAs linked to 3.2 GW of offshore capacity in Massachusetts. Similarly, Orsted announced its willingness to pull back from six offshore projects adding up to 3.6 GW of capacity in the Northeast if the PPAs are not increased to make them economically viable.
EIR calculated the current breakeven LCOE for these projects to generate a 10% IRR and compared that with the current wind-weighted power price for their corresponding jurisdictions. The figure above shows that on average current market power prices will only be enough to cover ~40% of the required breakeven PPA price and the remaining ~60% would have to be garnered from out-of-market sources, likely government subsidies. Previous Enverus Intelligence Research analysis shows how offshore wind is not the most economical option for the New York grid.
Given this uneconomical situation for the offshore wind industry, EIR expects the rest of the developers involved in offshore projects – Dominion Energy, Eversource Energy, Duke Energy, EDF Renewable, BP and Equinor – to either back out of their current PPAs or seek to renegotiate aiming to increase the prices. It is unlikely that utilities or corporates would commit to buying offshore wind power at over $100/MWh when onshore wind power is available at ~$50/MWh. Unless there are significant federal or state incentives for these projects, EIR does not expect the offshore wind targets to be met.
Date Published: 08/10/2023
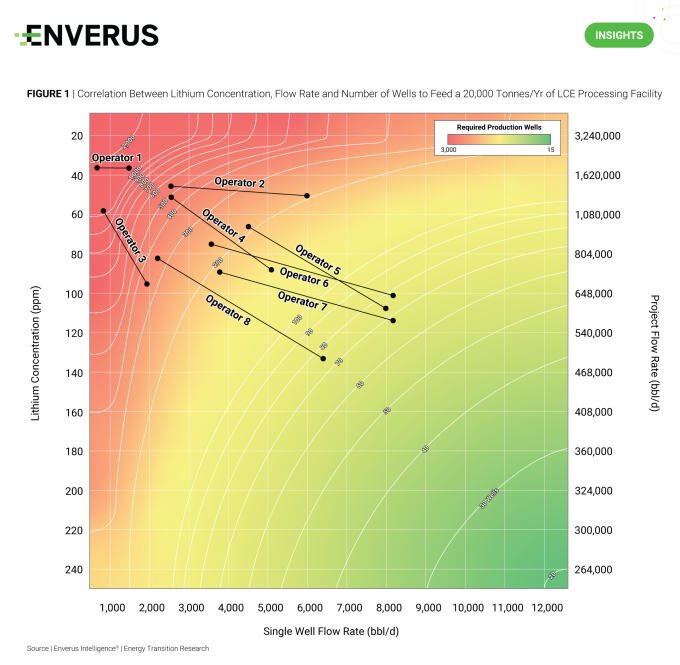
With the IEA’s projection of a 1,300%-5,100% increase in lithium demand by 2040 because of the growing battery market for electric vehicles and power storage, lithium spot prices have surged nearly eightfold since 2020 to $35,000 per tonne of lithium carbonate equivalent (LCE). High lithium demand and high prices have caused a land grab in parts of North America, marking a renaissance of early prospecting but this time for lithium-rich brine. Contenders looking to capitalize on the opportunity are turning to DLE, a short-cycle method of lithium production capable of extracting the resource from low-concentration lithium brines.
The prospectivity of a lithium brine resource is a function of the lithium concentration and the flow rate from the producing formation, primarily dictated by porosity and permeability. As shown in the figure above, increasing lithium concentration or flow rate will reduce the number of wells required to produce a desired lithium output, decreasing project expenditures. In this case EIR’s output assumes 20,000 tonnes/year of LCE, similar to disclosed DLE projects but less than 20% of Australia’s Greenbushes mine at 115,000 tonnes/year of LCE. Higher concentrations of lithium are preferred as increased flow rates ultimately require a larger processing facility.
Date Published: 07/13/2023
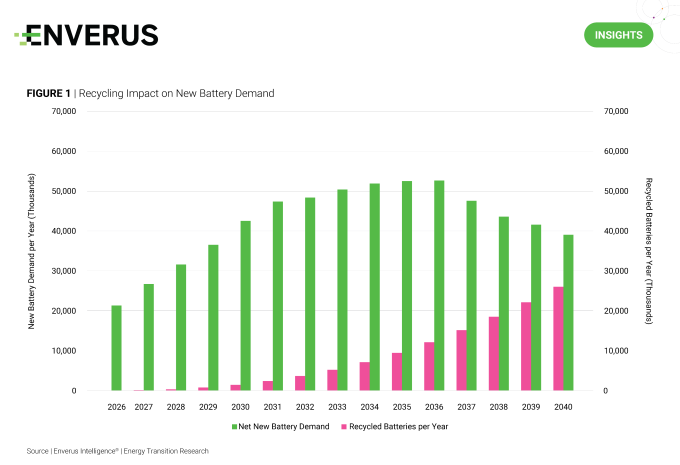
Few question the importance of critical mineral availability in maintaining energy transition progress. An important aspect of the use of base metals is “full recyclability” – the concept where these metals don’t break down during their use and can be reused indefinitely. Nickel, copper and lithium are examples of base metals with full recyclability which makes them arguably the most important for battery technology. In terms of batteries needed to meet EIR’s forecast for EV adoption, EIR sees a peak of ~50 million LDV batteries in the late 2030s for net new mineral demand. This is due to the substantial potential for battery recycling to reduce the requirement for future mineral production.
Tesla has achieved an impressive ~95% of total material recovery from its existing battery recycling program and that number is expected to climb as processes are innovated and refined. Copper recycling already accounts for upwards of 20% of global supply, even though only half the copper available to be recycled ends up in an appropriate disposal facility.
Will the supply of these materials be tight well into the first half of the century? Probably, but it is unreasonable to discount the potential windfalls of recycling and innovation around circularity as incapable of making a difference.
Confidently navigate the volatile energy market, from maximizing the subsurface to reducing emissions in the sky.
Read More about Energy Transition Research
Subsurface Studio helps your geoscience team to be more productive in less time. It accelerates the creation of robust subsurface models, allowing you to perform sophisticated subsurface analysis in minutes instead of weeks. Read More About Subsurface Studio
Designed for today’s rapidly evolving regulatory environment and investment landscape, Enverus equips operators and investors with targeted insights to navigate regulatory challenges smartly and efficiently with deep analytics on energy assets’ emission profiles.
Make the most informed decisions for your investments and operations by enhancing your market and infrastructure outlook.
Read More About Midstream
Bring improved accuracy to your power forecasts with AI and machine learning-based load, renewables and price forecasts.
Read More About Power and Renewables
Let’s get started!
Let’s get started!
We’ll follow up right away to show you a quick product tour.
Ready to Subscribe?
Ready to Get Started?