Rigs have jumped nearly 30% YTD in the Lower 48. The average number of actively fracturing fleets jumped 20% month-over-month in January and has remained steady since. Due to both a large backlog of drilled uncompleted wells (DUCs) built during the pandemic-induced activity crash and the higher-than-anticipated crude prices we’re now experiencing, completion activity — and by extension hydraulic fracture sand demand — is set to increase meaningfully Y/Y.
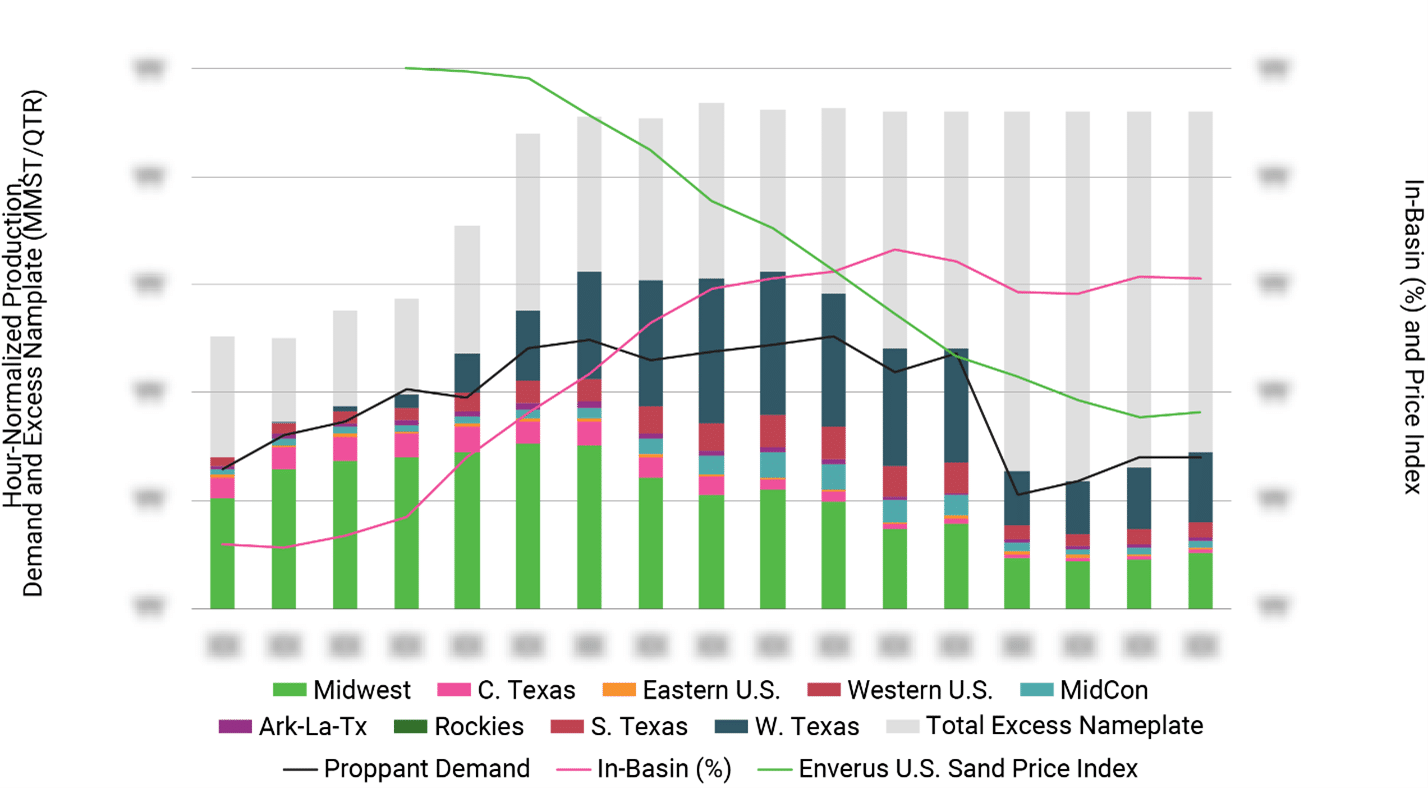
Enverus tracks a multitude of metrics to help companies understand anticipated sand demand, regional sand production levels, total sand supply, and sand pricing. Figure 1 describes the relationships between these metrics. Starting in early 2018 with the large influx of in-basin sand in key regions such as the Permian, the fracture sand industry went through a period of rapid capacity expansion. The total theoretical sand supply grew ~65% over 12 months while actual demand for fracture sand increased only ~35%. With the cost advantages inherent to in-basin sand, many operators abandoned the use of northern white sand (NWS) in favor of the cheaper alternative.
Figure 1 also exhibits of one of our proprietary proppant price indices. It clearly shows the impact of in-basin sand on proppant prices starting in 2018. It appears the steep drop in the price curve has begun to flatten, approaching a minimum threshold cost for sand production. As completion activity begins to return, should we also expect sand prices to increase? Given the large excess capacity that exists, our view is that any price increase will be transitory as plants operating at reduced capacity ramp back up to meet demand needs.
For more on the state of the sand markets, specific regional price indices or information on an ever-increasing number of consumables our team tracks demand and pricing for; contact us at Enverus.
FIGURE 1 | Sand Capacity, Production, Demand and Pricing

Source | Enverus, company reports, FactSet, MSHA


