Trading and Risk

What is a Forward Curve? A Beginner’s Guide (Part 1)

byLaura Blewitt

The industry that drives global commerce and ensures our highest standards of living is underpinned by the complex and fascinating world of commodity trading.

Without commodity trading, our lives would be vastly different. The exchange of physical commodities like crude oil, natural gas, metals and power guarantee that we can do everything from turning the lights on, to receiving packages in the mail, to charging our cell phones.

The intricacies of commodity trading are hard to grasp without the right language, and several of the terms and definitions used by traders are unique from those used by the buyers and sellers of other assets like stocks, bonds, equities or even cryptocurrencies.

Since forward curve management stands at the foundation of Enverus’ key risk management solutions for the energy industry, I figured it might be helpful to take a step back and define what a forward curve is, and why it’s integral to any trading operations’ bottom line. We all have to start somewhere. This post is dedicated to the newbies.

What is a forward curve, and why is it important for risk management?

Simply put, a forward curve is a snapshot representation of what a commodity is currently worth today based on a possible buy or sell in the future. Using a forward curve, I can tell you what the price of WTI crude futures is currently for barrels that would change hands in 2024. Tomorrow, the forward curve will likely determine a different price.

A forward curve is built using the current day’s price values to exchange a commodity at some point in the future, and the commodity’s value will change as time progresses. This is why forward curves are not a price forecast like the formal weekly, monthly, or annual predictions that our analysts produced based on more in-depth fundamentals data. Instead, it’s an indicator based solely on the bids and offers in the marketplace for that day.

Let’s pause and view an example of how prices can be sewn together to create a forward curve. It’s easiest to explain using an instrument called a futures contract, which is exactly what it sounds like: a contract that traders exchange for a determined volume and commodity at a future time period.

While these contracts are bought and sold virtually on exchanges like ICE or Nymex, they represent the buying or selling of a real, tangible product. If you purchase a contract and forget about it, you will be responsible for taking delivery of the commodity you ordered.

Figure 1: Nymex WTI crude futures as of 1pm CT, January 12, 2021. Futures prices shown through March 2022 via MarketView Desktop.

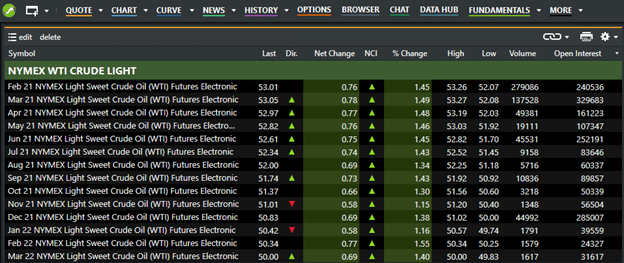
At any given moment in a trade day, there are absolute values for futures contracts far into the future – you can see here that even for contracts delivering crude in March 2022, there are thousands of trades taking place. Each of these transactions influences the movement of the price of futures for the various contract months.

This list of monthly contract prices that we have from the above data, between February 2021 and March 2022, is the foundation of a forward curve. But it makes a lot more sense plotted out in a chart, like this:

Figure 2: Nymex WTI crude futures forward curve shown via MarketView Desktop.

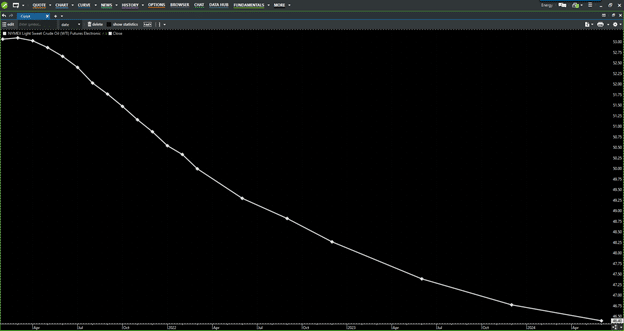
A trader can look at a chart like the one above and quickly tell you if the market is oversupplied or undersupplied – and will define the market structure as either backwardated or contango.

Do you now find yourself asking, “backward-what-now?”

Trust me when I say that I did not just make up those words. Stay tuned for part 2 – where we will dive into the difference between backwardation and contango and share the ways that forward curves can be utilized as a risk management tool for merchants executing complex commodity trades.

The great news for now: you don’t have to be a quant to build complex forward curves. Enverus CurveBuilder gives all people in a commodity trade floor – from storied traders to brand new market analysts – the power to build complex forward curves.

Laura Blewitt

Laura Blewitt

Subscribe to the Enverus Blog

A weekly update on the latest “no-fluff” insight and analysis of the energy industry.

Related Content

CCUS-GettyImages-1056200534
Energy Analytics Energy Transition
ByAndrew Gillick

In case you missed it, Enverus virtually hosted EVOLVE, our flagship conference, May 16-17. The event included two full days of presentations, panels and keynotes, distilling the most relevant data and thoughts on the industry today.  Below Andrew Gillick, managing director...

blog-refinancing
Energy Analytics Other
ByShane Reddell

In the current landscape of heightened environmental and social consciousness, upstream oil and gas companies face significant challenges in achieving favorable refinancing for their existing credit facilities. These challenges are compounded by the recent volatility in the debt markets and...

unprecedented-wildfire-season-singes-alberta-oil-production
Energy Analytics Intelligence Publications
ByMaurice Smith

Wildfires that have already scorched more than double the average annual fire destruction across Alberta forced the shut-in of more than 300,000 boe/d while threatening future shuttering of output from the so-far largely unaffected oil sands region. Record temperatures saw...

ccus-risky-business-post
Energy Analytics Energy Transition
ByHeather Leahey

CO2 containment risk has become one of the most popular topics among our clients evaluating CCUS projects. Operators need to understand and evaluate subsurface features that could trigger CO2 migration and containment losses as well as introduce additional safety, reputational...

ev-parent-image
Energy Analytics Energy Transition
ByRyan Luther

Anyone who thinks spending time at a public charging station is a blocker to buying an electric vehicle (EV) might want to consider the numbers behind EV and internal combustion engine (ICE) vehicle refueling times. The answer is that it...

Enverus Blog - 6 tax preparation tips for mineral and royalty managers
Energy Analytics
BySilas Martin

Recent years have been a roller coaster for mineral buyers, from record low commodity prices to highs for oil and natural gas in the last year. Going forward, challenges and opportunities will be plentiful. We expect oil prices between $80...

wind-power-energy-woman-trader-stock
Power and Renewables
ByKenneth Curtis

It’s that time of year when generator and transmission outages are at their peak in PJM. The first half of April has not disappointed volatility-wise as the WHUB/NIHUB spread has set new 30-day highs largely driven by congestion. Figure 1:...

Enverus Blog - April's energy outlook: Analyst insights you can't miss
Analyst Takes Energy Analytics
ByChris Griggs

May marks a new month, and it’s essential to assess the energy landscape of April. Our Enverus Intelligence® | Research (EIR) team has scrutinized critical trends and advancements, delivering to you insightful analyst takes that can shape your business decisions....

ofs-banner
Energy Analytics
ByCayley Krynowsky

Inventory is king in 2023. Operators and investors alike are more concerned than ever about remaining inventory – who has it, where is it, and will it be economic? To answer these questions, most turn to the tried-and-true, but also...

Let’s get started!

We’ll follow up right away to show you a quick product tour.

Let’s get started!

We’ll follow up right away to show you a quick product tour.

Sign up for our Blog

Access Product Tour

Speak to an Expert

Book a Demo