[contextly_auto_sidebar]
CRUDE OIL
- May WTI settled at $21.51/bbl on Friday, down from last Wednesday’s high of $25.24/bbl. As of this morning’s trading, front-month WTI was testing support at $20/bbl and the front spread has continued deeper into contango at $3.81/bbl. The last time the front spread was this far in contango was in February 2011, when Cushing storage was approaching full capacity. Prompt crude oil prices in the field are approaching single digits in many locations. Shut-ins are likely to emerge in the coming days as US refiners slash throughputs due to the historic drop in consumption for gasoline and jet fuel. According to recent reports, some refineries in Europe and Africa have begun shutting down refineries due to the severity of the COVID-19 outbreaks there. This may be a glimpse of what the future has in store for the United States.
- The Energy Information Administration last week reported an increase in US commercial crude inventories of 1.6 MMbbl for the week that ended March 20, with 0.9 MMbbl of the build in Cushing. Meanwhile, primary inventories of gasoline dropped by 1.5 MMbbl and distillate stocks dropped by 0.7 MMbbl. Total petroleum inventories increased by 2.4 MMbbl, though, due to increases of 3.0 MMbbl in inventories of other oils. It should be noted that the speed of recent events has outpaced the EIA’s reporting schedule. Inventory builds are expected to be significantly larger in the coming weeks.
- The Commodity Futures Trading Commission reported an increase of 10,401 contracts in managed-money long positions in NYMEX light sweet crude futures for the week that ended March 24, with the total standing at 243,563. Short positions also edged up, standing at 78,503 contracts after rising by 3,501 from the prior reporting period.
NATURAL GAS
- US Lower 48 dry natural gas production decreased 0.36 Bcf/d last week, based on modeled flow data analyzed by Enverus, mainly due to a 0.31 Bcf/d decrease in the East region. Canadian net imports increased 0.23 Bcf/d. Demand decreased across the Res/Com, power and industrial sectors last week, falling 0.76 Bcf/d, 0.60 Bcf/d and 0.25 Bcf/d, respectively. LNG export demand increased 1.34 Bcf/d on the week as multiple terminals recovered from operational issues, while Mexican exports gained 0.10 Bcf/d. Weekly average totals show the market dropping 0.13 Bcf/d in total supply while total demand fell up by 0.24 Bcf/d.
- The EIA storage report for the week that ended March 20 showed a draw of 29 Bcf. Total inventories now sit at 2.005 Tcf, which is 888 Bcf higher than at this time last year and 292 Bcf above the five-year average for this time of year. With the decrease in demand outpacing the decrease in supply, expect the EIA to report a weaker draw next week. The ICE Financial Weekly Index report currently predicts a draw of 15 Bcf for the week that ended March 27.
- Current weather forecasts for the six- to 14-day period from the National Oceanic and Atmospheric Administration’s Climate Prediction Center show normal to above-average temperatures in the southern third of the US and extending up the East and West Coasts, while the Midcontinent, North Midcontinent, and Midwest show below-average temperatures.
- The natural gas market is in an interesting and unpredictable time right now. On one hand, the OPEC+ cuts falling apart and crude prices taking a tumble have operators reducing capex and cutting their drilling plans for 2020, which will lead to less associated natural gas supply. On the other hand, the COVID-19 pandemic has tens of millions of Americans under stay-at-home orders, so many businesses and industrial facilities are closed. Ultimately, people staying at home will lead to less natural gas demand in the commercial and industrial sectors. As we are in shoulder season, demand is already low, as it’s too warm for residential heating but too cold for power burn demand.
- The real impact on demand from COVID-19 has yet to be seen in the US, but on the supply side, we’ve already seen a number of rigs drop off. From March 17 to March 29, the rig count in the Lower 48 fell from 802 to 719, indicating that operators’ less ambitious plans are already making headway. Continue to monitor drilling activity using Enverus’s daily rig count to understand what drilling trends look like. On the demand side, as well as the supply side, monitor natural gas flow data trends to understand what kind of demand drops are happening in the market because of COVID-19 and where supply is falling as operators slow their drilling plans. If you or your company doesn’t currently utilize natural gas flow data but think it could be beneficial, reach out to Enverus at [email protected] to get a demo of OptiFlo Gas to see how flow data can help you understand supply and demand dynamics.
NATURAL GAS LIQUIDS
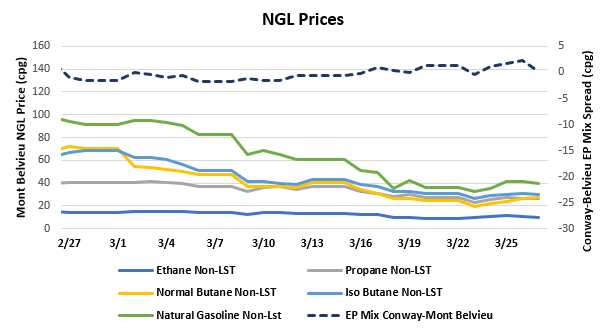
- NGL prices saw declines week-over-week amid an oversupplied market. Ethane fell $0.005/gallon to $0.103, propane declined $0.038/gallon to $0.259, normal butane fell $0.048/gallon to $0.239, isobutane fell $0.050/gallon to $0.293, and natural gasoline fell $0.051/gallon to $0.379.
- The EIA reported a draw of propane/propylene stocks for week that ended March 20, with inventories decreasing 1.81 MMbbl. Stocks now stand at 64.92 MMbbl, which is 13.28 MMbbl higher than the same week in 2019 and 15.47 MMbbl higher than the five-year average. The five-year average for next week’s report shows a build of 789,000 bbl, while last year saw a build of 1.56 MMbbl.
SHIPPING
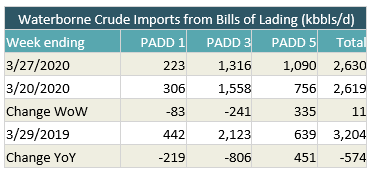
- US waterborne imports of crude oil rose slightly last week, according to Enverus’ analysis of manifests from US Customs and Border Patrol. As of today, aggregated data from customs manifests suggested that overall waterborne imports increased by 11,000 bbl/d from the prior week. PADD 5 imports rose by 335,000 bbl/d, overcoming decreases of 83,000 bbl/d in PADD 1 and 241,000 bbl/d in PADD 3.
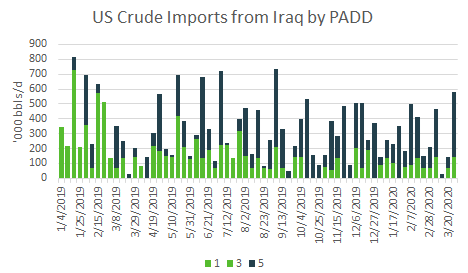
- Imports from Iraq rose this week, with 141,000 bbl/d imported to PADD 3 and 442,000 bbl/d heading to PADD 5. That represented the highest overall level of imports to Iraq since the week of Sept. 6, 2019.


