[contextly_auto_sidebar]
CRUDE
- US crude oil inventories decreased by a massive 11.5 MMbbl the week that ended Dec. 27, according to last week’s report from the US Energy Information Administration. Gasoline inventories increased 3.2 MMbbl while distillate inventories increased by 8.8 MMbbl. The large crude draw was driven by record weekly exports of 4.672 MMbbl/d, as well as high crude runs of 17.283 MMbbl/d and low imports of 6.352 MMbbl/d—down by 0.46 MMbbl/d versus the previous week.
- Crude oil prices have been bolstered by heightened geopolitical risks to supply stemming from last week’s targeted killing of Qasem Soleimani by US forces in a drone strike near Baghdad International Airport. Soleimani, a major general in Iran’s Islamic Revolutionary Guard Corps and commander of the IRGC’s elite Quds Force, was en route to a meeting with Iraqi Prime Minister Adil Abdul-Mahdi. So far, Tehran’s response to Soleimani’s killing has been fierce, with the country’s leadership vowing to avenge the general’s death and announcing that the country will no longer abide by the 2015 nuclear accord. Meanwhile, outrage over the attack taking place on Iraqi soil led that country’s parliament to pass a resolution to expel US troops. This, in turn, has prompted US President Donald Trump to threaten sanctions on Iraq. Although a supply disruption has yet to occur, oil markets are on edge over the sharp escalation of US-Iran tensions as well as the potential for further destabilization of Iraq.
- The Commodity Futures Trading Commission report released last Monday for positions as Dec. 24 showed gains in the Managed Money long position, which increased by 14,532 contracts. The report also showed the Managed Money short position increasing by 6,141 contracts. It is likely that many of the latecoming shorts exited their positions with the drone attack in Iraq, adding additional support to prices.
- Market internals last week continued the bullish bias, with the market momentarily breaking above the September high of $63.38 before retracing some of those gains to close the week at $63.05. Regardless of the holiday-shortened week, total volume was significantly higher with gains in total open interest week over week. This combination of volume and open interest gains signals potential market strength for the upcoming weeks.
- The WTI market has broken out above the September highs and seems driven to challenge last April’s high of $66.60. This week will likely bring tremendous volatility to prices, with any declines being met with buying until the uncertainties surrounding the form and degree of retaliation by Iran, and the subsequent US response, become clearer.
NATURAL GAS
- US Lower 48 dry natural gas production decreased by 0.19 Bcf/d last week, based on modeled flow data analyzed by Enverus, while Canadian imports decreased by 0.24 Bcf/d. Domestic demand was down across the board, with Res/Com demand falling 0.59 Bcf/d week over week, power demand off by 0.73 Bcf/d and industrial demand down 0.45 Bcf/d. Rounding out the demand picture, LNG exports gained 0.15 Bcf/d and Mexican exports were flat on the week. Overall, these events resulted in total supply decreasing by 0.42 Bcf/d while total demand decreased by 1.66 Bcf/d.
- The EIA storage report last week showed a draw of 58 Bcf. Total inventories are now 484 Bcf higher than at this time last year and 38 Bcf below the five-year average for this time of year.
- Current weather forecasts from the National Oceanic and Atmospheric Administration show above-normal temperatures in the coming week from Illinois south to Texas and to the east, while from Nebraska west temperatures should be below average. The eight- to 14-day forecast shows similar readings.
- As expected, the CFTC report released last Monday with positions as of Dec. 24, showed the Managed Money short position increasing by 12,226 contracts while the Managed Money long position increased by 5,212 contracts. The positions as of Dec. 31 will be released later today, and with the declines through the end of the week, it is likely that additional speculative selling occurred.
- Market internals continued to show a bearish bias as prices declined on rising open interest. Due to the holiday-shortened trade, volume declined week over week.
- Prices traded lower and tried to challenge the lows from August. Last week’s low of $2.083 is another indication that this recent decline from the early November high may not be over. Prices will have to garner additional selling to challenge those lows; however, the speculative position is already extended. Weather forecasts will have to extend the mild pattern further into the winter to facilitate the two-month downtrend to test or break below the August low of $2.029. Any rally will need to break above recent highs of $2.258-$2.297 to force a re-examination of the speculative shorts.
NATURAL GAS LIQUIDS
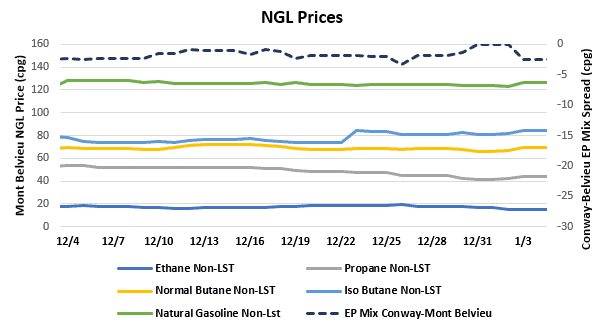
- Purity product prices were down across the board this week. Ethane dropped 11.5% to average $0.163/gallon for the week, while propane fell 8.5% to average $0.424/gallon, normal butane fell 1.8% to average $0.672/gallon, isobutane fell 0.4% to average $0.822/gallon, and natural gasoline fell 0.2% to average $1.243/gallon.
- The EIA reported a slight decrease in propane/propylene stocks for the week that ended Dec. 27, with inventories falling 212,000 bbl. Stocks now stand at 88.19 MMbbl, which is 17.53 MMbbl higher than the same week in 2018 and 20.21 MMbbl higher than the same week in 2017.
SHIPPING
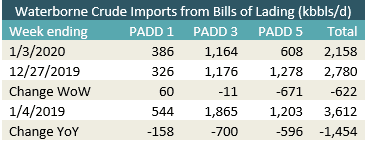
- US waterborne imports of crude oil fell last week, according to Enverus’ analysis of manifests from US Customs and Border Patrol. As of today, aggregated data from customs manifests suggest that overall waterborne imports fell by more than 620,000 bbl/d from the previous week. The decrease was driven by a 671,000 bbl/d drop in PADD 5 waterborne imports. PADD 3 imports also fell, but only by 11,000 bbl/d, while PADD 1 imports rose by 60,000 bbl/d.
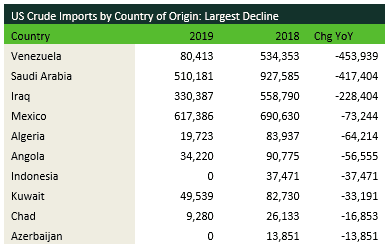
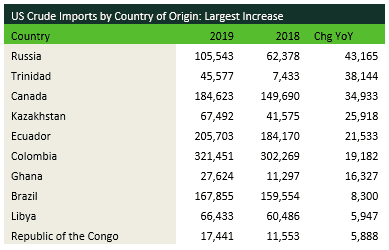
- A massive drop was seen in average US waterborne crude imports during 2019, down by more than 1.2 MMbbl/d from 2018. The biggest decline came from sanctions on Venezuela, which reduced average imports from that country from more than 500,000 bbl/d to just over 80,000 bbl/d. Imports from Saudi Arabia fell by nearly half as the kingdom redirected its crude away from the well-supplied US market. Some countries saw increases, including Russia, Trinidad and Canada. Trinidad had its largest refinery shut in during 2018, so that country needed to find new export destinations for its barrels. Canada sent significantly more Atlantic Basin crude to the US, especially its Hibernia and Hebron grades.


