[contextly_auto_sidebar]
CRUDE OIL
- US crude oil inventories increased by 0.8 MMbbl the week that ended Dec. 6, according to last week’s report from the US Energy Information Administration. Gasoline inventories increased 5.4 MMbbl while distillate inventories were up 4.1 MMbbl. Total petroleum inventories posted a significant gain of 17.2 MMbbl. US crude oil production was down 100,000 bbl/d compared to the prior week, while imports were up 890,000 bbl/d to 6.9 MMbbl/d.
- WTI prices were firm last week after the OPEC+ meeting resulting in additional production cuts into 2020 and improving prospects for a Phase 1 trade deal between China and the US. Though there was considerable hesitation early in the week about the deal, by the end of the week it was becoming clear that there would be no new tariffs effective Dec. 15; in fact, the two sides had finished the agreement in principal and would paper it in January. It should be noted that the deal represents just a first step in improving trade relations between the two countries and it has its critics, most prominently related to the enforcement of some provisions.
- The primary bearish news came from the EIA inventory report, which showed a substantial build in total petroleum inventories. This build sent the WTI contract to the low for the week at $58.11, before news of the tariff agreement vaulted prices to the highs of the week.
- The Commodity Futures Trading Commission report released Friday and dated Dec. 10 showed a decline of 32,039 contracts by the Managed Money short sector, offset by a gain of 57,789 by the Managed Money long position. It has now become evident that the speculative market is expecting the US-China trade negotiations to facilitate further gains.
- Market internals continued the bullish bias last week, with WTI breaking out of its recent range to close Friday at $60.07/bbl, its highest level since mid-September, on higher volume. The only caveat to the move is that open interest declined week over week. Long-term rallies tend to have gains in open interest, especially when a market breaks out of a range.
- The next area for the bulls to challenge is July’s high of $60.94. Breaks above that level will set up a test of the September highs between $62.59 and $63.38. Should the market develop a consolidating pattern, digesting the recent gains, it will develop a new range around $56.50-$57.50 finding initial support.
NATURAL GAS
- US Lower 48 dry natural gas production decreased 0.62 Bcf/d last week, based on modeled flow data analyzed by Enverus. Canadian imports increased 0.07 Bcf/d.
- Res/Com demand saw an increase of 0.87 Bcf/d, while power and industrial demand increased 1.01 Bcf/d and 0.37 Bcf/d, respectively. LNG exports saw an increase of 0.25 Bcf/d, while exports to Mexico inched up 0.02 Bcf/d.
- Overall, these events resulted in the market losing 0.55 Bcf/d in total supply while total demand increased by 2.54 Bcf/d.
- The EIA storage report released last week showed a withdrawal of 73 Bcf. Total inventories are now 593 Bcf higher than a year ago and 14 Bcf below the five-year average for this time of year. Current weather forecasts from the National Oceanic and Atmospheric Administration show above-average temperatures throughout the US in the coming week, with the Northeast and Atlantic Seaboard showing chances of normal temperatures. The eight- to 14-day forecast shows above-average temperatures from the Rockies to the East with normal temperatures in the upper Northeast and New England.
- The CFTC report dated Dec. 10 continued to show the Managed Money short sector expanding positions by adding 18,559 contracts, while the Managed Money long sector also gained 2,564 contracts. It seems that the speculative short trade continues to expect further declines, with the only hesitation coming from changes in weather forecasts.
- Market internals developed a bearish bias with a gap decline on Monday—down $0.18 to $2.158—and spent the remainder of the week regaining ground. This action brought higher volume and slightly higher open interest but ultimately failed to bring prices above the previous week’s close, leading to a continuation of the bearish bias.
- Without a significant change in the weather forecasts going into January, it may be hard to find the impetus for prices to force the massive short covering by the speculative trade. Rallies up to $2.40 will find sellers, while declines may retest the lows of last week ($2.158) and, from there, move down to the $2.12 area. Potential exists for a break down to the August lows of $2.029 eventually, but that is unlikely with the January prompt contract.
NATURAL GAS LIQUIDS
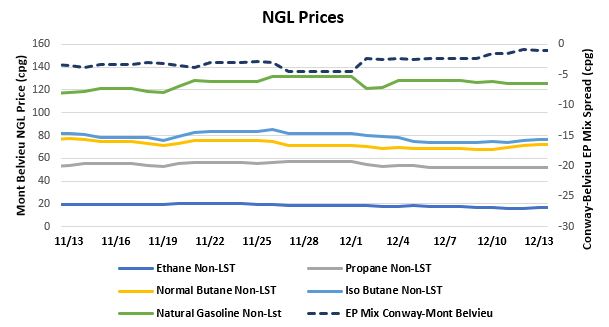
- Ethane fell $0.016 to average $0.1640/gallon last week, while propane fell $0.012 to average $0.517/gallon and isobutane fell $0.023 to average $0.750/gallon. Normal butane saw a gain of $0.007 to average $0.698/gallon, and natural gasoline increased $0.006 to average $1.2263/gallon.
- Ethane prices tumbled in tandem with the decline in natural gas prices last week, while propane prices fell mainly due to above-average inventories and weaker heating demand.
- The EIA reported a gain in propane/propylene stocks of 1.72 MMbbl last week. Inventories now stand at 93.5 MMbbl, which is 16.94 MMbbl higher than it was the same week in 2018 and 18.83 MMbbl higher than the same week in 2017.
SHIPPING
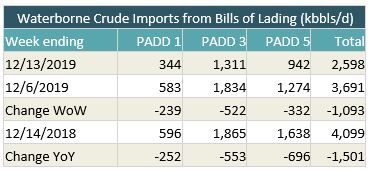
- US waterborne imports of crude oil fell last week, according to Enverus’ analysis of manifests from US Customs and Border Patrol. As of today, aggregated data from customs manifests suggested that overall waterborne imports fell by more than 1 MMbbl/d from the prior week. Last week’s EIA report confirmed our expectation for a large increase in imports, and this week we are seeing a return to levels that have become more normal. PADD 1 fell by 239,000 bbl/d, PADD 3 fell by 522,000 bbl/d, and PADD 5 fell by 332,000 bbl/d.
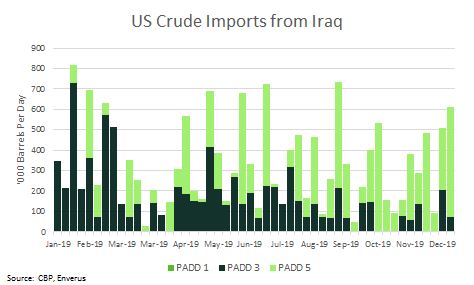
- At nearly 612,000 bbl/d, US imports from Iraq reached the highest levels since September. This is the second consecutive week of strong Iraqi imports, and the two-week rolling average is the highest since February. As has been the trend, PADD 5 on the West Coast received the bulk of the Iraqi barrels. On the other hand, imports of Saudi crude into the West Coast registered a zero for the first time since March 2017.