Part 2: Spend understanding
In this blog series, we discuss why digitalization and analytics for M&A are key to uncovering best practices and how to use data-driven decision-making to find these best practices, maximizing cost savings within a newly formed organization.
In article one, we discuss why digitalization of the back office lays the groundwork for the opportunity for economies of scale before, during and after an M&A situation.
You can read article one here.
A unified platform is critical for more collaborative, efficient processes, as discussed in article one. To realize economies of scale, you also need more structured spend management and a better understanding of your supply chain. Spend analytics are key to this formula. In this article, we dive deeper into why spend analytics are critical for an optimized supply chain and discuss specific examples of uncovering pricing best practices through spend analysis to maximize cost savings.
How do you achieve holistic spend understanding across two different organizations?
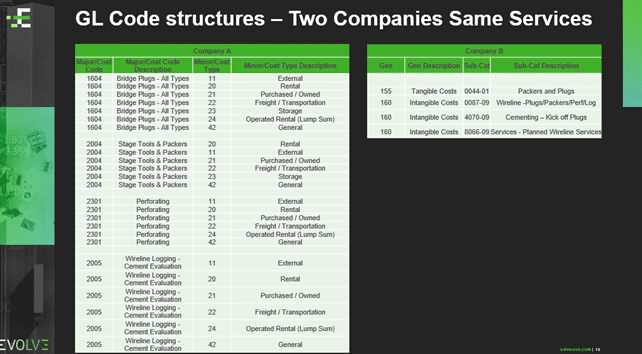
Apples-to-apples price analysis and price benchmarking has traditionally been impossible because companies report the same transactions in completely different ways.
In this example, the level of granularity captured in the GL process by Company A (left) is much more detailed than Company B (right). Company A has the type of commodity being used and provides the level of detail of how it’s being used.
Recognizing this as an industry-wide issue, Enverus normalized, categorized and attributed the $200 billion of spend data that flows through OpenInvoice to create OpenInsights.
Categorized and attributed data
- Categories — Using machine learning and algorithmic approaches and working with a team of about 150 analysts across our organization, Enverus divided goods and services into categories. These include, for example, proppant, pipes, valves, and fittings and OCTG.
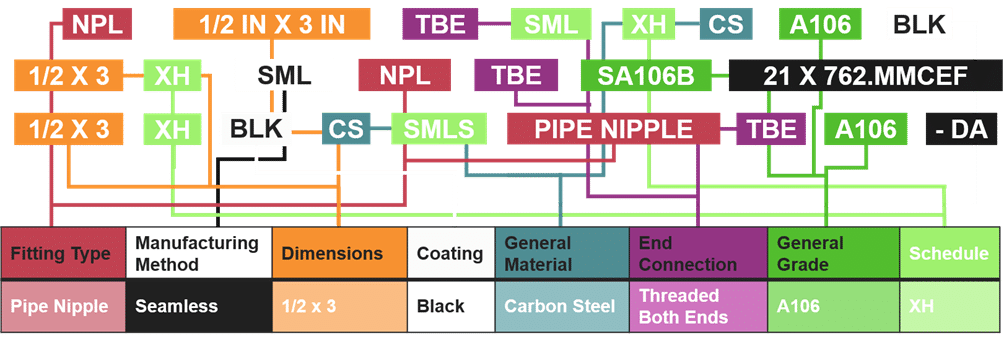
- Attributes — Products and services can’t simply be placed into single categories because there are several different characteristics within these categories. In OpenInsights, the categories are divided based on 40 million different attributes. This creates a much more usable and reliable data set. Here is an example of categorized and attributed pipe data.
Let’s take a look at some examples of how you can use spend analysis to find cost-saving opportunities for a powerful Shale 3.0 growth strategy.
Use Case 1: Vendor consolidation
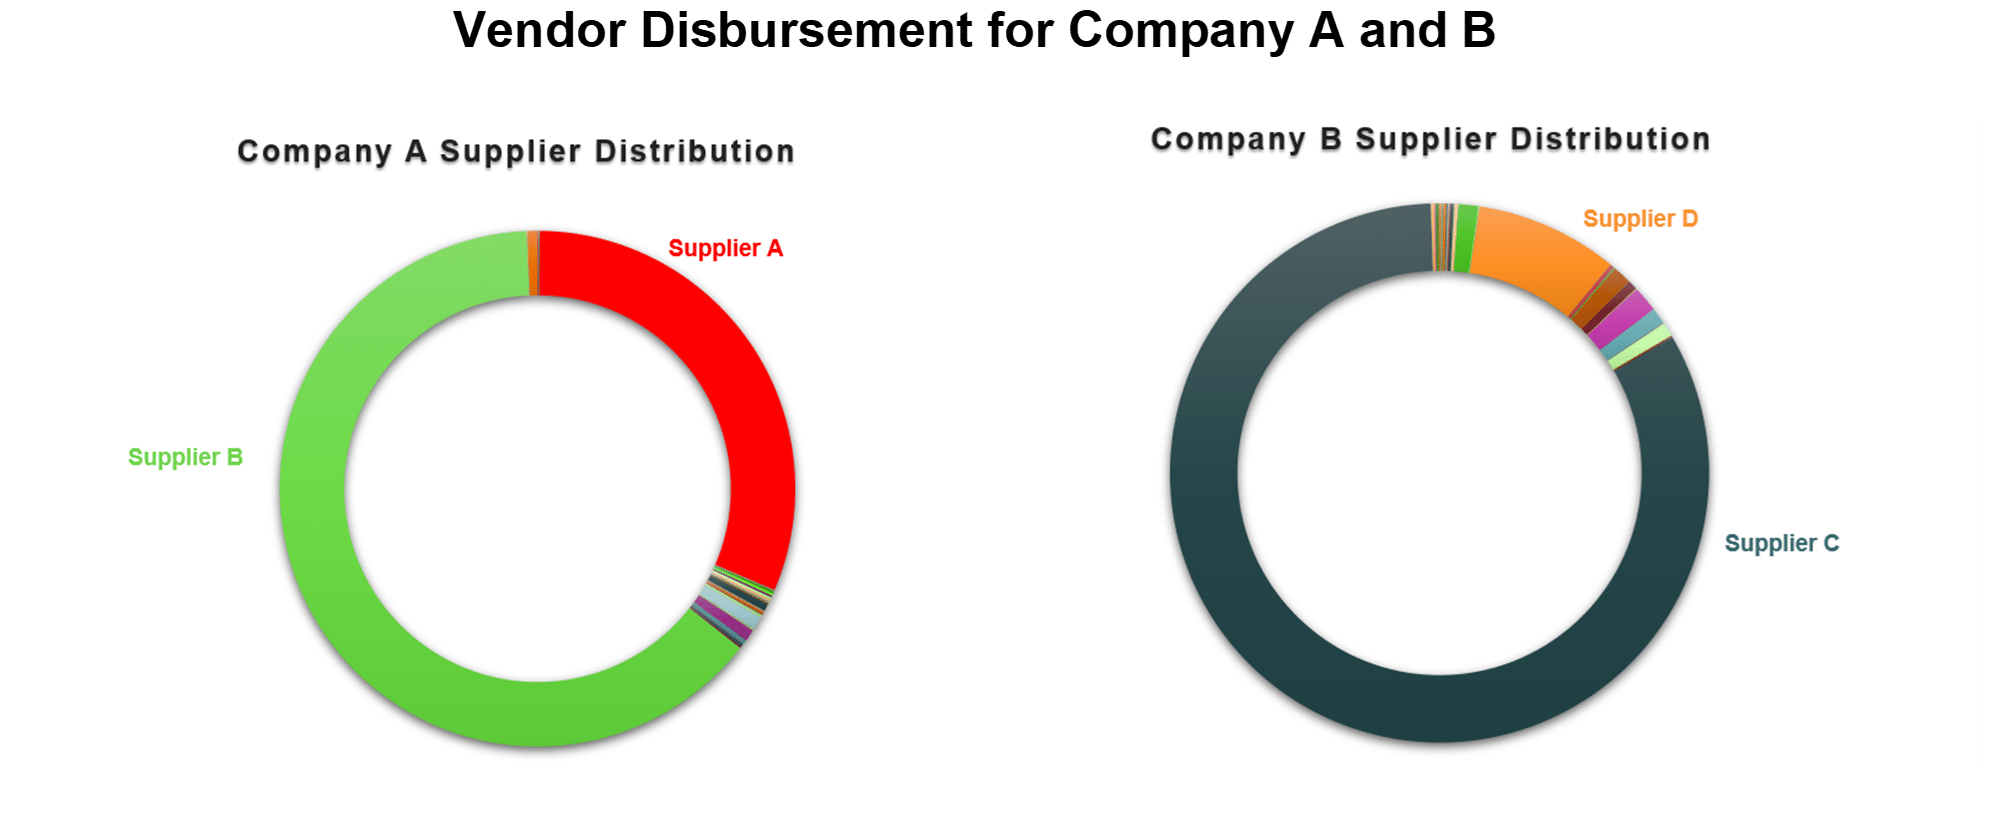
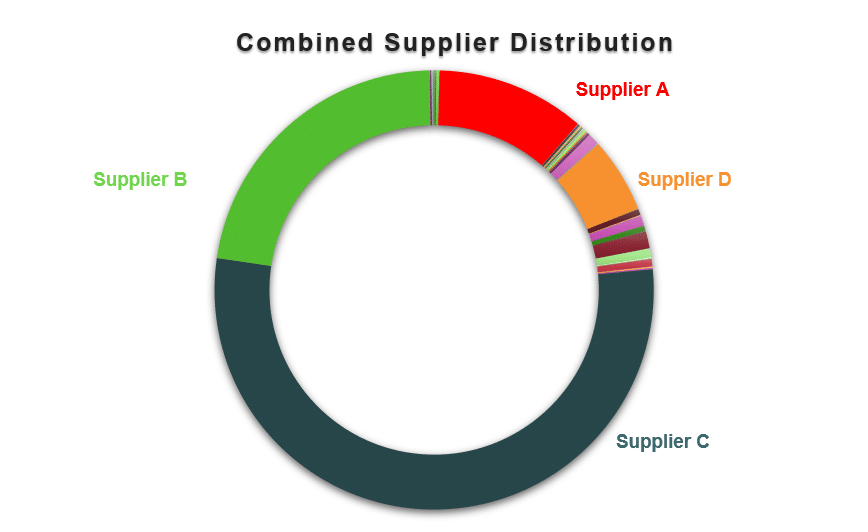
When two companies merge, the vendor network grows. Companies can use price analysis between suppliers to define preferred vendors. In the example below, the left graphic shows Company A had a fairly integrated supply chain. But Company B is even more integrated. When you bring these companies together, it results in a relatively consolidated market.
The bigger issue that operators see with this analysis was caused by market shifts over the last couple of years. As service companies went out of business or shifted markets, operators had to diversify their supplier networks. This led to more suppliers and more one-off transactions. Many transactions were project-to-project based, creating a decentralized supply chain strategy.
Use Case 2: Preparing for an integrated RFQ
Vendor consolidation isn’t just about choosing the lowest-cost provider. It’s important to understand that the cost you pay to a vendor for a product or service is a combination of the quality of the product and the services provided. Some companies are willing to pay more than the price of the product because a supplier works seamlessly with them.
In this example, we developed the distribution for intermediate casing prices across these four suppliers. There are so many different properties that define a pipe — grade, weight, range, end connection, material and coating.
To evaluate a more specific type of casing, we developed a taxonomy, a combination of attributes. Taxonomies are powerful tools for evaluating price discrepancies. Examining the price differential and the increasing volume of the merged company can lead to significant cost savings. Below is a concentration of price points for intermediate casing transactions across the same four suppliers using three variables. This allows for an apple-to-apples comparison.
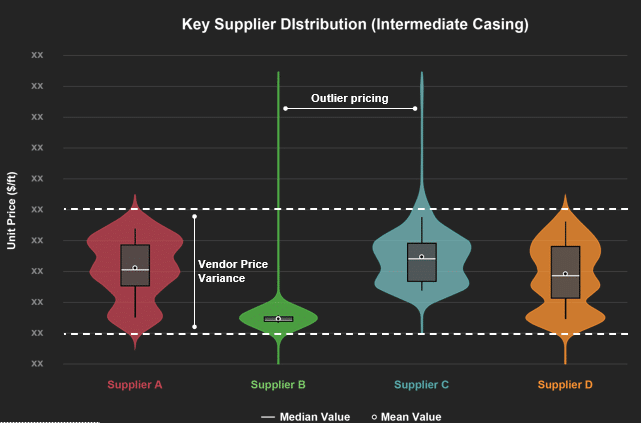
For intermediate casing, note that Supplier A and D sell at three different prices, Supplier C sells at two different prices, and Supplier B has the most consistent pricing. This demonstrates the power of a digitalized supply chain. Supplier B has full implementation of price books, resulting in consistent pricing that has really helped the company.
Use Case 3: Determine pricing practices from a regional price index
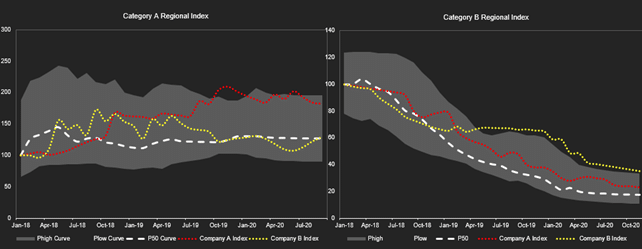
Trying to reduce costs as a blanket effort is time consuming and inefficient. Enverus also offers regional market price indices for every category — chemicals, proppant types, mesh sizes or OCTG. Leveraging market indices and benchmarking allows you to find the key areas of concern and triage efforts. In a merger, you can use these market indexes to gain an understanding of how the two companies have performed in different categories compared to the market and identify specific areas for improvement.
In the example below, the market price is consistent for Category A (left). The gray zone, which is the variability zone, is shrinking for this particular product. But while pricing — Company A is the red line and Company B is the yellow line — starts low, Company A’s pricing starts to steadily increase. You might assume that Company B has better best pricing practices and adopt this strategy across the board. But when we did the same analysis with Category B, we found that Company A is more consistent. This showed that both companies have room to save money in these different categories.
Conclusion
As this low-price environment picks up, the industry will reorient itself with M&A to consolidate operations. Identifying and realizing economies of scale is almost impossible without a much more structured, individualized supply chain process in place.
Digitalization across your supply chain ecosystem allows for leveraging spend analytics to compare your spend to the rest of the market, driving decision-making processes and identifying cost savings and strategies moving forward. Successful digitalization of processes across the spend team to serve their needs provides more successful M&A analysis and best practice evaluation.
To learn more about how Enverus Business Automation solutions can help your company fast-track your M&A growth strategy, fill out the form below to speak to an expert.
The content for this article was sourced from our Cost Savings in M&A webinar hosted by Akash Sharma, director of OpenInsights, and Dave Savelle, director of Field Ticket Operations.


