Trading and Risk

Deep Learning Brings Texas-Sized Accuracy to Power Forecast

byRob Allerman

Machine learning has powered the forecasts of PRT, the Enverus power analytics platform, for more than 25 years. PRT analysts were trailblazers, using machine learning to build more accurate power forecasts in the 1990s. We have now cracked a new code in lowering MAPE (mean absolute percentage error) with deep learning, a powerful new counterpart to machine learning.

What is deep learning? Colleagues and customers ask me this question multiple times a day. I think of it as the more advanced cousin of machine learning, with stronger computing power and more granular datasets.

In February, we upgraded our power load forecast models for ERCOT, the Electric Reliability Council of Texas. After upgrading our models and computing servers to handle the advancements we put into place, the Enverus power analytics team had the opportunity to hunker down and put our forecasts to work. The results have blown us away.

Many power market participants are happy to rely on ERCOT price and load forecasts, provided by the ISO (independent system operator) of the Texas power market. ISOs across the country offer their forecasts free of charge and are typically accurate enough for participants balancing their power supply and demand balances.

For most traders, however, “accurate enough” isn’t accurate enough. We’re proud to reveal our February MAPE for ERCOT, which provides a refreshing alternative to the ISO with less bias and less risk than we’ve ever had the privilege of offering.

Enverus ERCOT Power Load Forecasts Outperform the ISO Morning and Evening Peak MAPEs in February

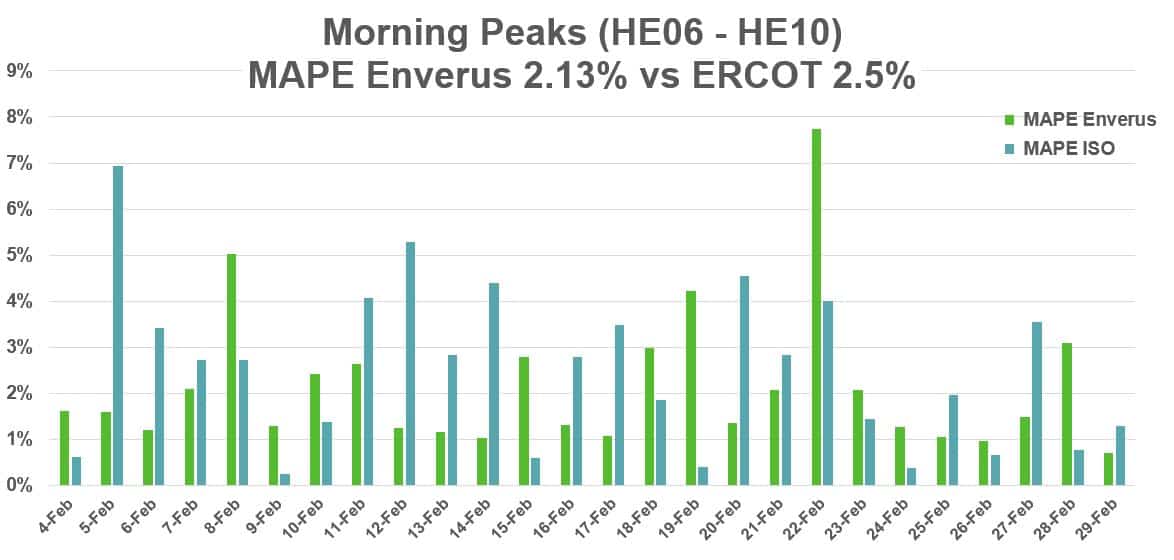
Every dollar counts for utilities and power traders trying to grow their businesses through cost savings. For the morning peak loads throughout ERCOT in February, Enverus averaged a 2.13% MAPE, versus the ISO’s 2.5%. Here’s a closer look at the two entities’ performances.
While those morning results were extremely positive for the power analytics team, the evening results were even more exciting. The ISO’s MAPEs for the evenings tended to be much more biased than those in the mornings. For the month of February, Enverus ended with a MAPE of 1.91% for evening peaks, versus the 3.39% MAPE clocked by the ISO.
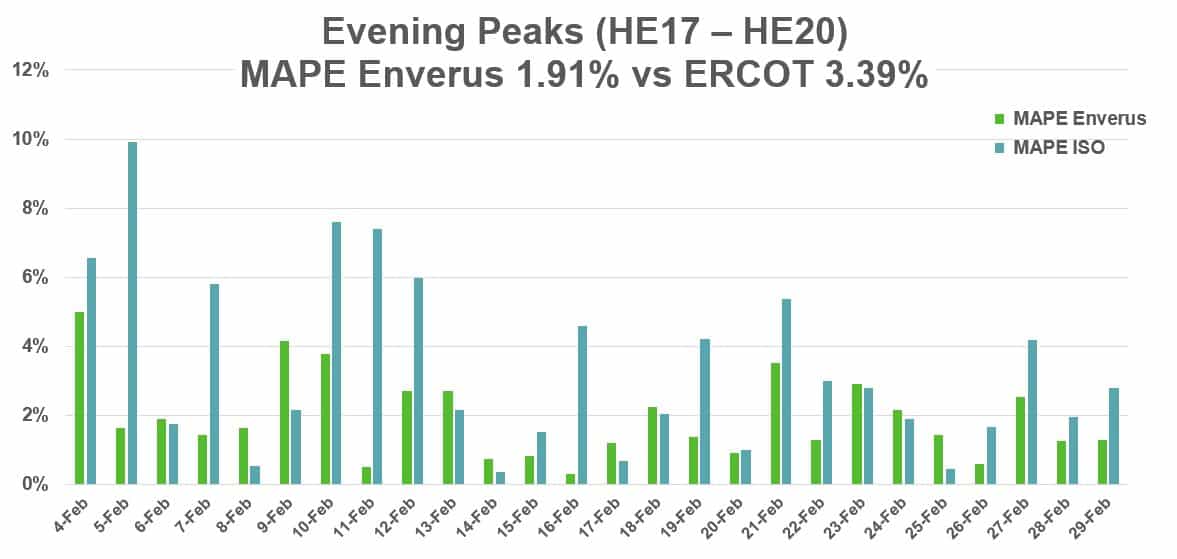
These numbers don’t just speak for themselves. We think they scream for themselves that utilities and power market participants are missing out on hundreds of millions of dollars of savings by relying on the ISO forecasts.

We want to prove to the world that our power forecasts carry less bias and less risk than ever before. We invite you to sign up for a free trial of our Enverus ISO load and power forecasts to see the difference for yourself.

Request a Free Trial

Rob Allerman

Rob Allerman

Rob Allerman is Senior Director of Power Analytics at Enverus. Before joining Enverus, Rob was Head of North America Power Analytics at EDF Power Trading in Houston, Texas, and spent many years as a power analyst at Deutsche Bank. Rob also worked in the western U.S. for nearly 10 years at Power Utilities and started his career as a Hydrologist for the Federal Government.

Subscribe to the Enverus Blog

A weekly update on the latest “no-fluff” insight and analysis of the energy industry.

Related Content

CCUS-GettyImages-1056200534
Energy Analytics Energy Transition
ByAndrew Gillick

In case you missed it, Enverus virtually hosted EVOLVE, our flagship conference, May 16-17. The event included two full days of presentations, panels and keynotes, distilling the most relevant data and thoughts on the industry today.  Below Andrew Gillick, managing director...

blog-refinancing
Energy Analytics Other
ByShane Reddell

In the current landscape of heightened environmental and social consciousness, upstream oil and gas companies face significant challenges in achieving favorable refinancing for their existing credit facilities. These challenges are compounded by the recent volatility in the debt markets and...

unprecedented-wildfire-season-singes-alberta-oil-production
Energy Analytics Intelligence Publications
ByMaurice Smith

Wildfires that have already scorched more than double the average annual fire destruction across Alberta forced the shut-in of more than 300,000 boe/d while threatening future shuttering of output from the so-far largely unaffected oil sands region. Record temperatures saw...

ccus-risky-business-post
Energy Analytics Energy Transition
ByHeather Leahey

CO2 containment risk has become one of the most popular topics among our clients evaluating CCUS projects. Operators need to understand and evaluate subsurface features that could trigger CO2 migration and containment losses as well as introduce additional safety, reputational...

ev-parent-image
Energy Analytics Energy Transition
ByRyan Luther

Anyone who thinks spending time at a public charging station is a blocker to buying an electric vehicle (EV) might want to consider the numbers behind EV and internal combustion engine (ICE) vehicle refueling times. The answer is that it...

Enverus Blog - 6 tax preparation tips for mineral and royalty managers
Energy Analytics
BySilas Martin

Recent years have been a roller coaster for mineral buyers, from record low commodity prices to highs for oil and natural gas in the last year. Going forward, challenges and opportunities will be plentiful. We expect oil prices between $80...

wind-power-energy-woman-trader-stock
Power and Renewables
ByKenneth Curtis

It’s that time of year when generator and transmission outages are at their peak in PJM. The first half of April has not disappointed volatility-wise as the WHUB/NIHUB spread has set new 30-day highs largely driven by congestion. Figure 1:...

Enverus Blog - April's energy outlook: Analyst insights you can't miss
Analyst Takes Energy Analytics
ByChris Griggs

May marks a new month, and it’s essential to assess the energy landscape of April. Our Enverus Intelligence® | Research (EIR) team has scrutinized critical trends and advancements, delivering to you insightful analyst takes that can shape your business decisions....

ofs-banner
Energy Analytics
ByCayley Krynowsky

Inventory is king in 2023. Operators and investors alike are more concerned than ever about remaining inventory – who has it, where is it, and will it be economic? To answer these questions, most turn to the tried-and-true, but also...

Let’s get started!

We’ll follow up right away to show you a quick product tour.

Let’s get started!

We’ll follow up right away to show you a quick product tour.

Sign up for our Blog

Access Product Tour

Speak to an Expert

Book a Demo