Part 1: Pinpointing CO2 emitters
Global alignment on net zero policies, Wall Street sentiment, and large tax credits from the U.S. and Canadian governments for carbon capture investment, are leading to exciting new opportunities for historically midstream service providers. Dominated by the transportation and storage of hydrocarbons, midstream operators are rethinking their business model and repurposing into the carbon capture, utilization and storage (CCUS) market.
The U.S. alone produces around 2.5 billion tons of CO2 per year, representing an attractive market for companies who can move it from source to sink, such as suitable reservoir rock where CO2 can be injected and stored. For midstream operators looking to get in on the CCUS market, it’s important to evaluate projects holistically and understand the nuances of the space, such as where to focus on gathering CO2, carbon capture cost breakeven, what makes viable saline storage and the surface ownership picture in project areas. In a rapidly evolving market, you need to be able to screen opportunities from source to sink, focus your efforts on the right deep dive analysis and accelerate time to value.
During this three-part series, we’re going to walk through three workflows within PRISM and contextualize multiple data sets to do just that in minutes. We’ll create a detailed picture of CCUS opportunities in the Houston area, but remember, these are universal workflows that can be taken to other areas in the Lower 48 and Canada.
How to identify high value emissions streams
With an annual CO2 emissions profile of 190 million tons, extensive transportation infrastructure and favorable geology, Houston has everything we need to illustrate our source-to-sink workflows.
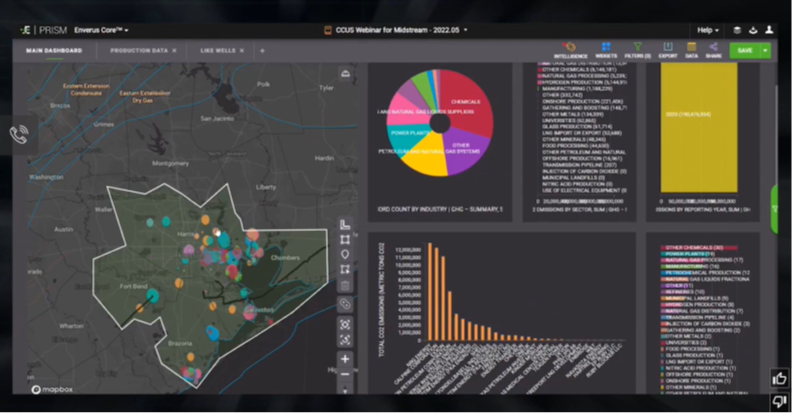
Zooming into Houston within PRISM, we see 2020 CO2 point source emissions reported to the U.S. Environmental Protection Agency (EPA), colored by sector and sized by volume. Black lines represent pipelines, while the yellow contouring shows the nearby Frio Formation. From our PRISM dashboard, we can then breakdown sources across sectors and within an industry to show top emitters, NRG, Calpine and Exxon.
Midstream companies can look at the CCUS upside from multiple perspectives, including identifying underutilized pipeline capacity that could be shifted to CO2 by using PRISM to find emissions within your service areas, or simply evaluate an entire region like Houston to see where infrastructure fits into the CCUS picture.

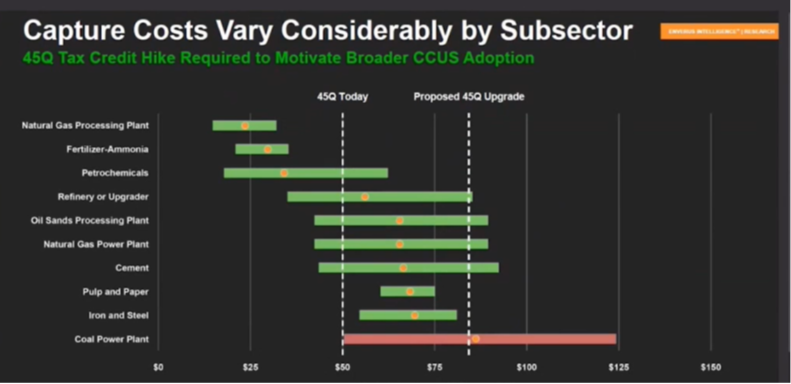
While Houston presents an attractive CCUS market, not all locations across the four counties are created equal, underscoring the need to determine the cost to capture and transport CO2. To do that, we can leverage Enverus Intelligence research data from 50 active engineering projects spanning the globe, different timeframes and sectors to build carbon capture break-even models. Capture cost breakevens are measured in dollars per ton, normalized for U.S. facilities at 1 million tons per year.
From this data set, we see that natural gas processing and ammonia production are at the lower end of the capture cost spectrum and steel and coal power generation are at the higher end, enabling us to quickly home in on the lowest cost opportunities that will improve margins. Pursuing Houston natural gas processing (a target market of 5.2 million tons per year), we can easily see the 17 facilities involved along with the parent company, ownership and volume.
What’s truly powerful with PRISM is the customizable export feature that lets you take all that data — location, company, ownership information, volumes, Enverus value-added fields, etc. — to other apps for additional analysis. And it’s more than CO2 — our ESG Analytics also provide CO2 equivalent, methane and N2O emissions data. Plus, a new PRISM data set is coming soon that will allow you to evaluate average capture break evens across North America to better evaluate CCUS opportunities using public data and disclosures.

The first step in any midstream operator’s CCUS journey is identifying source emitters and evaluating future volumes you could collect.
Stay tuned for Part 2 of this series where we’ll walk through the process for identifying viable CO2 storage sites.
If you’re ready to watch our latest CCUS Webinar, please fill out the form below.


