Source-to-sink analysis connects all aspects of evaluation allowing you to link carbon emissions to transportation potential, and optimal storage locations in the subsurface.
Figure | North American CCUS capture capacity of announced projects by sector Note | numbers are reflective of announced announced projects through the end of September 2022
Mounting pressure to decarbonize operations and improved tax incentives are building significant momentum behind carbon capture, utilization, and storage (CCUS) projects. Given the increasingly competitive and crowded landscape, operators and investors need the resources to quickly screen opportunities and better understand where to focus.
A typical project takes around 10 years from concept to commissioning, so a meaningful increase in CCUS capacity won’t be seen until the end of this decade. Looking further ahead to 2030, forecasted capacity creates a classic hockey stick as capacity accelerates upward with additional capacity heavily weighted toward petroleum and natural gas systems.
To put CCUS growth into context, U.S. and Canadian CCUS capacity was less than 2% of 2021 CO2 emissions but is conservatively estimated to expand to 12% by 2040. This number is only set to grow further as CCUS project commitments continue to stream in. This means ramping up from 40 million tons of CO2 capture capacity to at least 320 million tons per year.
Will all CCUS projects be successful?
Even though the market is still in its infancy, we know what the basic keys to success will be: access to low-cost point source emissions, supportive policy incentives and proximity to viable carbon sinks, i.e., suitable subsurface reservoirs for injecting and storing CO2.
CCUS Project Valuation Across the Entire Value Chain
Point Source Targeting & Emission Hub Evaluation
Infrastructure & Transportation
Subsurface Storage Screening & Risk Evaluation
Identify partners, decide where to build new or convert existing infrastructure and predict capacity required for long-term investments.
Identify projects to achieve ESG targets and earn competitive returns.
Understand where the best pore space for CCUS development potential exists in relation to emissions and transportation.
View everything, everywhere, all at once:
Combine all data sets into one interface to quickly identify the best opportunities and share among your team with the click of a button.
Point Source Targeting & Emission Hub Evaluation
Impact of the Inflation Reduction Act on CCUS:
Locate capturable CO2 emission sources, identify emission owners, categorize by volumes, industry and sector and determine capture costs.
Figure | capture cost curve for CCUS hubs in the US Note | numbers are reflective of announced projects through the end of 2021
The IRA, signed in August 2022, extended and expanded 45Q tax credits for CCUS projects, increasing the credit to $85/tonne for permanent storage and $60/tonne for enhanced oil recovery, a notable increase from the previous levels of $50/tonne and $35/tonne, respectively.
This upgraded incentive unlocks significant opportunities for the capture of emissions from various industries such as power plants, natural gas processing and ammonia production, ranging from economically viable to achieving substantial returns on investment. By utilizing a spatial hub modeling algorithm and our proprietary carbon capture economic model, we estimate that there are approximately 600 mtpa of U.S. hub emissions with a capture breakeven below $65/tonne, affording $20/tonne for transportation and storage costs. Dropping our transportation and storage cost assumption to $15/tonne, we arrive at 850 mtpa or roughly one-third of all point source emissions.
Identify Emission Sources and Quantify Capture Costs
The first step in assessing viability across the CCUS value chain is to locate emission sources. Although partnerships are likely to play an important role in shrinking CCUS costs, participants’ focus is on creating centralized hubs near emission centers.
Figure | identifying point source emissions across the US and categorizing by sector
It is important to not only identify where the CO2 is being emitted, but also who is emitting the CO2 , which sectors are producing, and which operators could be viable partners. With comprehensive, clean and granular public emissions and ESG data, you can locate these sources, benchmark emissions, and analyze capture costs to find the best opportunities to invest in.
The main factors in determining the capture costs are:
The location of the projects: different regions have different input costs for materials, labor and natural gas and electricity prices thus affecting capex and operating expenses of projects.
The purity, volume and concentration of the CO2: these qualities can vary in the gas stream being captured, which is why we tend to see natural gas, petrochemical and ammonia facilities to be among the lowest for capture breakevens.
The size of the capture project: we see larger scale capture projects with lower breakevens due to the advantages of the economies of scale.
To get ahead in this rapidly growing market, it’s possible to identify where these potential storage clusters are likely to appear by leveraging the project breakeven data, locating transportation and storage partners, and applying a spatial clustering algorithm in PRISM to home in on the most profitable projects that fit your strategy.
Infrastructure & Transportation
Quickly visualize and identify existing CO2 pipelines and their proximity to emission sources and sinks. Determine which operators are best positioned, and which emission centers are underserved.
Upstream & Midstream Partnerships Along the CCUS Value Chain
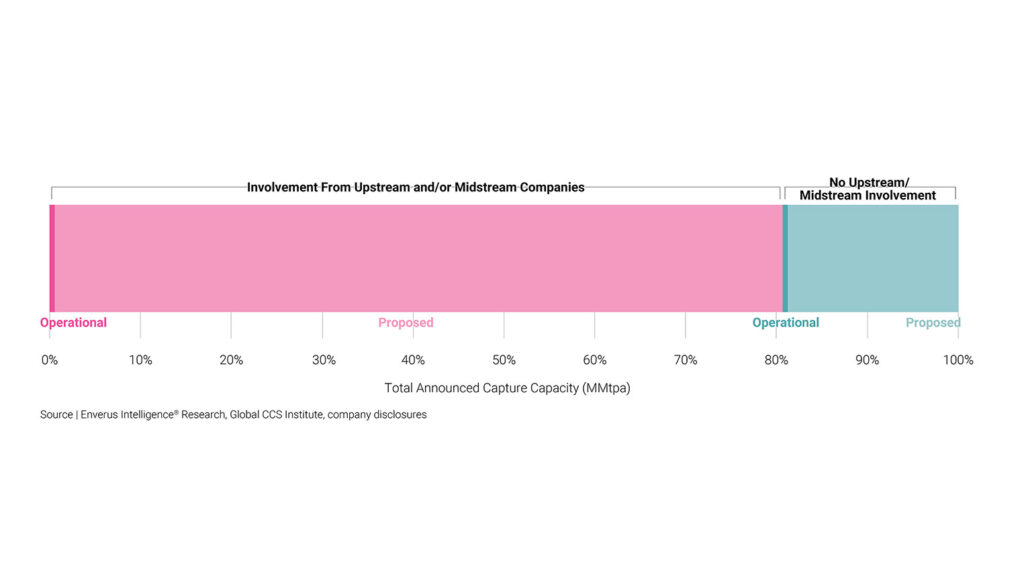
While a few pure play CCUS players have emerged, 80% of CCUS projects are led by upstream and midstream companies, including supermajors and large operators who can afford to be first movers and absorb more of the policy and technical risks. Smaller CCUS project developers targeting less than 5 million tons of additional CO2 capacity annually are led by oil and gas operators who are partnering with natural gas processors, LNG and power generators.
Large-scale CCUS projects are underway and set to come online by mid-decade, driven by permanent sequestration and hub-style projects that enable developers to capture economy of scale.
Figure | operational and proposed capture capacity by sector and facility size Source | Enverus, Global CCS Institute, company disclosures
Figure | capture capacity by oil and gas company involvement Source | Enverus Intelligence Energy Transition Research Note | numbers are reflective of announced projects through the end of 2021
Identify Infrastructure & Transportation Partners
Figure | identifying emission centers, primary pipelines and applying a geospatial filter around the CO2 pipeline
A critical success driver for economical CCUS projects includes having a short distance between emissions and injection sites.
Identify where to build new or convert existing infrastructure and predict capacity required for long term investments. Leverage geospatial filtering around existing pipelines in PRISM to identify emission sources within a viable distance for your project to be successful.
It is also important to identify what opportunities there are for using existing CO2 pipe, or repurposing natural gas pipes, which lines might be able to be twinned, or if the project will require a new infrastructure system altogether.
Subsurface Storage Screening & Risk Evaluation
Evaluate potential locations for CO2 storage volume, injection, economics and subsurface risk, and benchmark sites against one another.
Identify the best pore space for CO2 storage opportunities
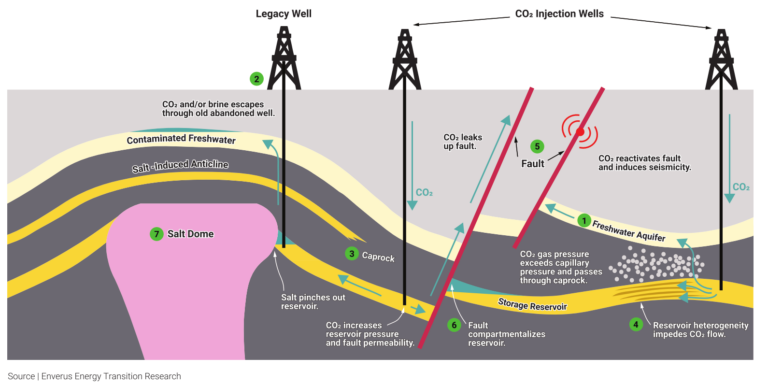
Figure | diagram of potential subsurface risk factors to mitigate Source | Enverus Energy Transition Research
Assessing the subsurface for storage viability is the most difficult and time consuming step in the CCUS value chain.
We need to know where thick, porous and permeable rock is to not only store high volumes of CO2, injected at high rates, but also to ensure we have manageable storage economics for the project to succeed.
Subsurface risk assessment is another important step to evaluating a successful CCUS project.
We need to understand where CO2 will migrate, the number and probability of legacy wellbores requiring corrective action, and the potential for containment loss to reduce safety, financial and reputational risks.
High risk areas require added planning and costs to ensure those features are managed appropriately.
Identify the Best Potential CCUS Storage Opportunities
Figure | analyzing different storage capacity metrics alongside emission centres and transportation hubs, narrowing down to an optimal area to assess surface parcels
1. Create your own maps or leverage ours
Export cleaned, merged and aliased wireline logs to start your geological analysis immediately.
Import maps back into Prism to integrate with other data sets.
Use our maps to instantly identify storage capacity, injectivity, costs or to cross check your own analysis.
2. Identify areas of interest
Tie in with emissions volumes and economics, pipelines and existing capture, transportation or storage projects.
3. Assess risk of nearby wells to reservoir integrity
Identify multiple well parameters that may increase risk to CO2 storage including depth, status, cement, plugging and casing information.
Identify the Best Potential Land Opportunities for Subsurface Storage
Figure | focusing in a storage location to an optimal location based on surface parcels
1. Assess surface land potential and ownership
Determine what surface parcels are available, who owns the land, and how contiguous the acreage is
2. Assess surface risks such as presence of floodplains
Consider any risks to the surface that could have potential to increase costs or complicate the approval process of the CCUS project
3. Integrate additional surface information
Incorporate any other surface considerations such as zoned urban areas, national parks, census data, etc.
4. View everything, everywhere, all at once.
Combine all data sets into one interface to quickly identify the best opportunities and share among your team with the click of a button.
Stay informed on CCUS
Sign up for our weekly email ‘Energy Transition Today’
Subsurface Studio helps your geoscience team to be more productive in less time. It accelerates the creation of robust subsurface models, allowing you to perform sophisticated subsurface analysis in minutes instead of weeks. Read More About Subsurface Studio
PRISM is the new operating system powering decisions at the speed of thought across the full energy value chain, upstream to downstream, power and renewables.