Decode ISOs, utilities and market policy impacting new projects
Research written by:
Enverus Intelligence Team
Investment advisory products and services provided by Enverus Intelligence® Research, Inc. Visit www.Enverus.com/disclosures for additional information.
Reviewed by:
Ryan Luther, Research Director, Enverus Intelligence® Research

The queue outlook reflects numerous factors, and ISO activity will continue to be a focus for developers, IPPs and investors driving the future of energy.
As of January 1, 2025
Generous tax credits from the Inflation Reduction Act (IRA) and the EPA’s update to 40 CFR Part 60, which mandates additional coal retirements, have significantly boosted demand for renewable energy projects across the United States. The surge in investment and development has overwhelmed interconnection queues, with a record number of projects seeking grid connections. This has exceeded grid operators’ processing capacity, causing significant delays and project suspensions. Use this Enverus PRISM® dashboard to compare interconnection queue durations across different markets and technologies.
As of January 1, 2025
Understanding project suspensions and success rates is critical, as these factors vary by ISO, technology type and project stage. Low success rates have prompted policy interventions like FERC Order 2023 to streamline interconnection queues, but delays and suspensions persist due to regulatory hurdles, permitting delays and supply chain disruptions.
A recent Enverus Intelligence Research (EIR) report found that NYISO, SPP, PJM and ISO-NE have higher suspension rates later in the project lifecycle, with Interconnection Agreement suspension rates ranging from 46% to 79%, compared to around 20% in ERCOT, CAISO and MISO. Projects in these markets show minimal improvement in completion probability until reaching construction. Understanding these regional differences helps developers maximize investment potential by minimizing project delays and increasing the odds of making it through the queue.
As of January 1, 2025
As of January 1, 2025
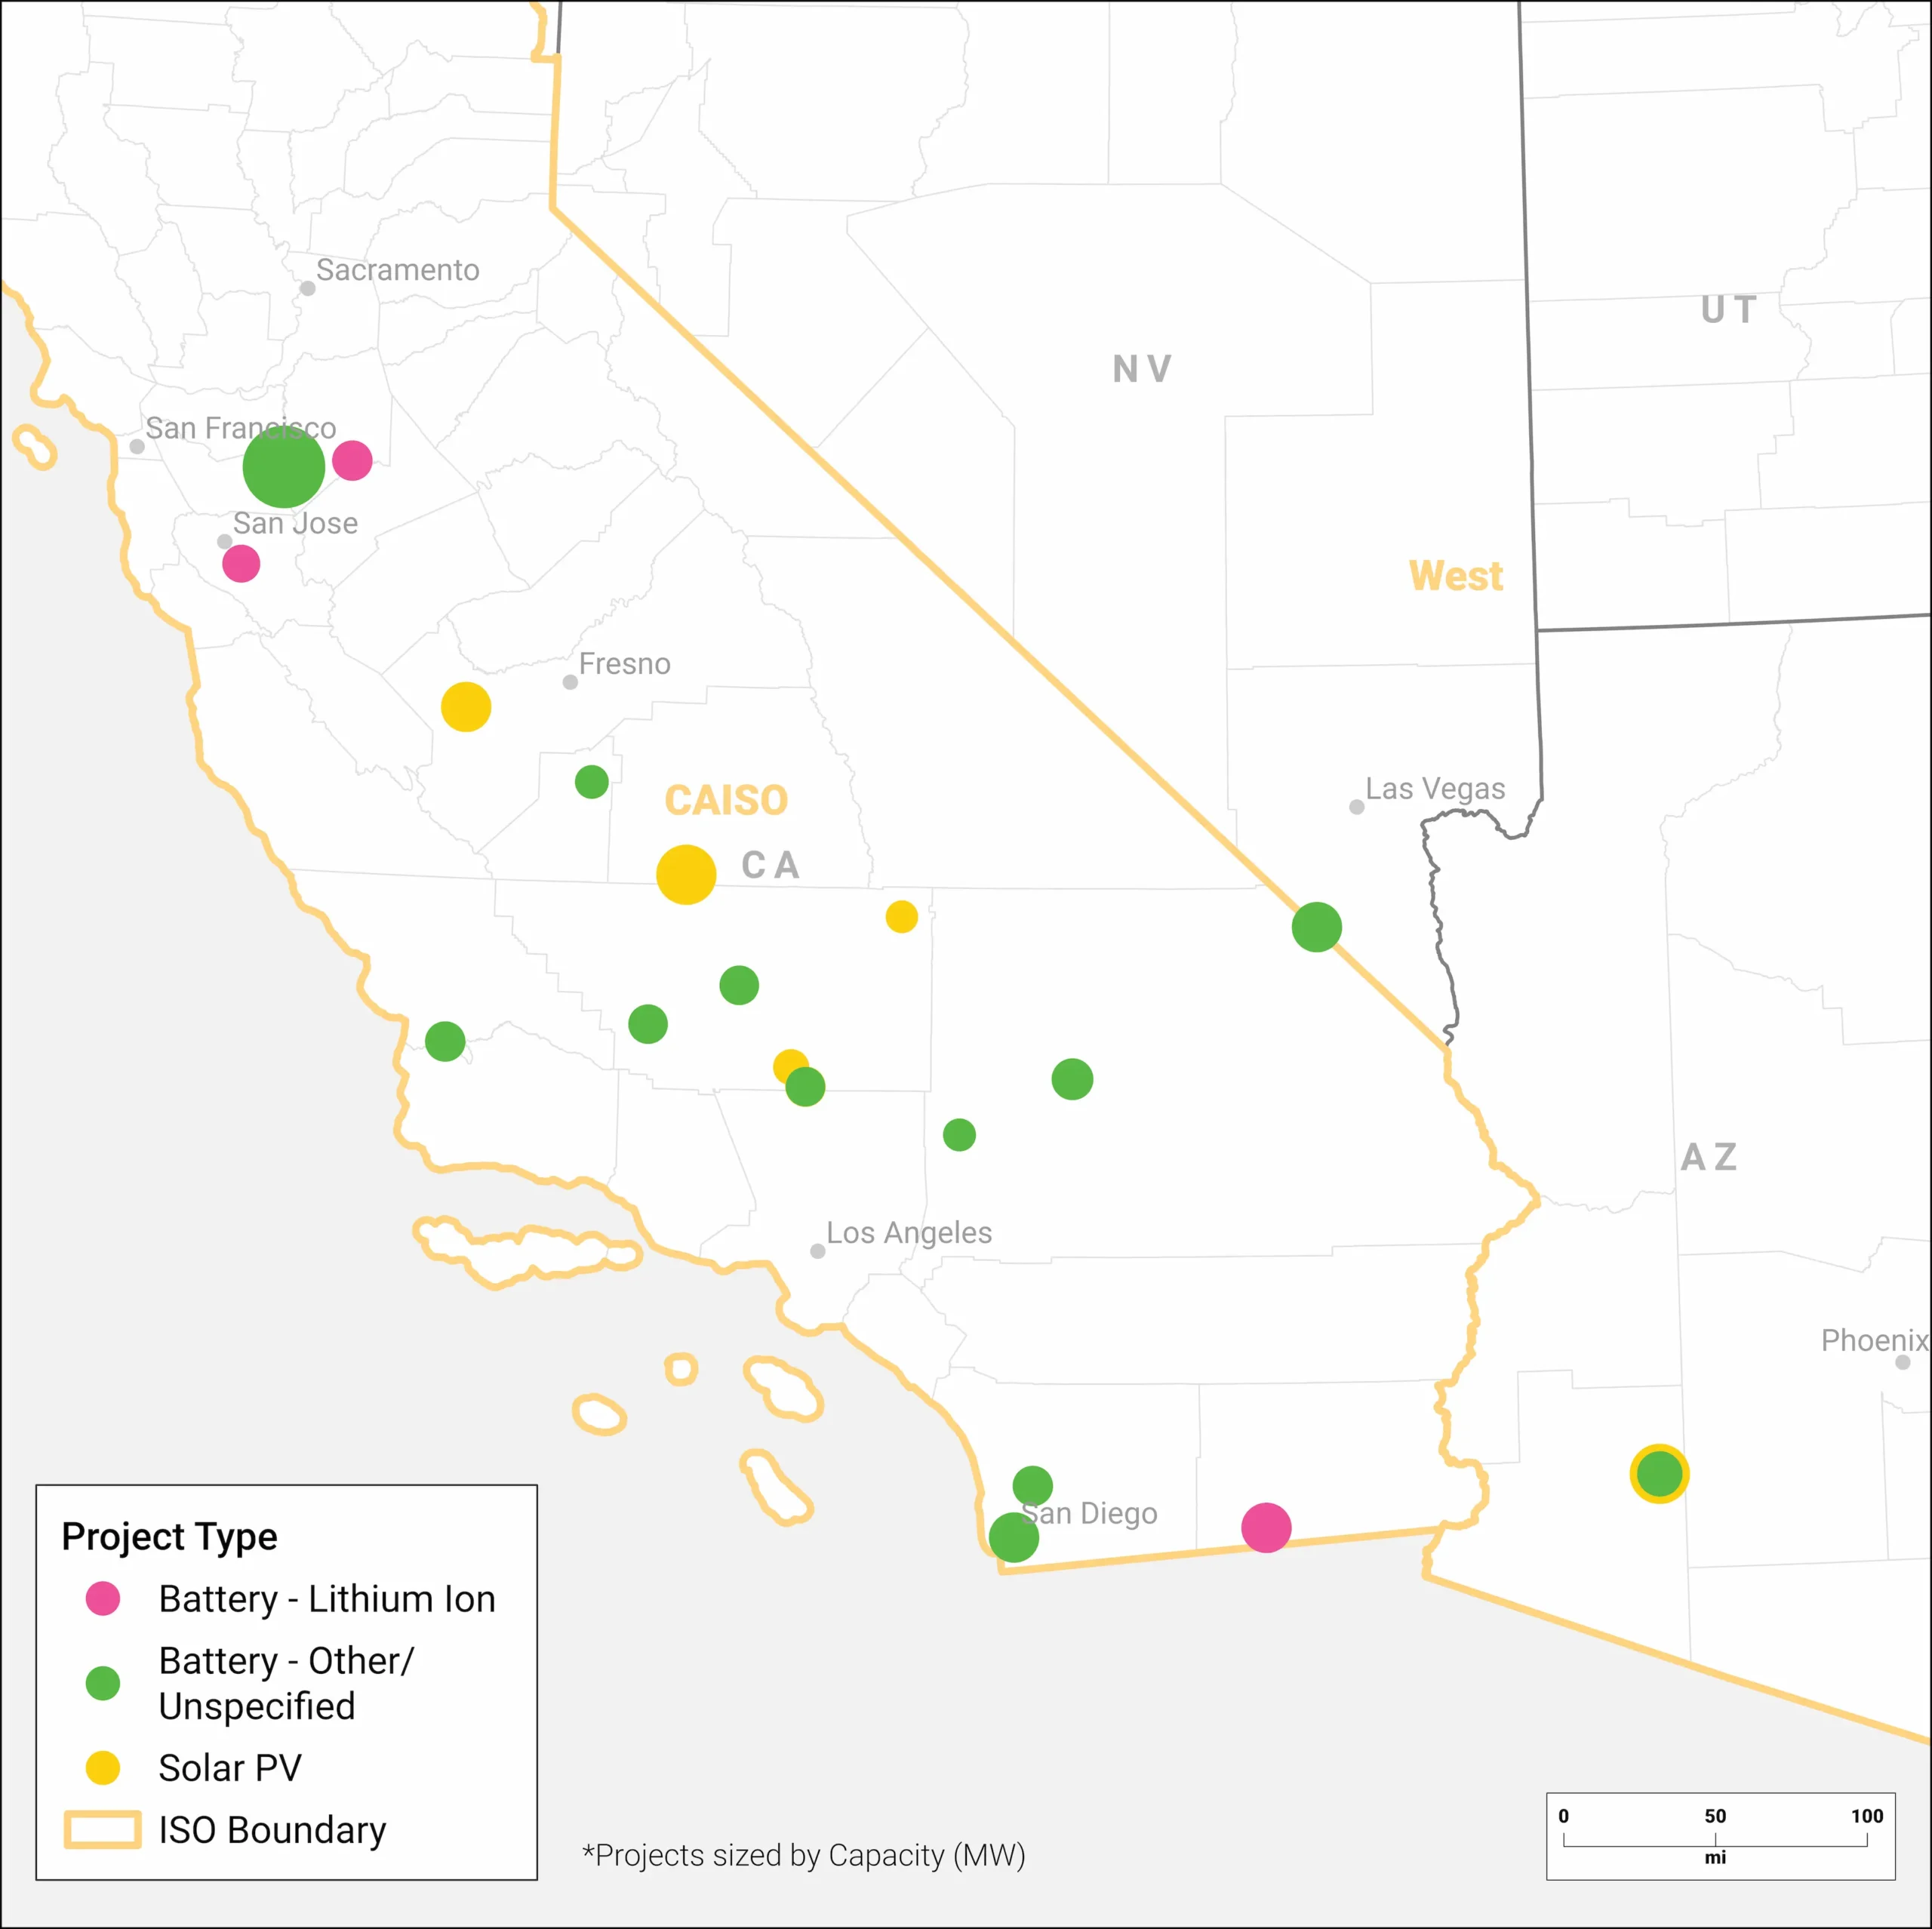
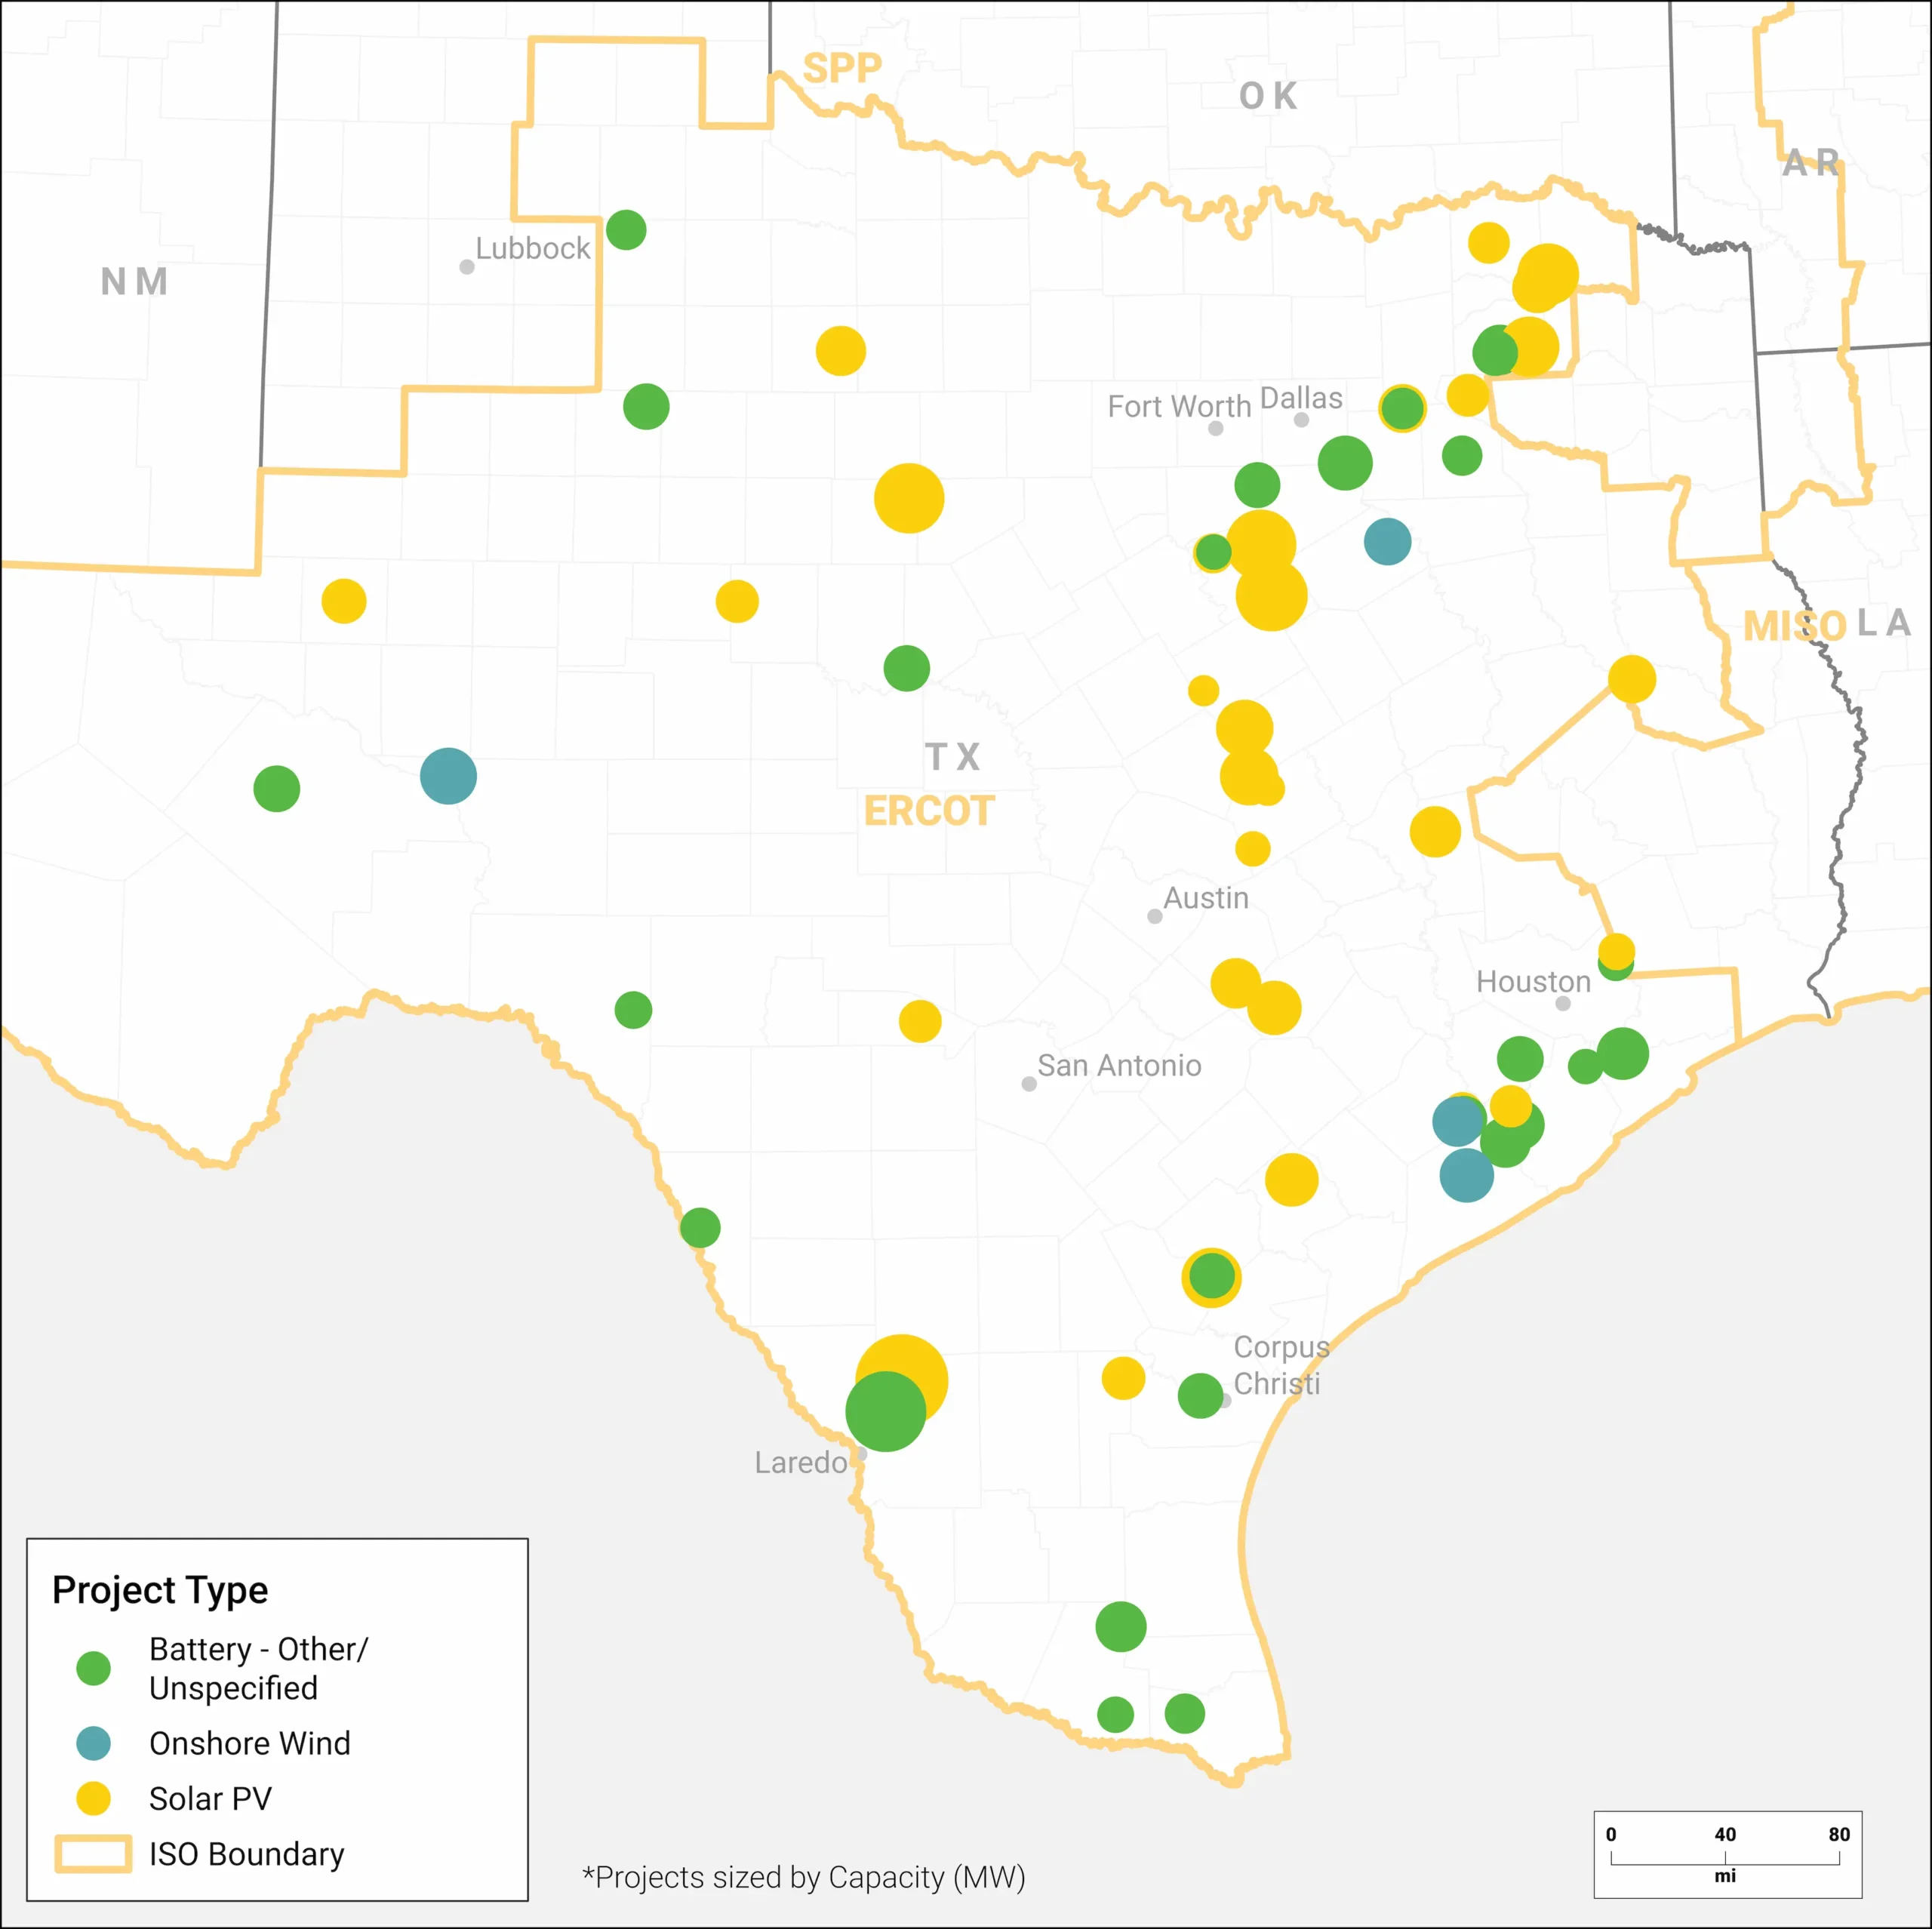
With low project success rates, power developers need better data to navigate risks and opportunities in this evolving landscape. Our PRISM platform provides a comprehensive view of key variables, including asset economics, power demand growth, existing and planned transmission lines, and substation-level available transfer capability (ATC) to name a few. Use this interactive activity map to explore some of the layers Enverus clients are using to unlock critical insights.
As of January 1, 2025
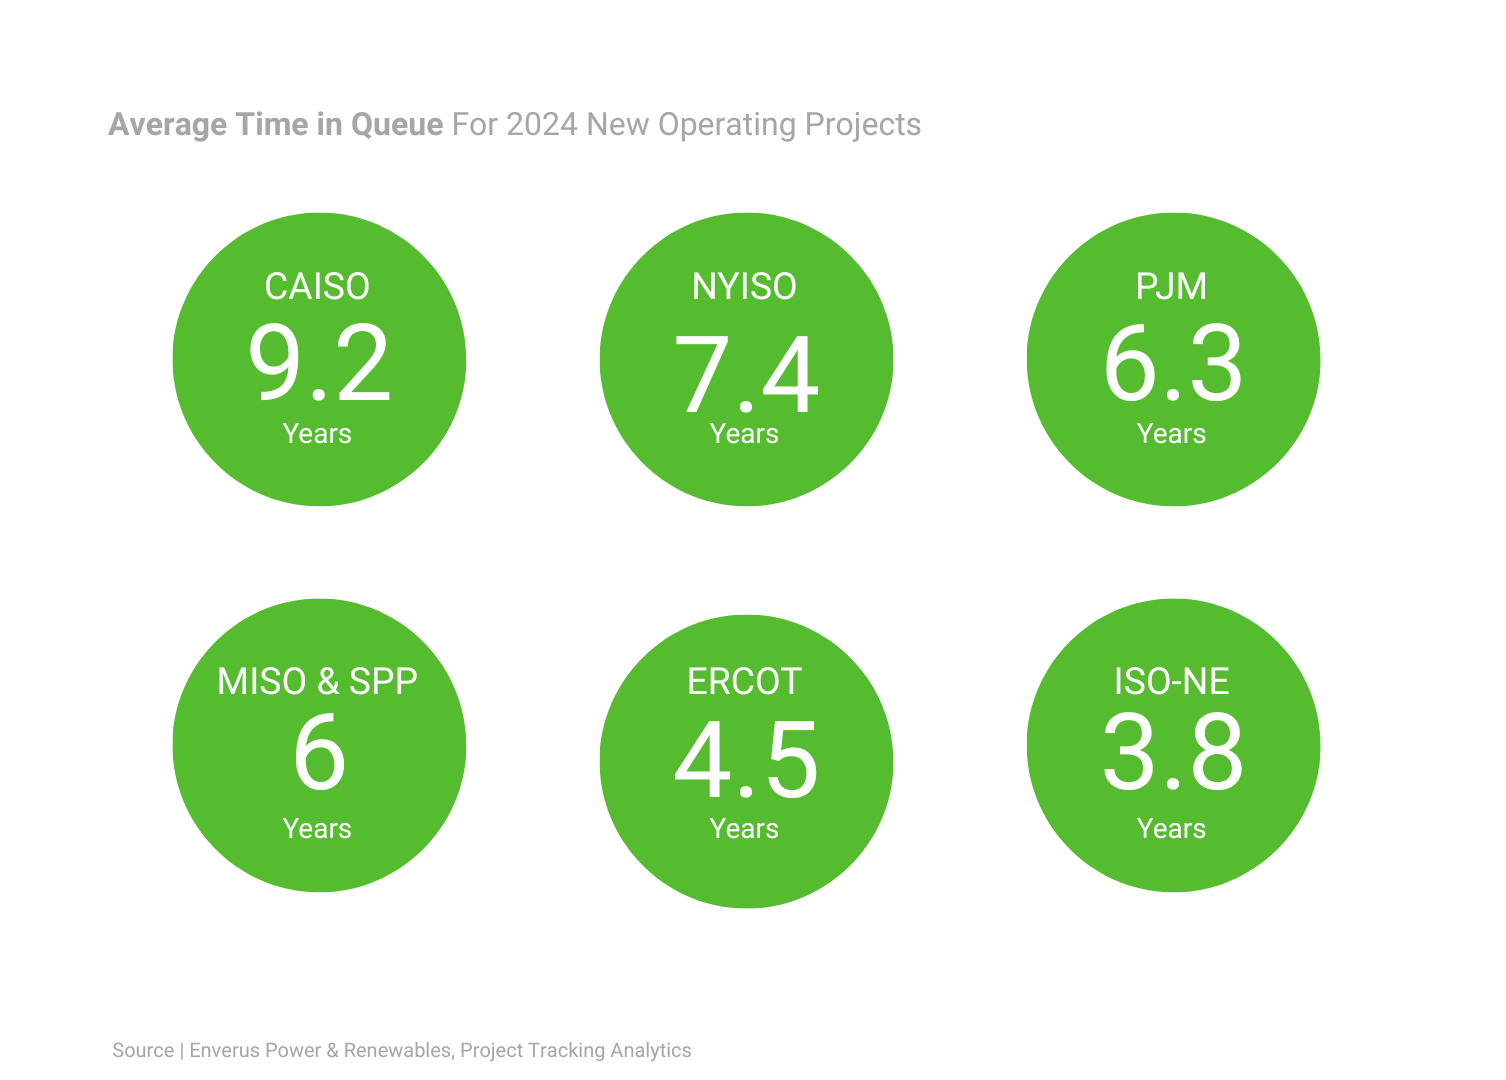
Enverus Intelligence® Research analyzed projects that became operational in 2022-2024. Compounding delays across several stages were the main driver of CAISO’s higher-than-average project development timelines, which averaged close to 9.2 years for all project types. ISO-NE had the shortest development timeline, averaging nearly 3.8 years to reach operation, followed closely by ERCOT at about 4.5 years.
NYISO, SPP, PJM and ISO-NE have more suspensions later in the project lifecycle, with interconnection agreement suspension rates ranging from 46% to 79%, compared to around 20% in ERCOT, CAISO and MISO. Consequently, projects in these markets show minimal improvement in completion probability until reaching construction.
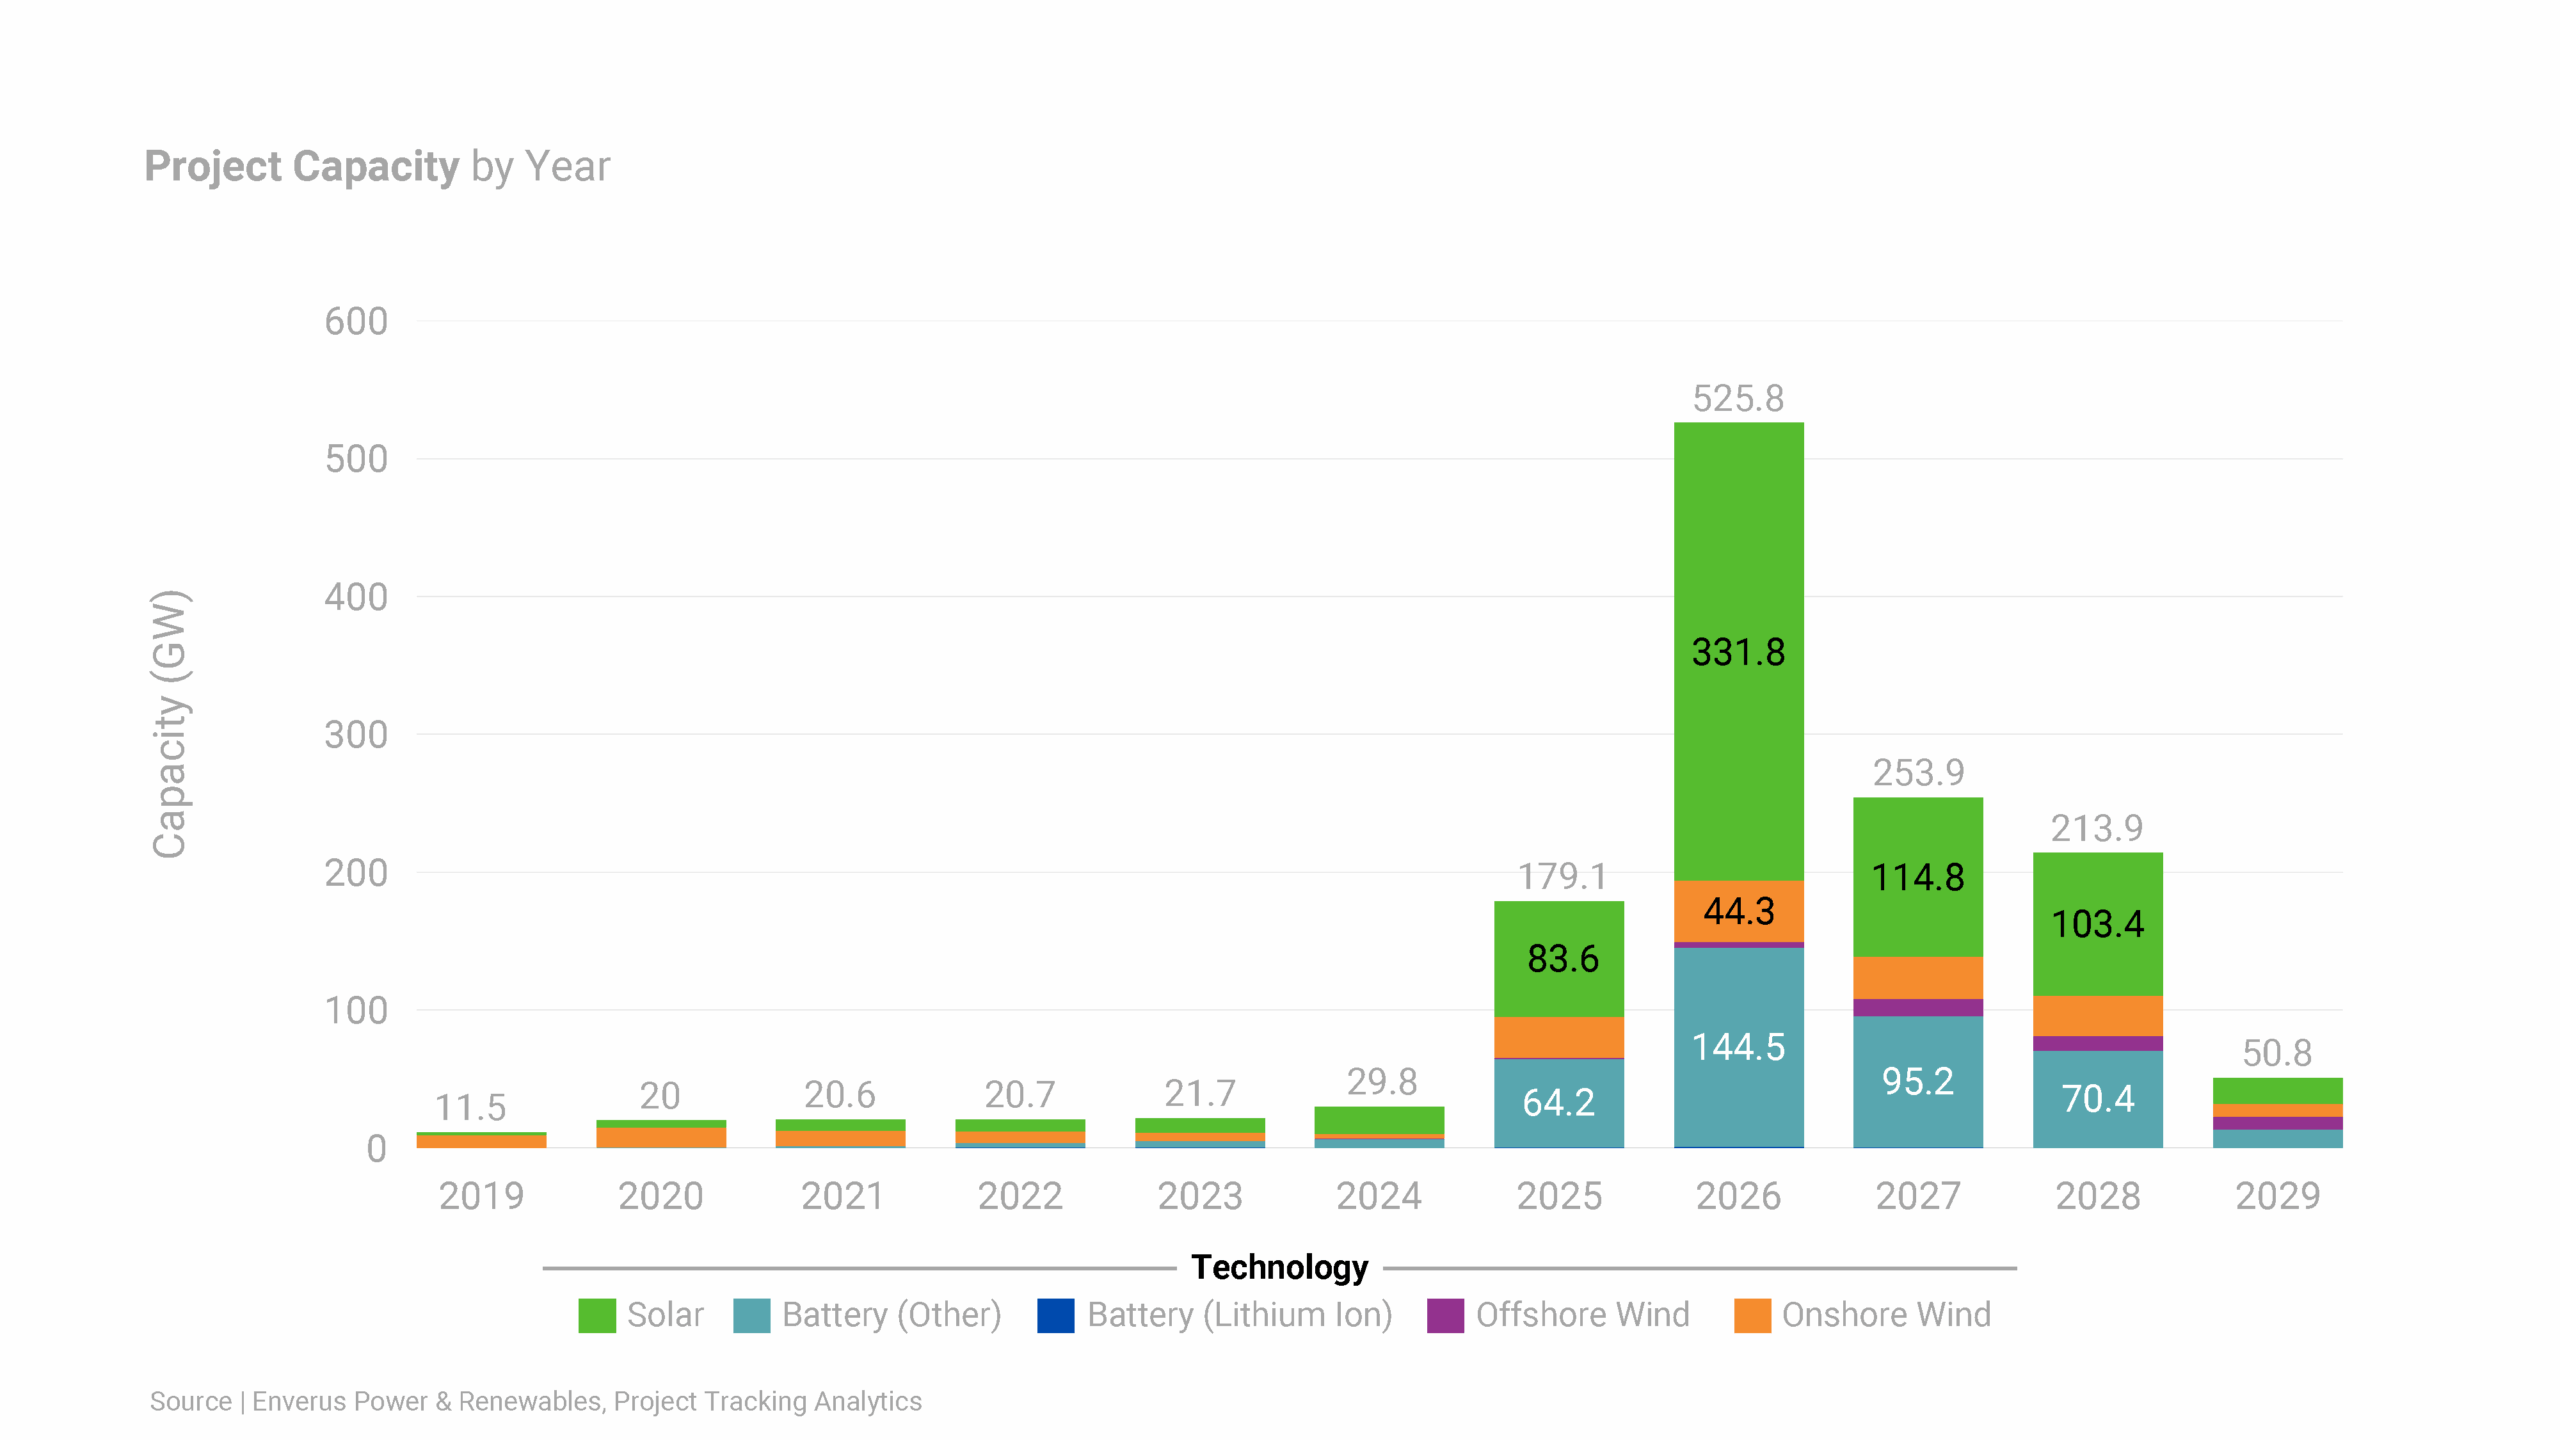
EIR expects only a fraction of capacity in the interconnection queues to reach operation. Based on our gradient-boosting machine learning model, we predict that only ~10% of projects will successfully come online in the next three years.
This report utilizes PRISM, our advanced analytics platform, to deliver in-depth insights into interconnection queues across various ISOs and utilities. As the leading energy-focused software company globally with more than 25 years of expertise, Enverus is trusted by more than 6,000 businesses to enhance decision-making capabilities, improve operational efficiency and secure competitive advantages in the dynamic power and renewables market.
Below, you will find a detailed list of the charts and graphs included in this e-book. Each entry includes a definition and an explanation of how the data was extracted using PRISM:
90% of projects are suspended or withdrawn from the interconnection queue, so developers require robust data to effectively assess risks and seize opportunities.
After delving into the intricacies of the 2025 interconnection queue, enhance your project siting strategies by accessing our e-book on project siting.
This guide provides detailed methodologies and tools for identifying optimal parcels for renewable development quickly and efficiently, improving your project’s likelihood of progressing through the queue.
Enverus offers detailed insights into the entire energy asset lifecycle and helps customers achieve 9x higher interconnection queue approval rates.
To continue building on the knowledge from the Interconnection Queue Outlook and to further elevate your project’s success, check out our Project Siting Playbook.
Enverus Intelligence® | Research, Inc. (EIR) is a subsidiary of Enverus that publishes energy-sector research focused on the oil, natural gas and power and renewable industries. EIR publishes reports including asset and company valuations, resource assessments, technical evaluations and macro-economic forecasts and helps make intelligent connections for energy industry participants, service companies and capital providers worldwide.
Enverus is the leading energy-focused software company globally, serving more than 6,000 businesses, including more than 1,000 players in the electric power markets. Each day, more than 7,500 users rely on our platform to drive decision-making in project development, grid management, power trading and asset management. Our advanced data integration sets us apart, transforming complex and scattered datasets into the most detailed, analytics-ready information on power markets.
With a legacy spanning more than 25 years and backed by strategic acquisitions totaling more than $200 million in the power sector, Enverus delivers unmatched insights through a state-of-the-art software platform. Our commitment to innovation is underscored by a $3 billion investment, ensuring we offer the most modern and effective solutions tailored for the energy industry’s dynamics.
ISO Overview
| Type | 2024 Planned Capacity | 2024 New Capacity | 2025 Planned Capacity |
|---|---|---|---|
| Solar | 4.1 GW | 0.37 GW | 1 GW |
| Wind | 1.2 GW | 0.17 GW | 0.13 GW |
| Storage | 1.9 GW | 0.0 GW | 0.45 GW |
As of January 1, 2025
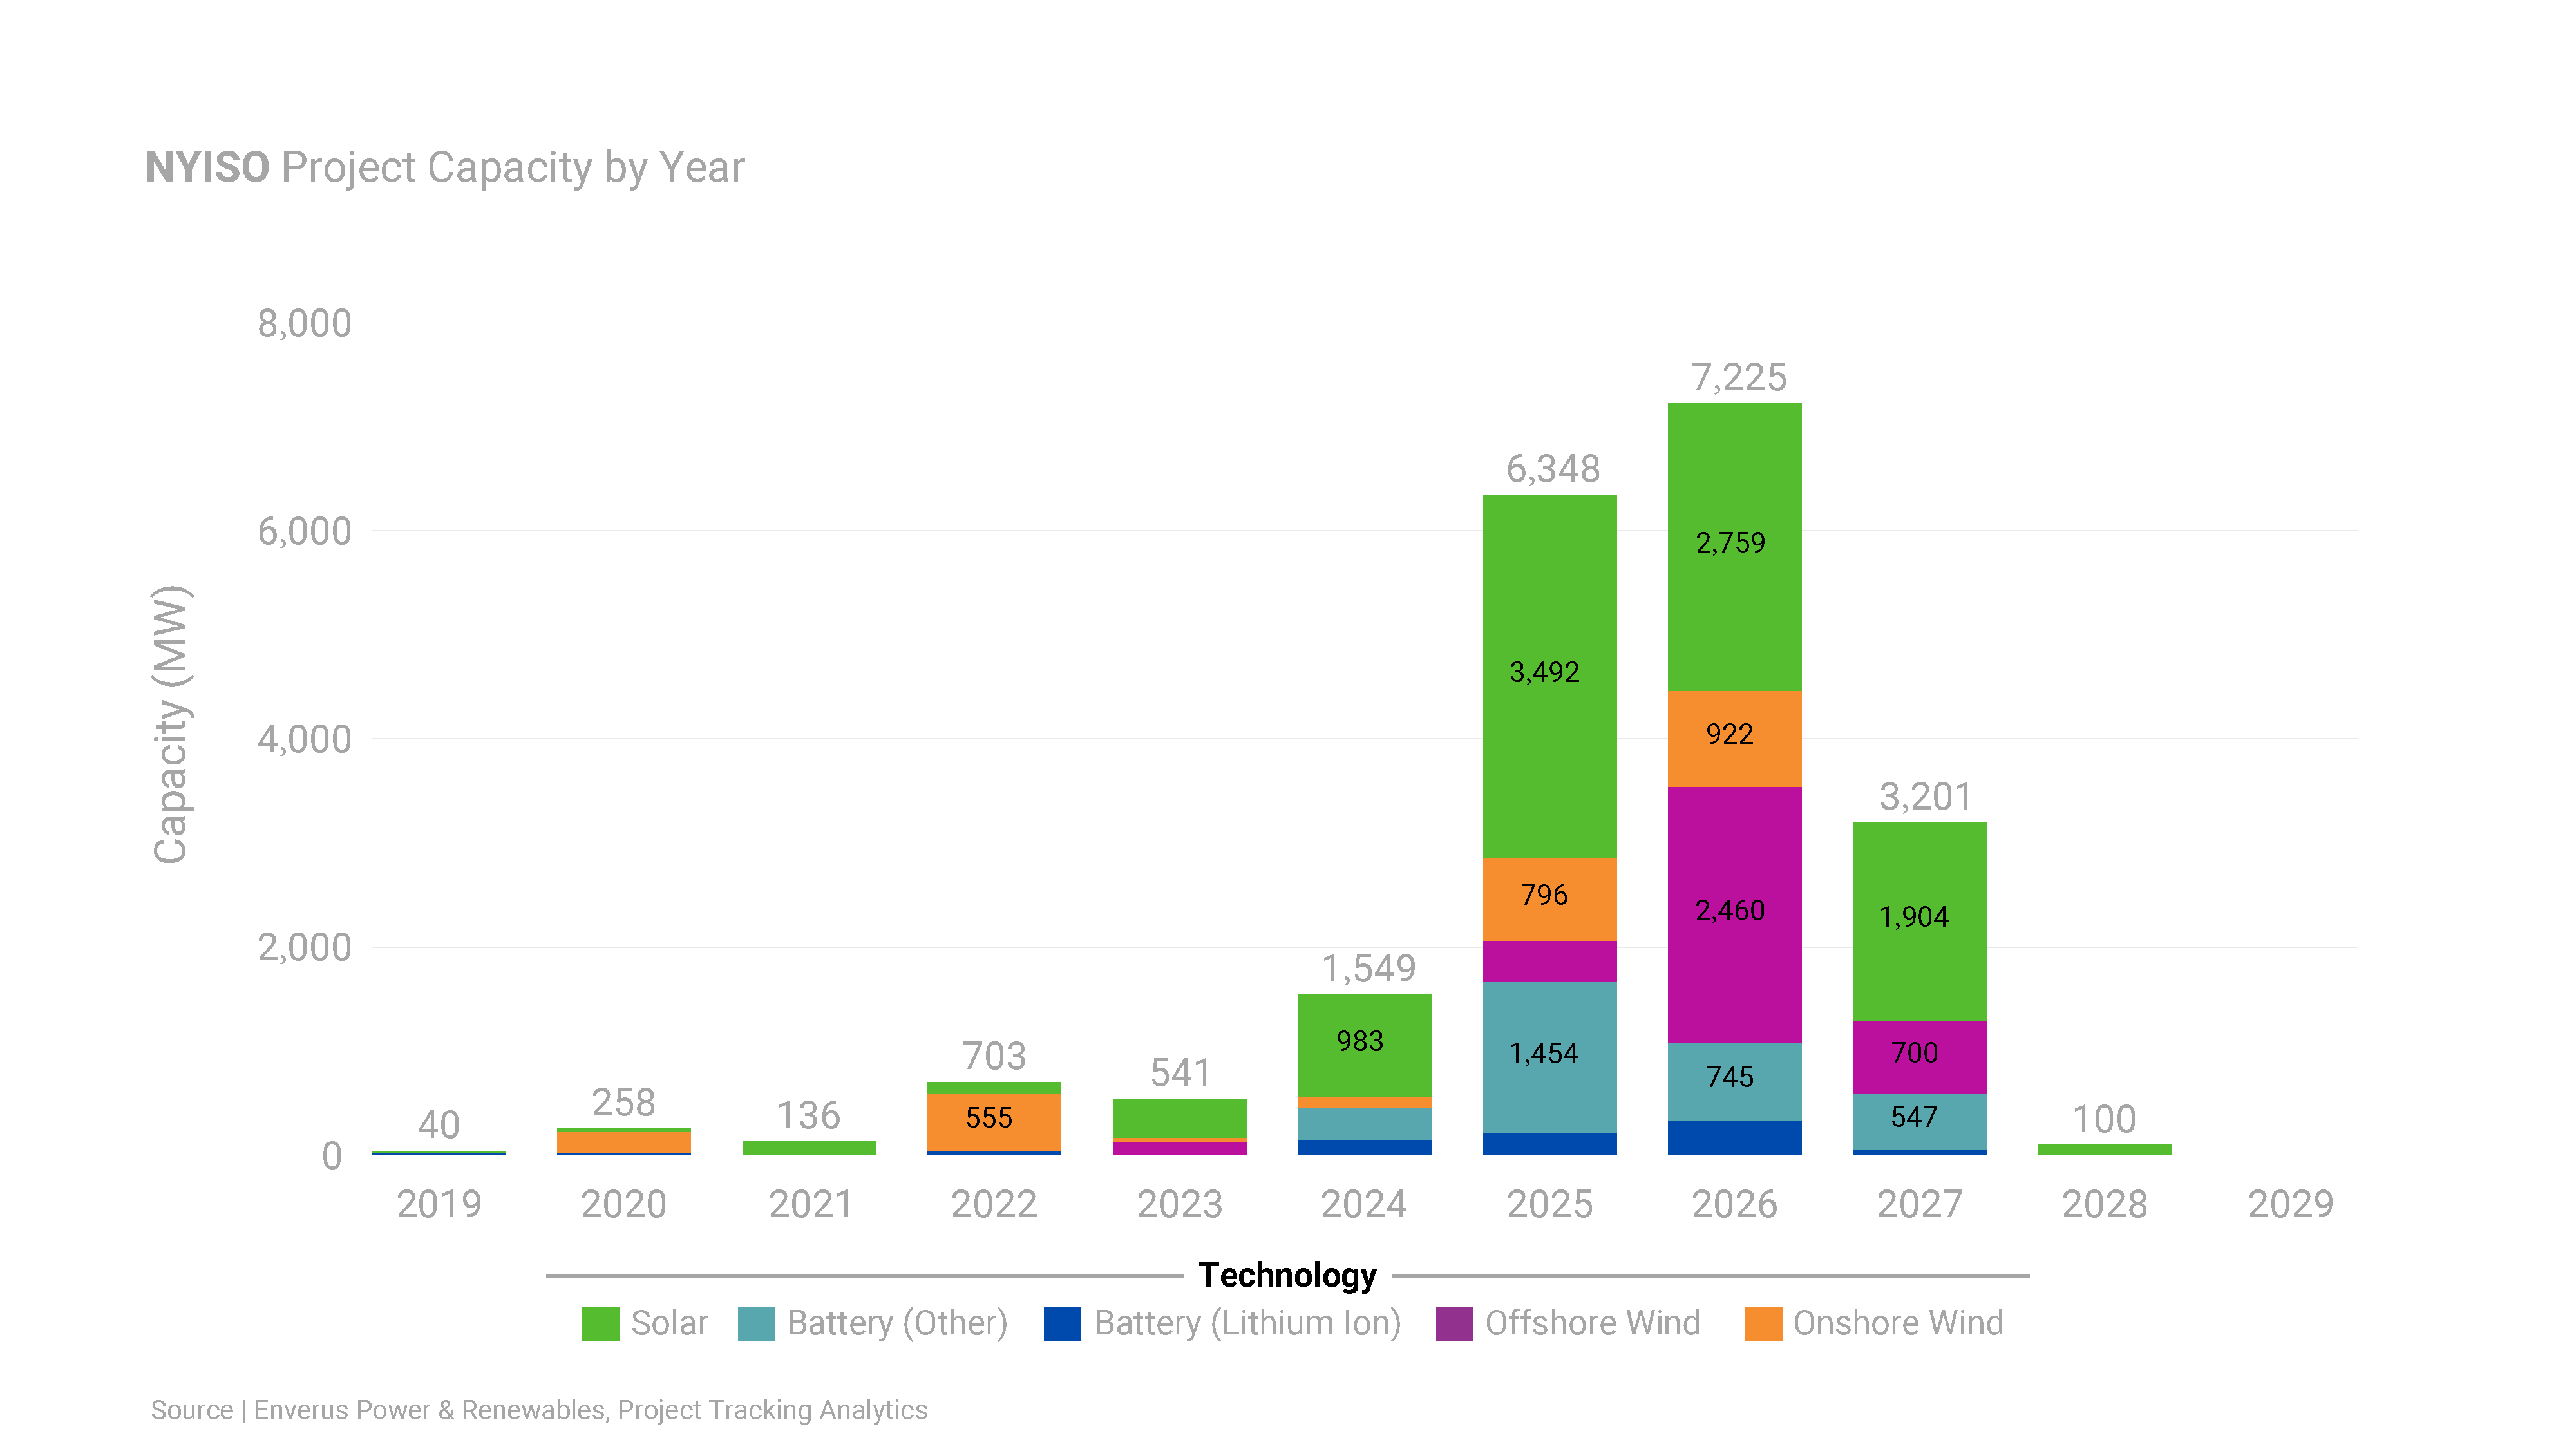
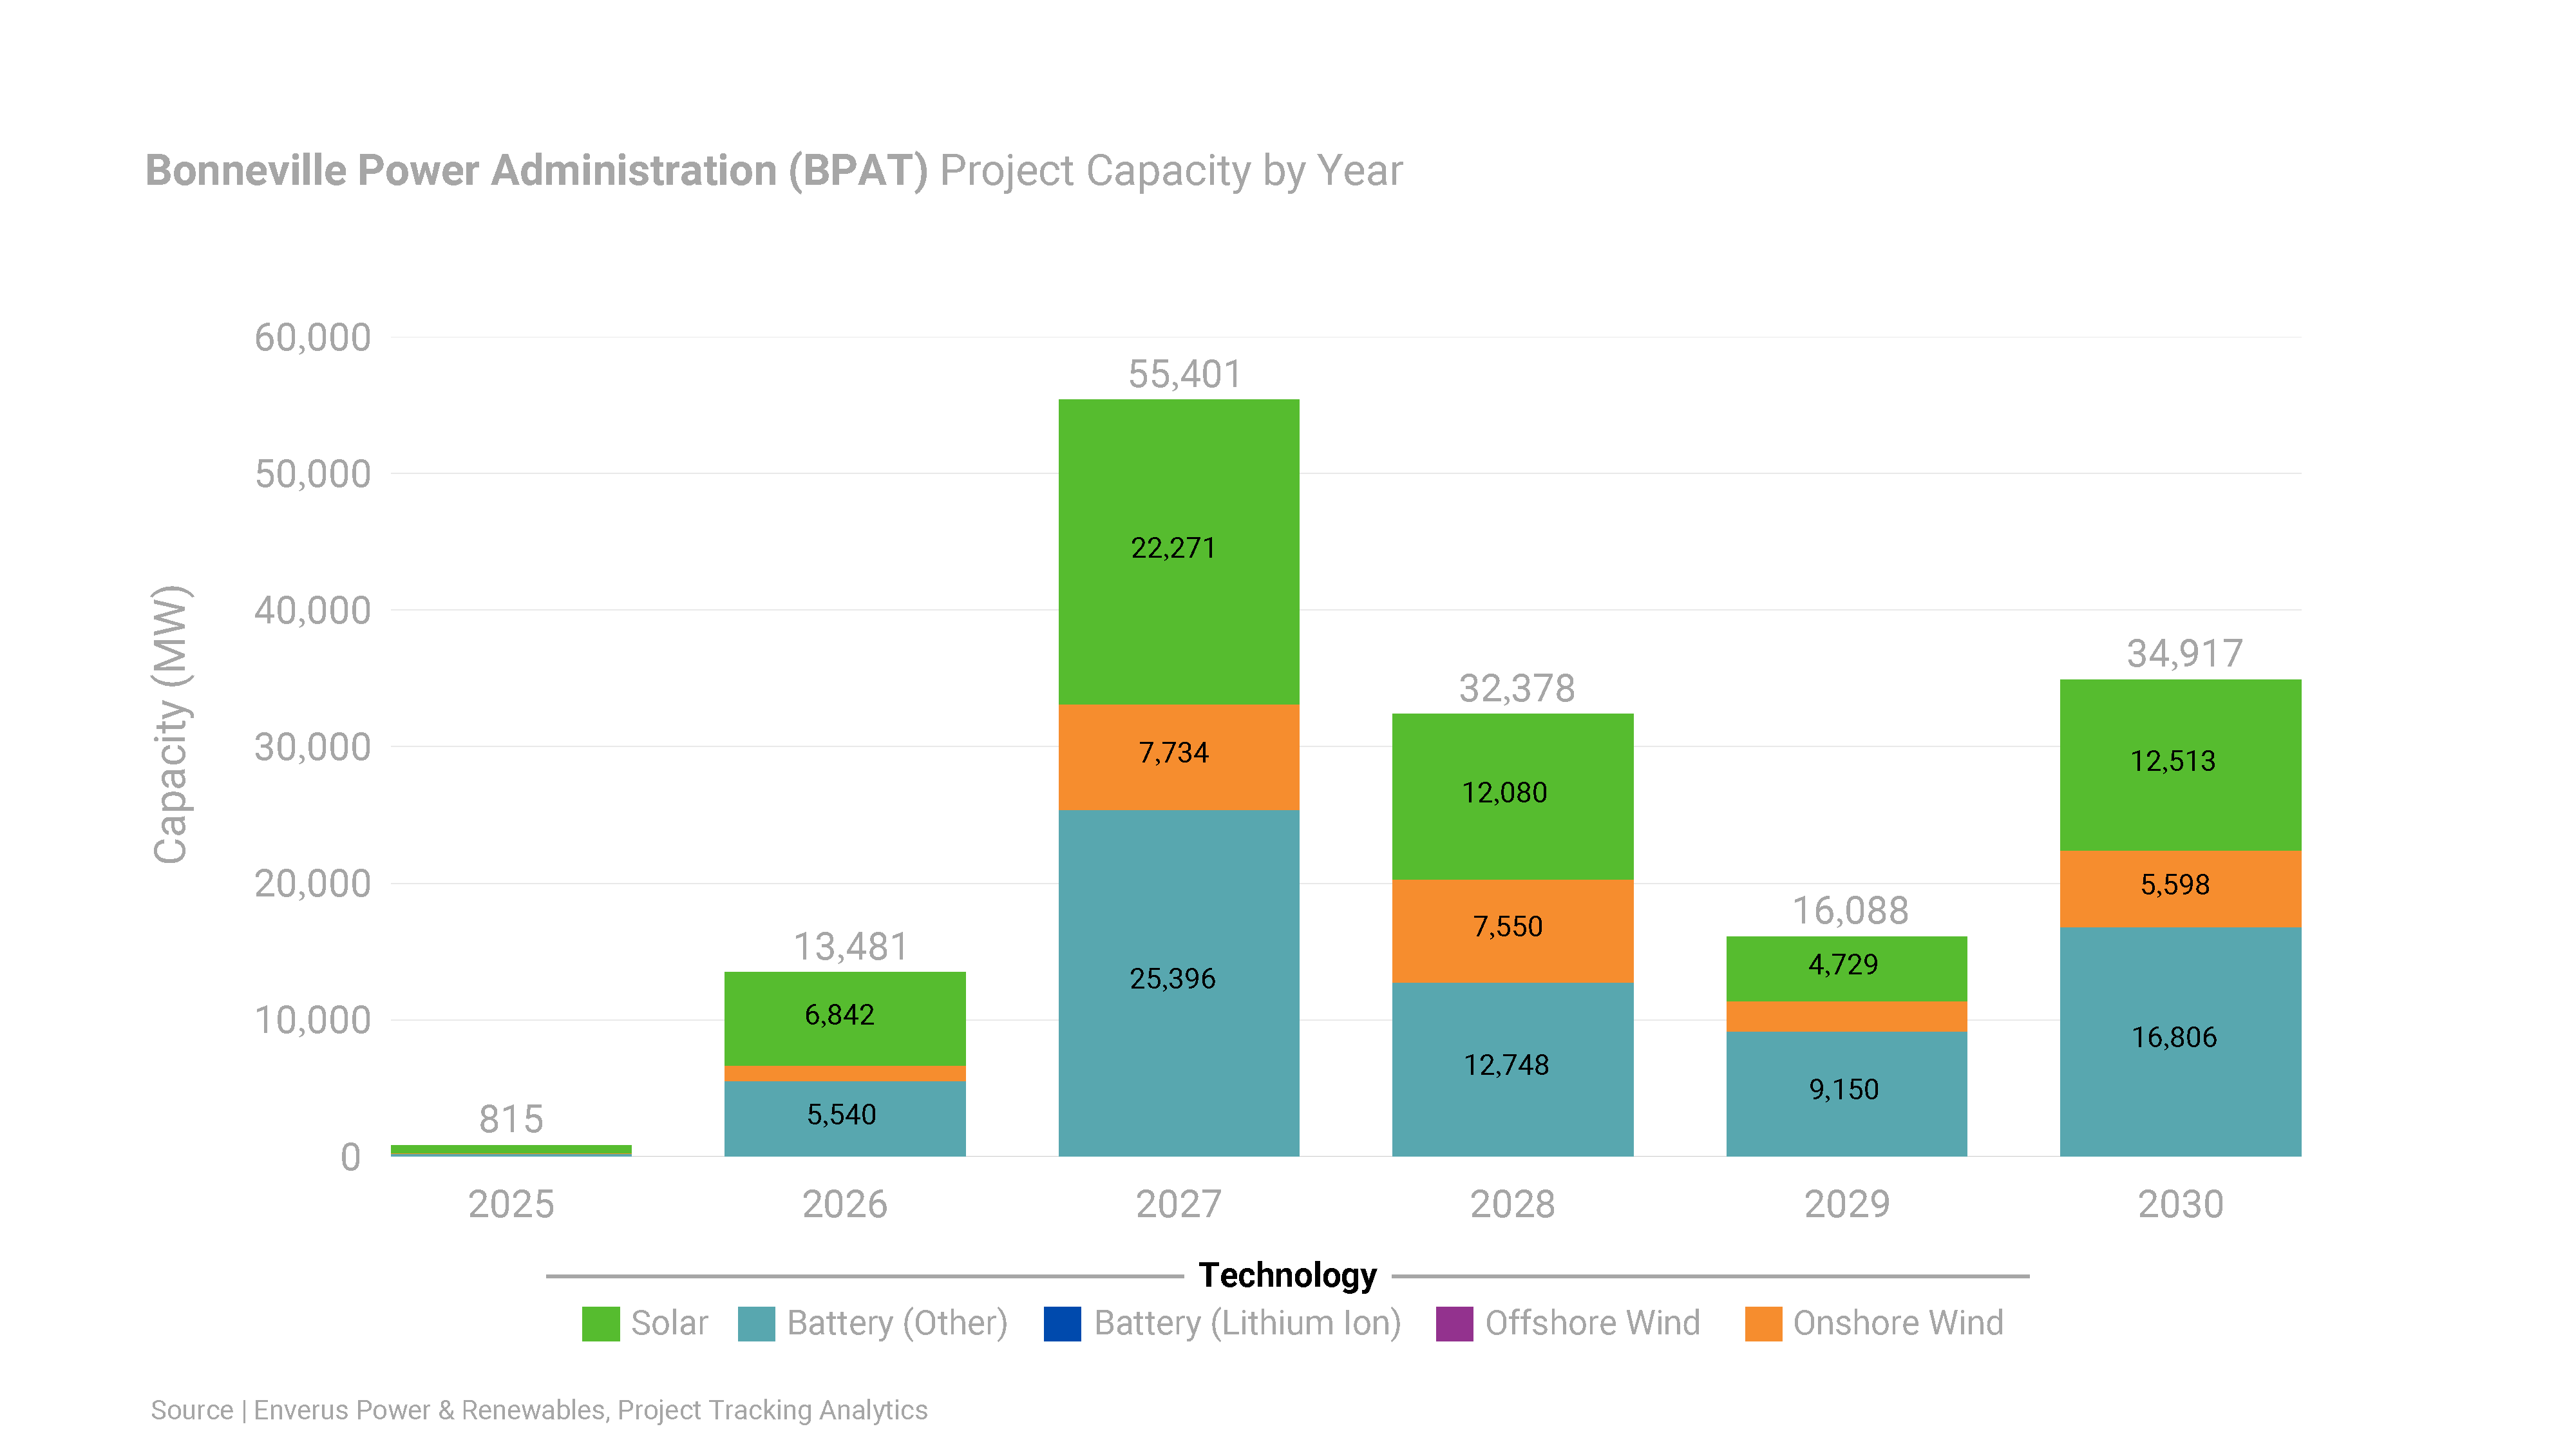
Note on “Upcoming Projects With 2025 Operating Dates” graphs: Unlike the graphs showing projects under construction set to complete in 2025 in other regions, there are no qualifying solar, storage, or wind projects in NYISO or BPAT for 2025.
ISO Overview
| Type | 2024 Planned Capacity | 2024 New Capacity | 2025 Planned Capacity |
|---|---|---|---|
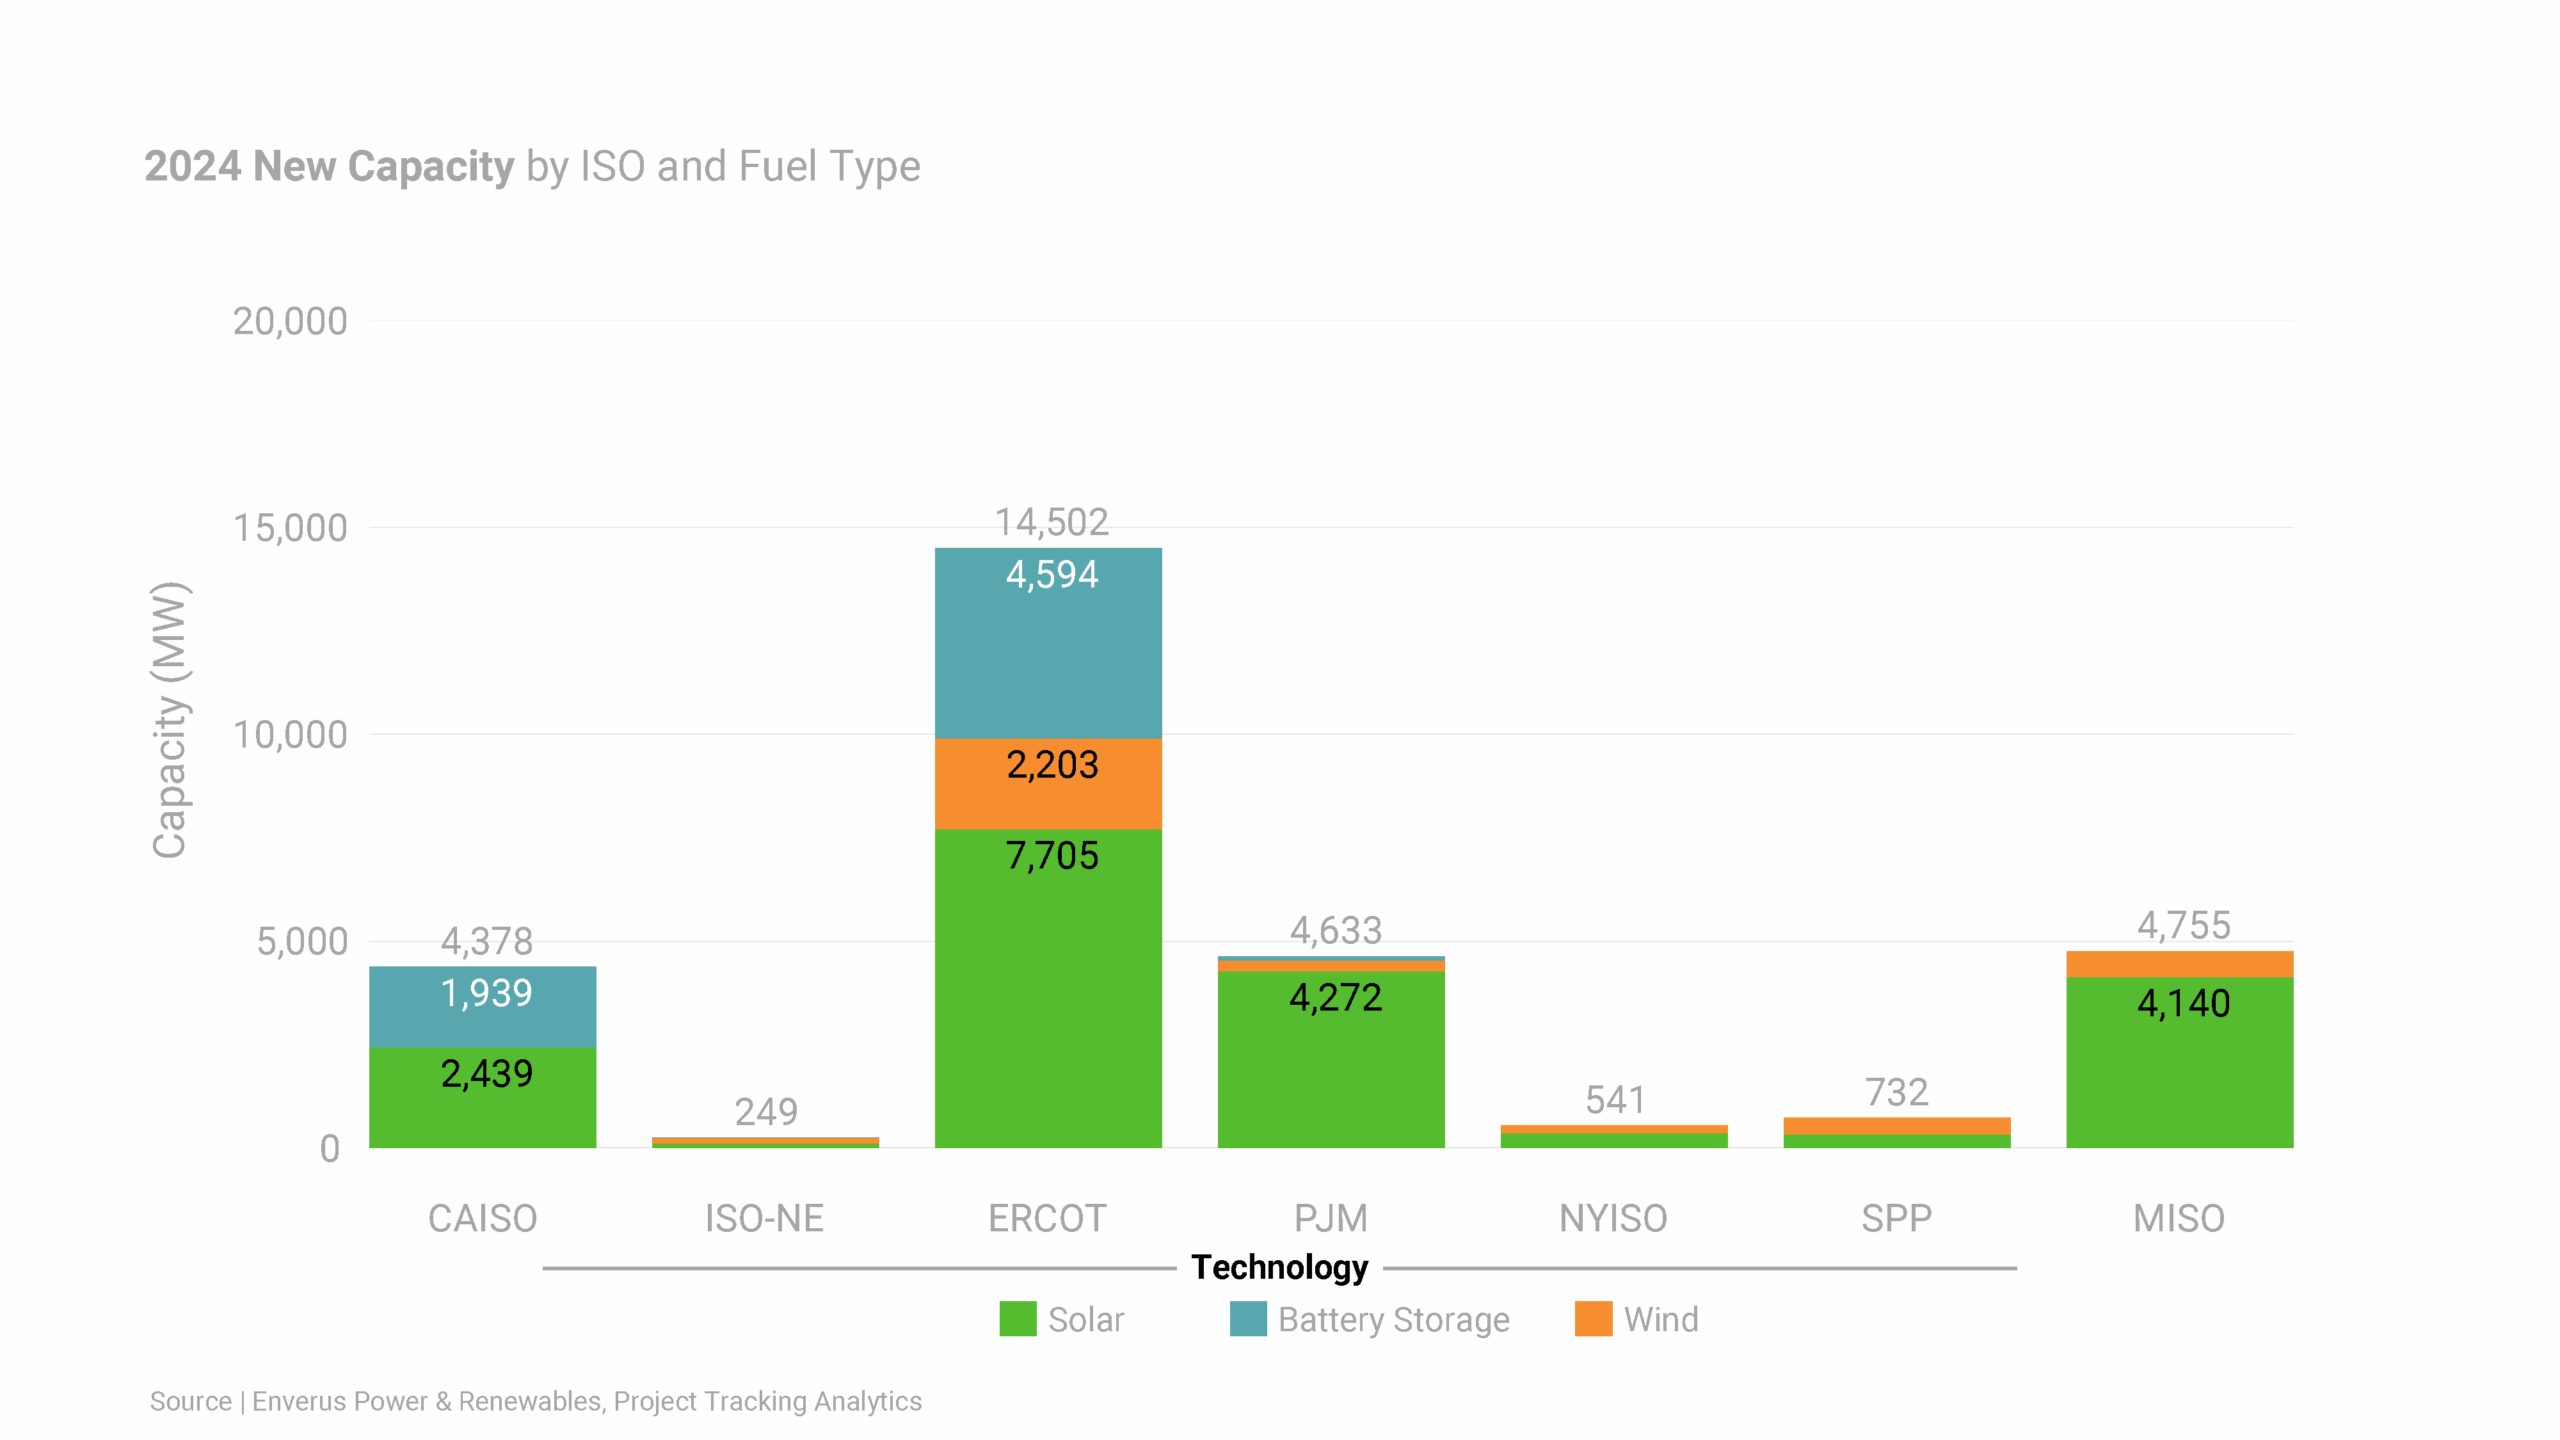
| Solar | 4.7 GW | 2.44 GW | 3.21 GW |
| Wind | 0.5 GW | 0.0 GW | 0.46 GW |
| Storage | 17.8 GW | 1.94 GW | 9.97 GW |
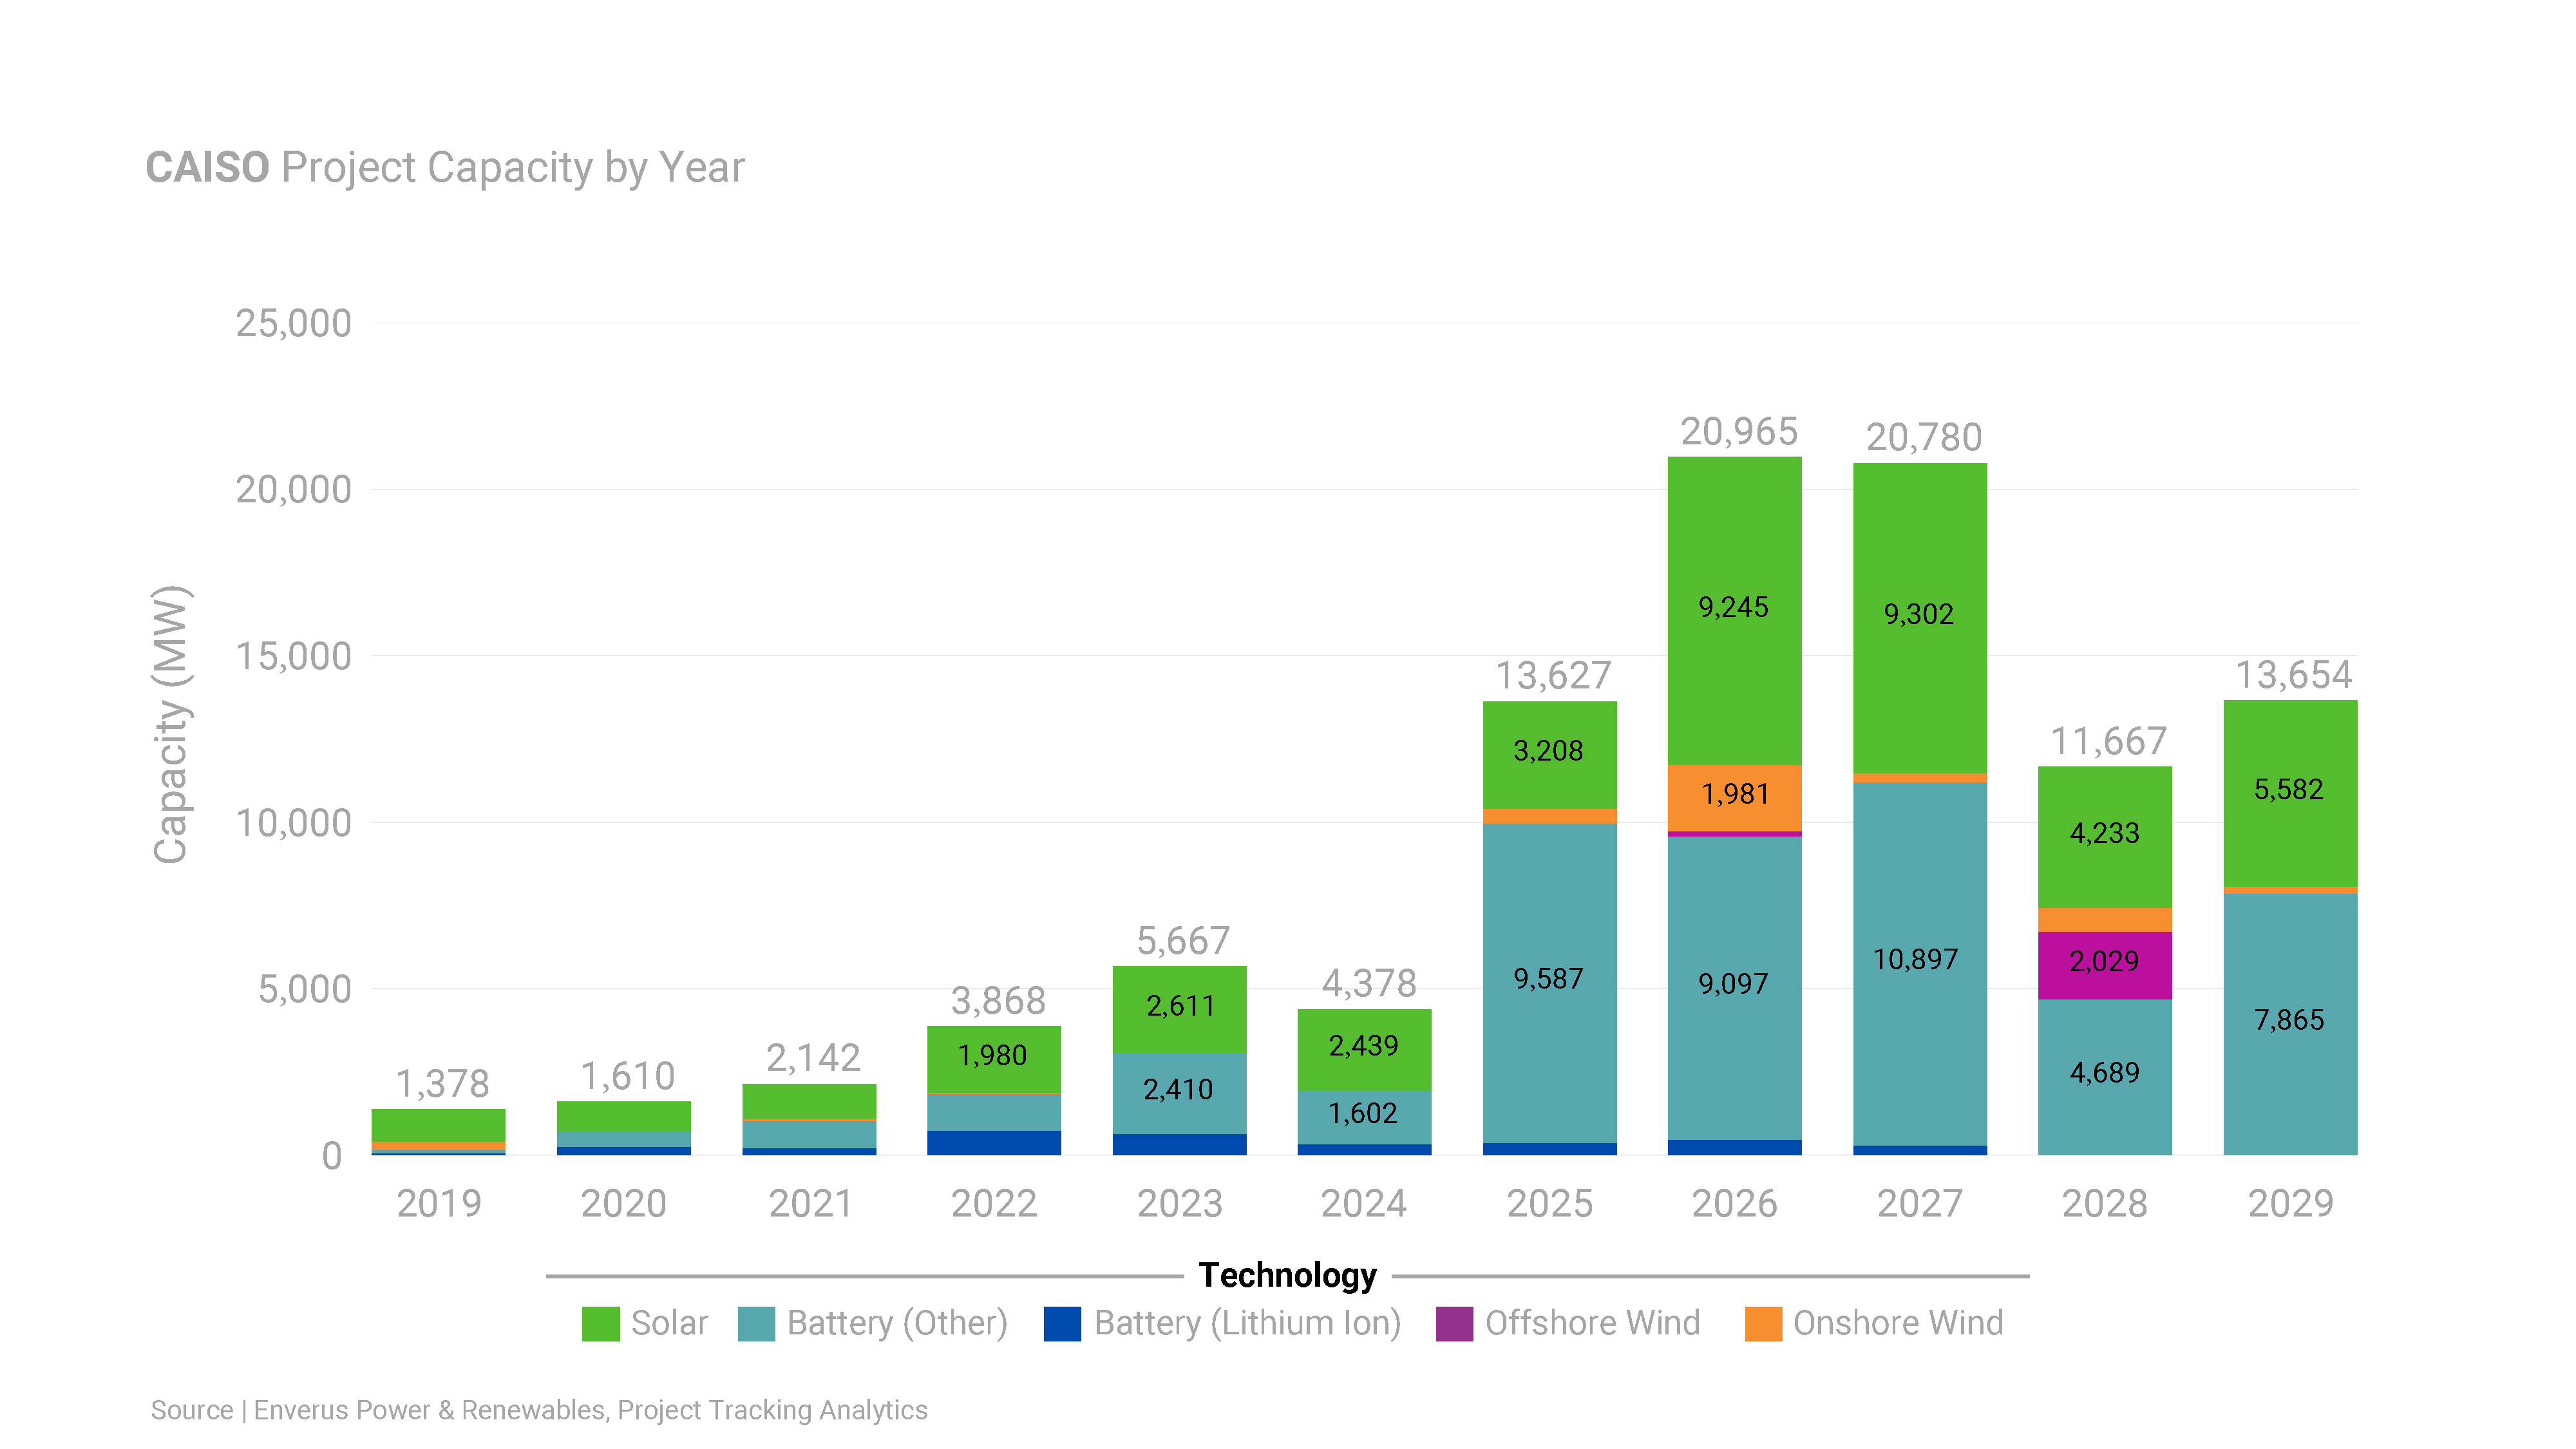
As of January 1, 2025
As of January 1, 2025
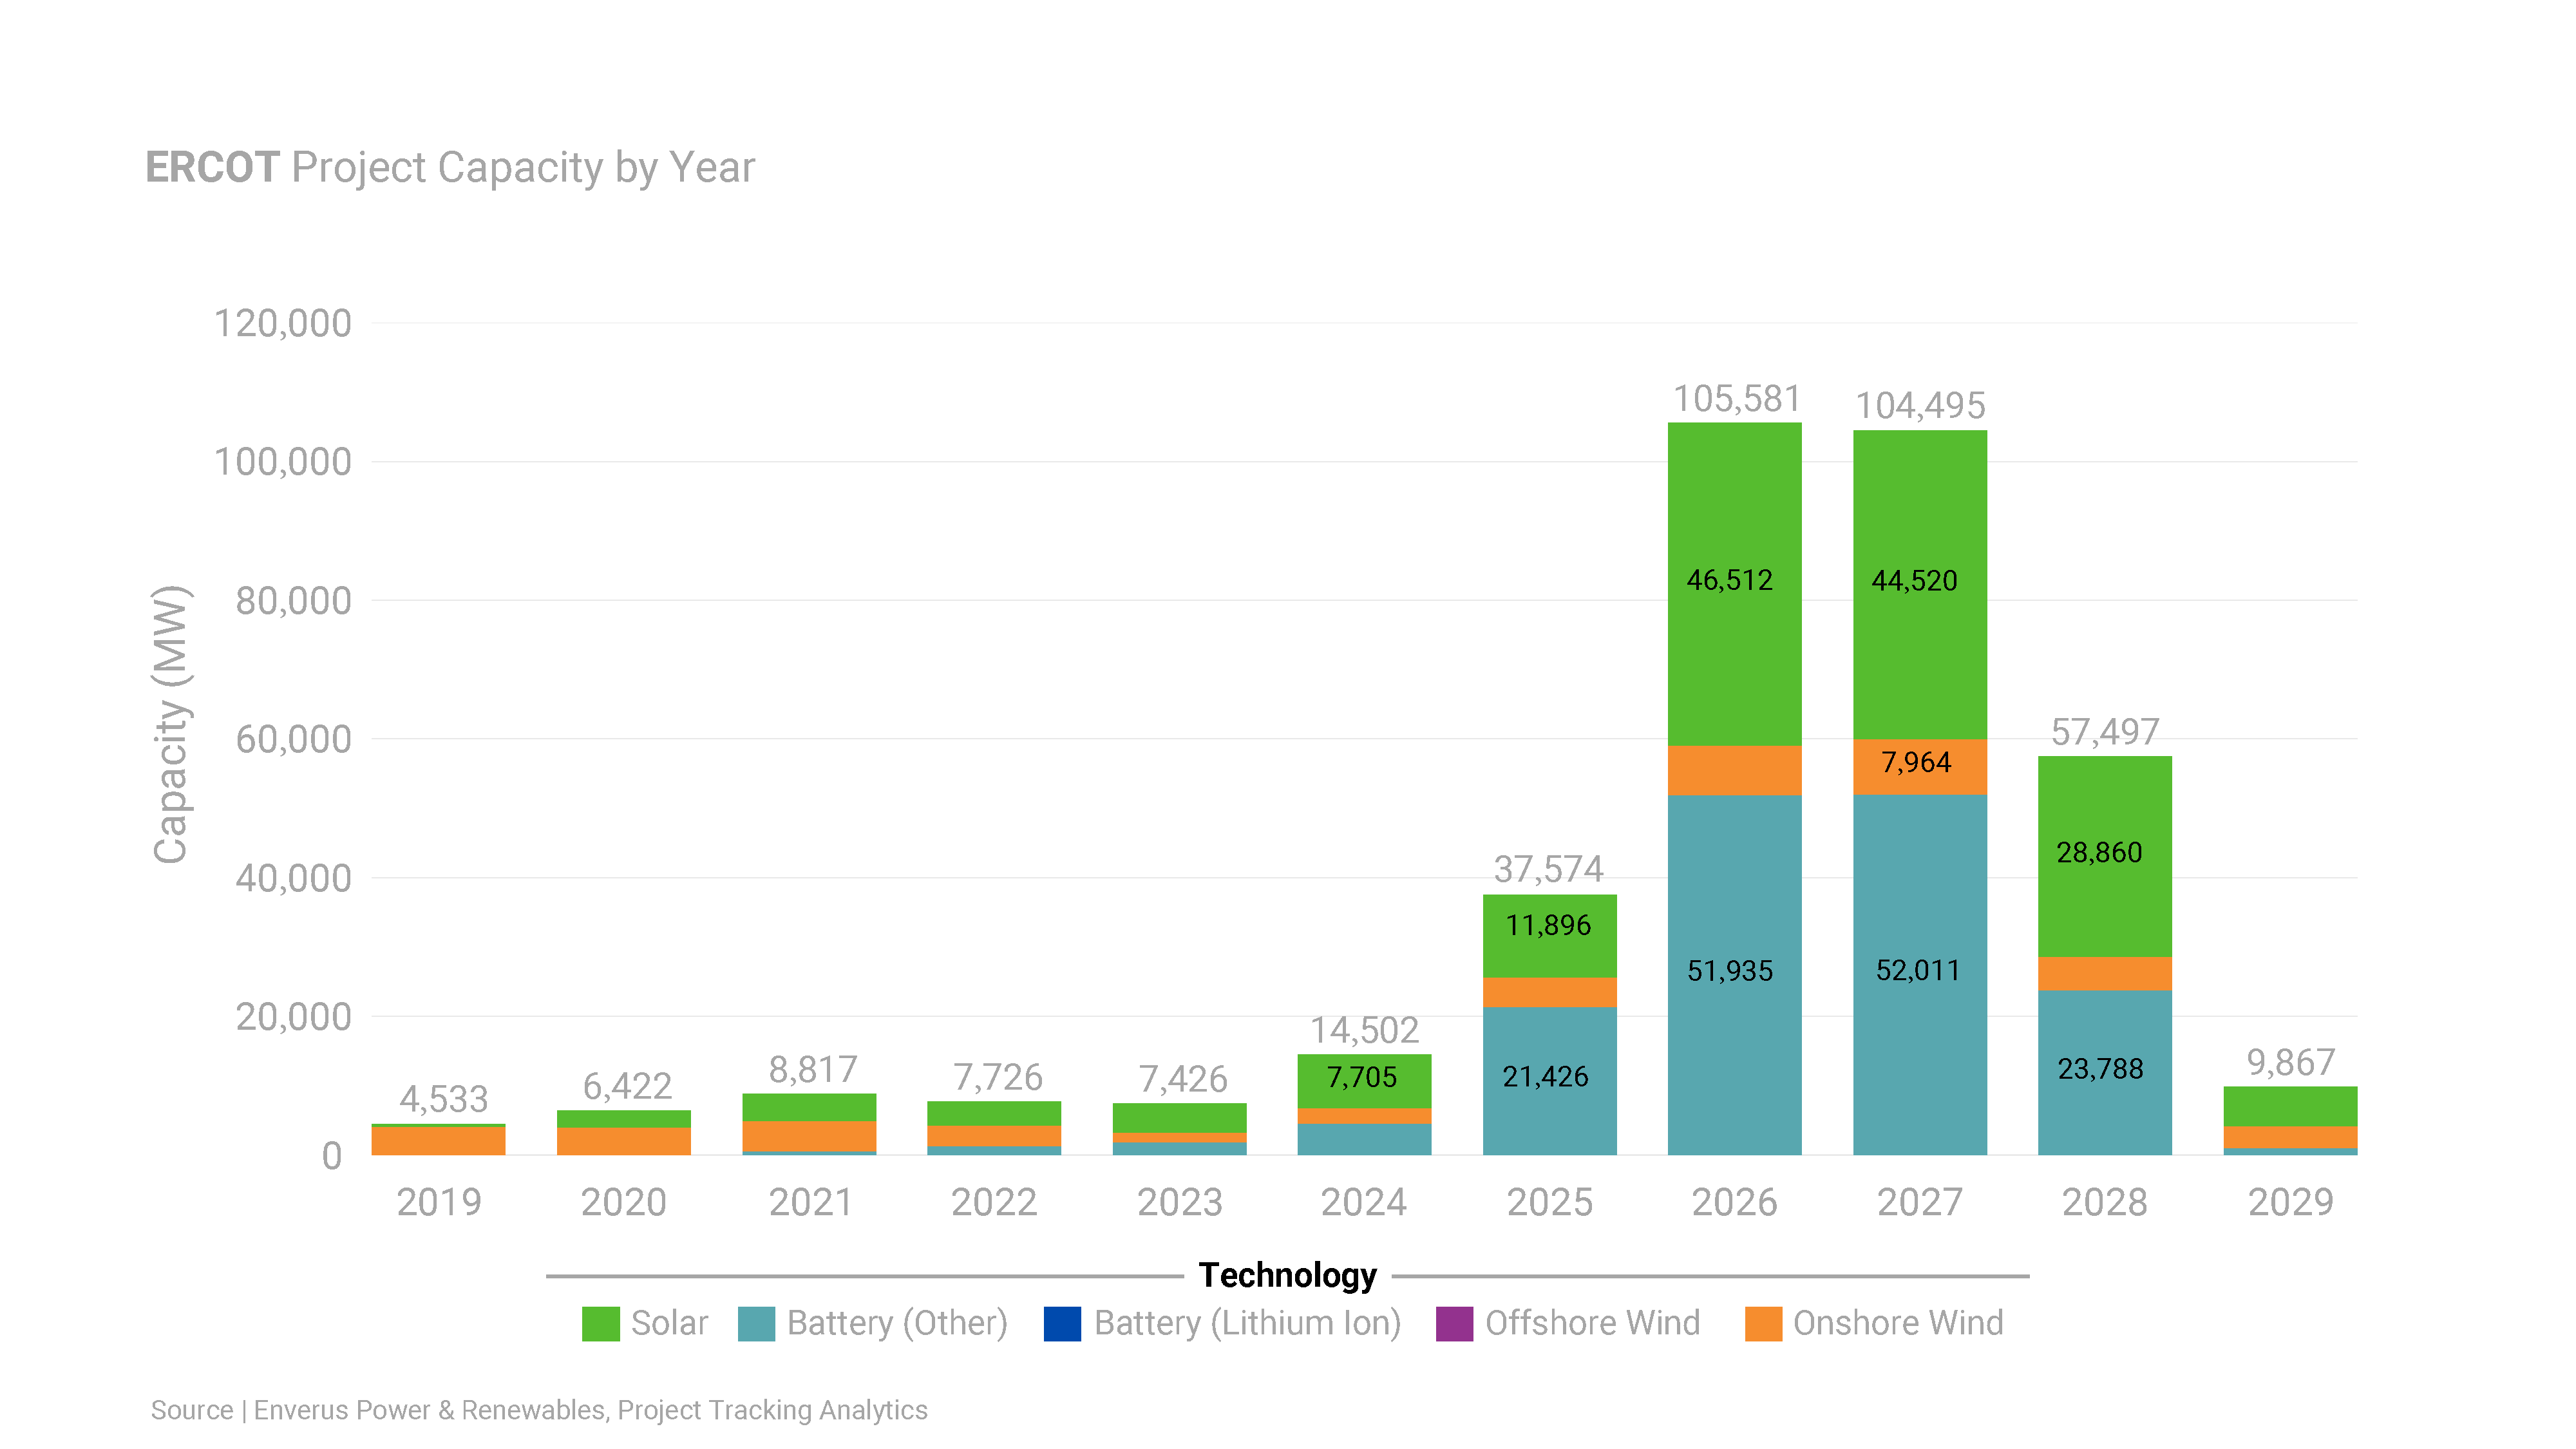
ISO Overview
| Type | 2024 Planned Capacity | 2024 New Capacity | 2025 Planned Capacity |
|---|---|---|---|
| Solar | 11 GW | 7.71 GW | 11.9 GW |
| Wind | 4 GW | 2.2 GW | 4.25 GW |
| Storage | 21 GW | 4.59 GW | 21.4 GW |
As of January 1, 2025
As of January 1, 2025
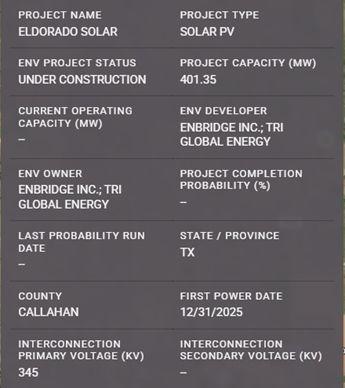
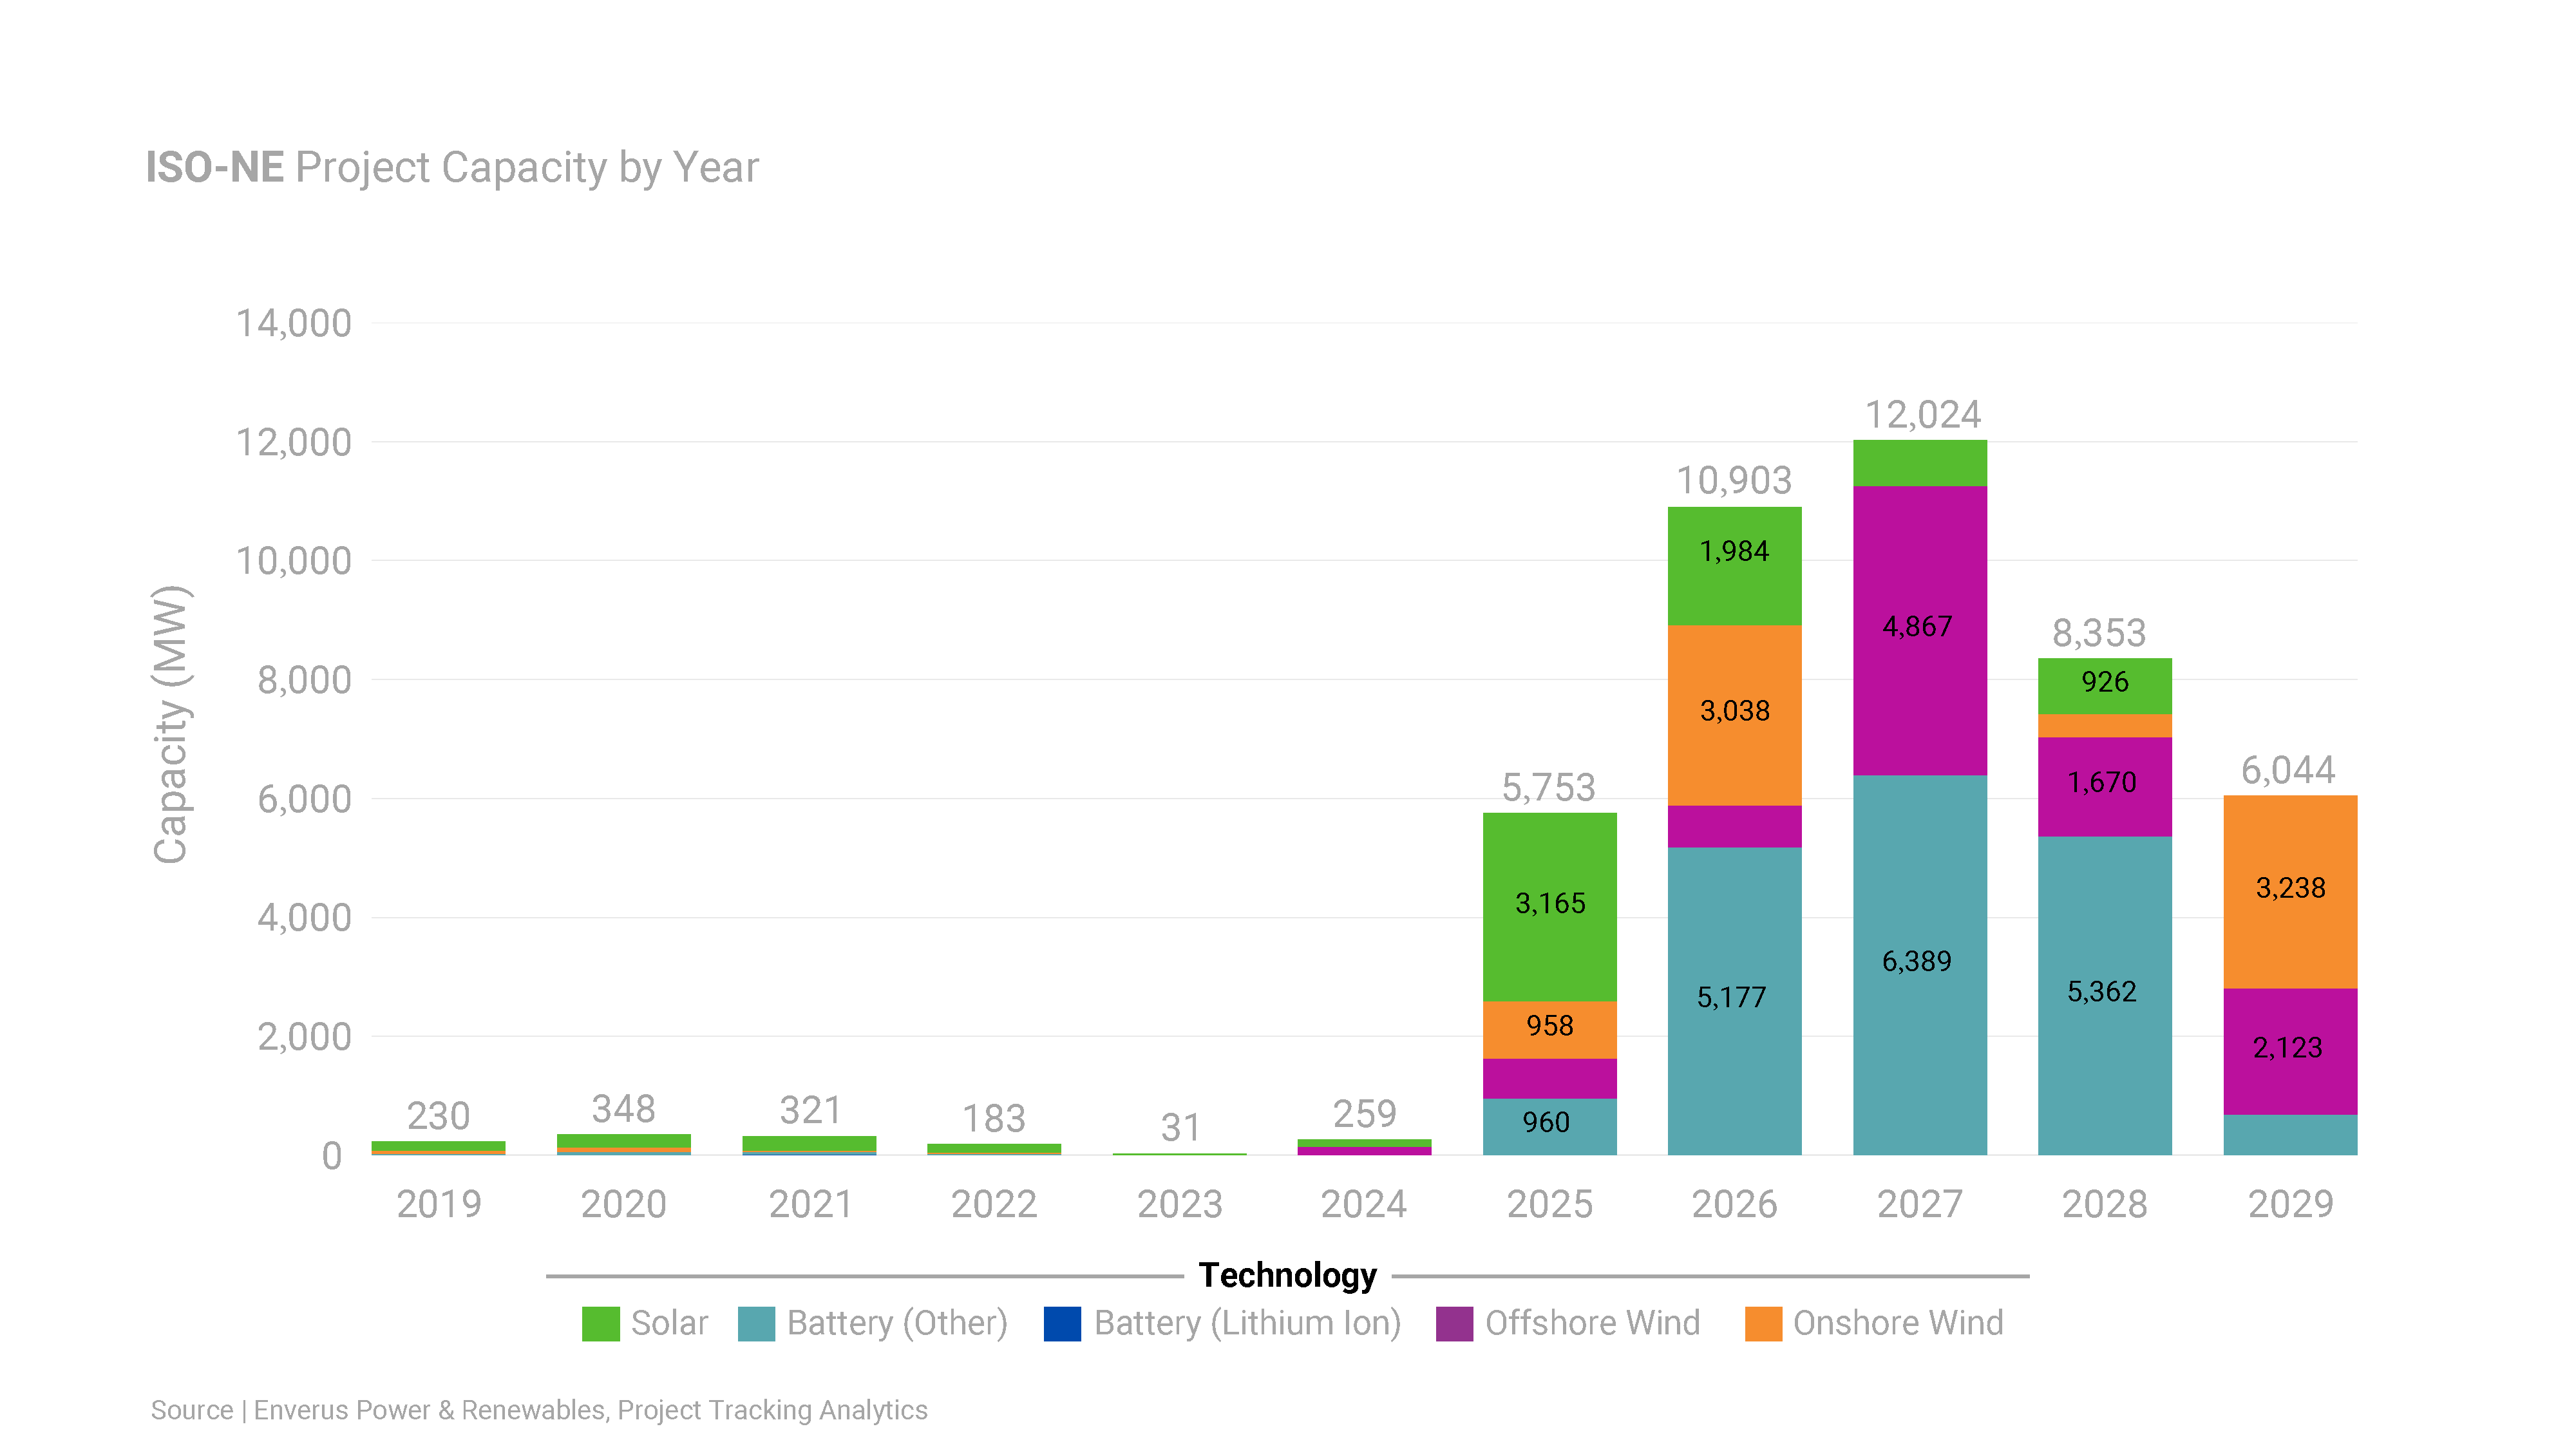
ISO Overview
| Type | 2024 Planned Capacity | 2024 New Capacity | 2025 Planned Capacity |
|---|---|---|---|
| Solar | 5.3 GW | 0.11 GW | 3.15 GW |
| Wind | 1.7 GW | 0.136 GW | 1.38 GW |
| Storage | 2 GW | 0.003 GW | 0.96 GW |
As of January 1, 2025
As of January 1, 2025
ISO Overview
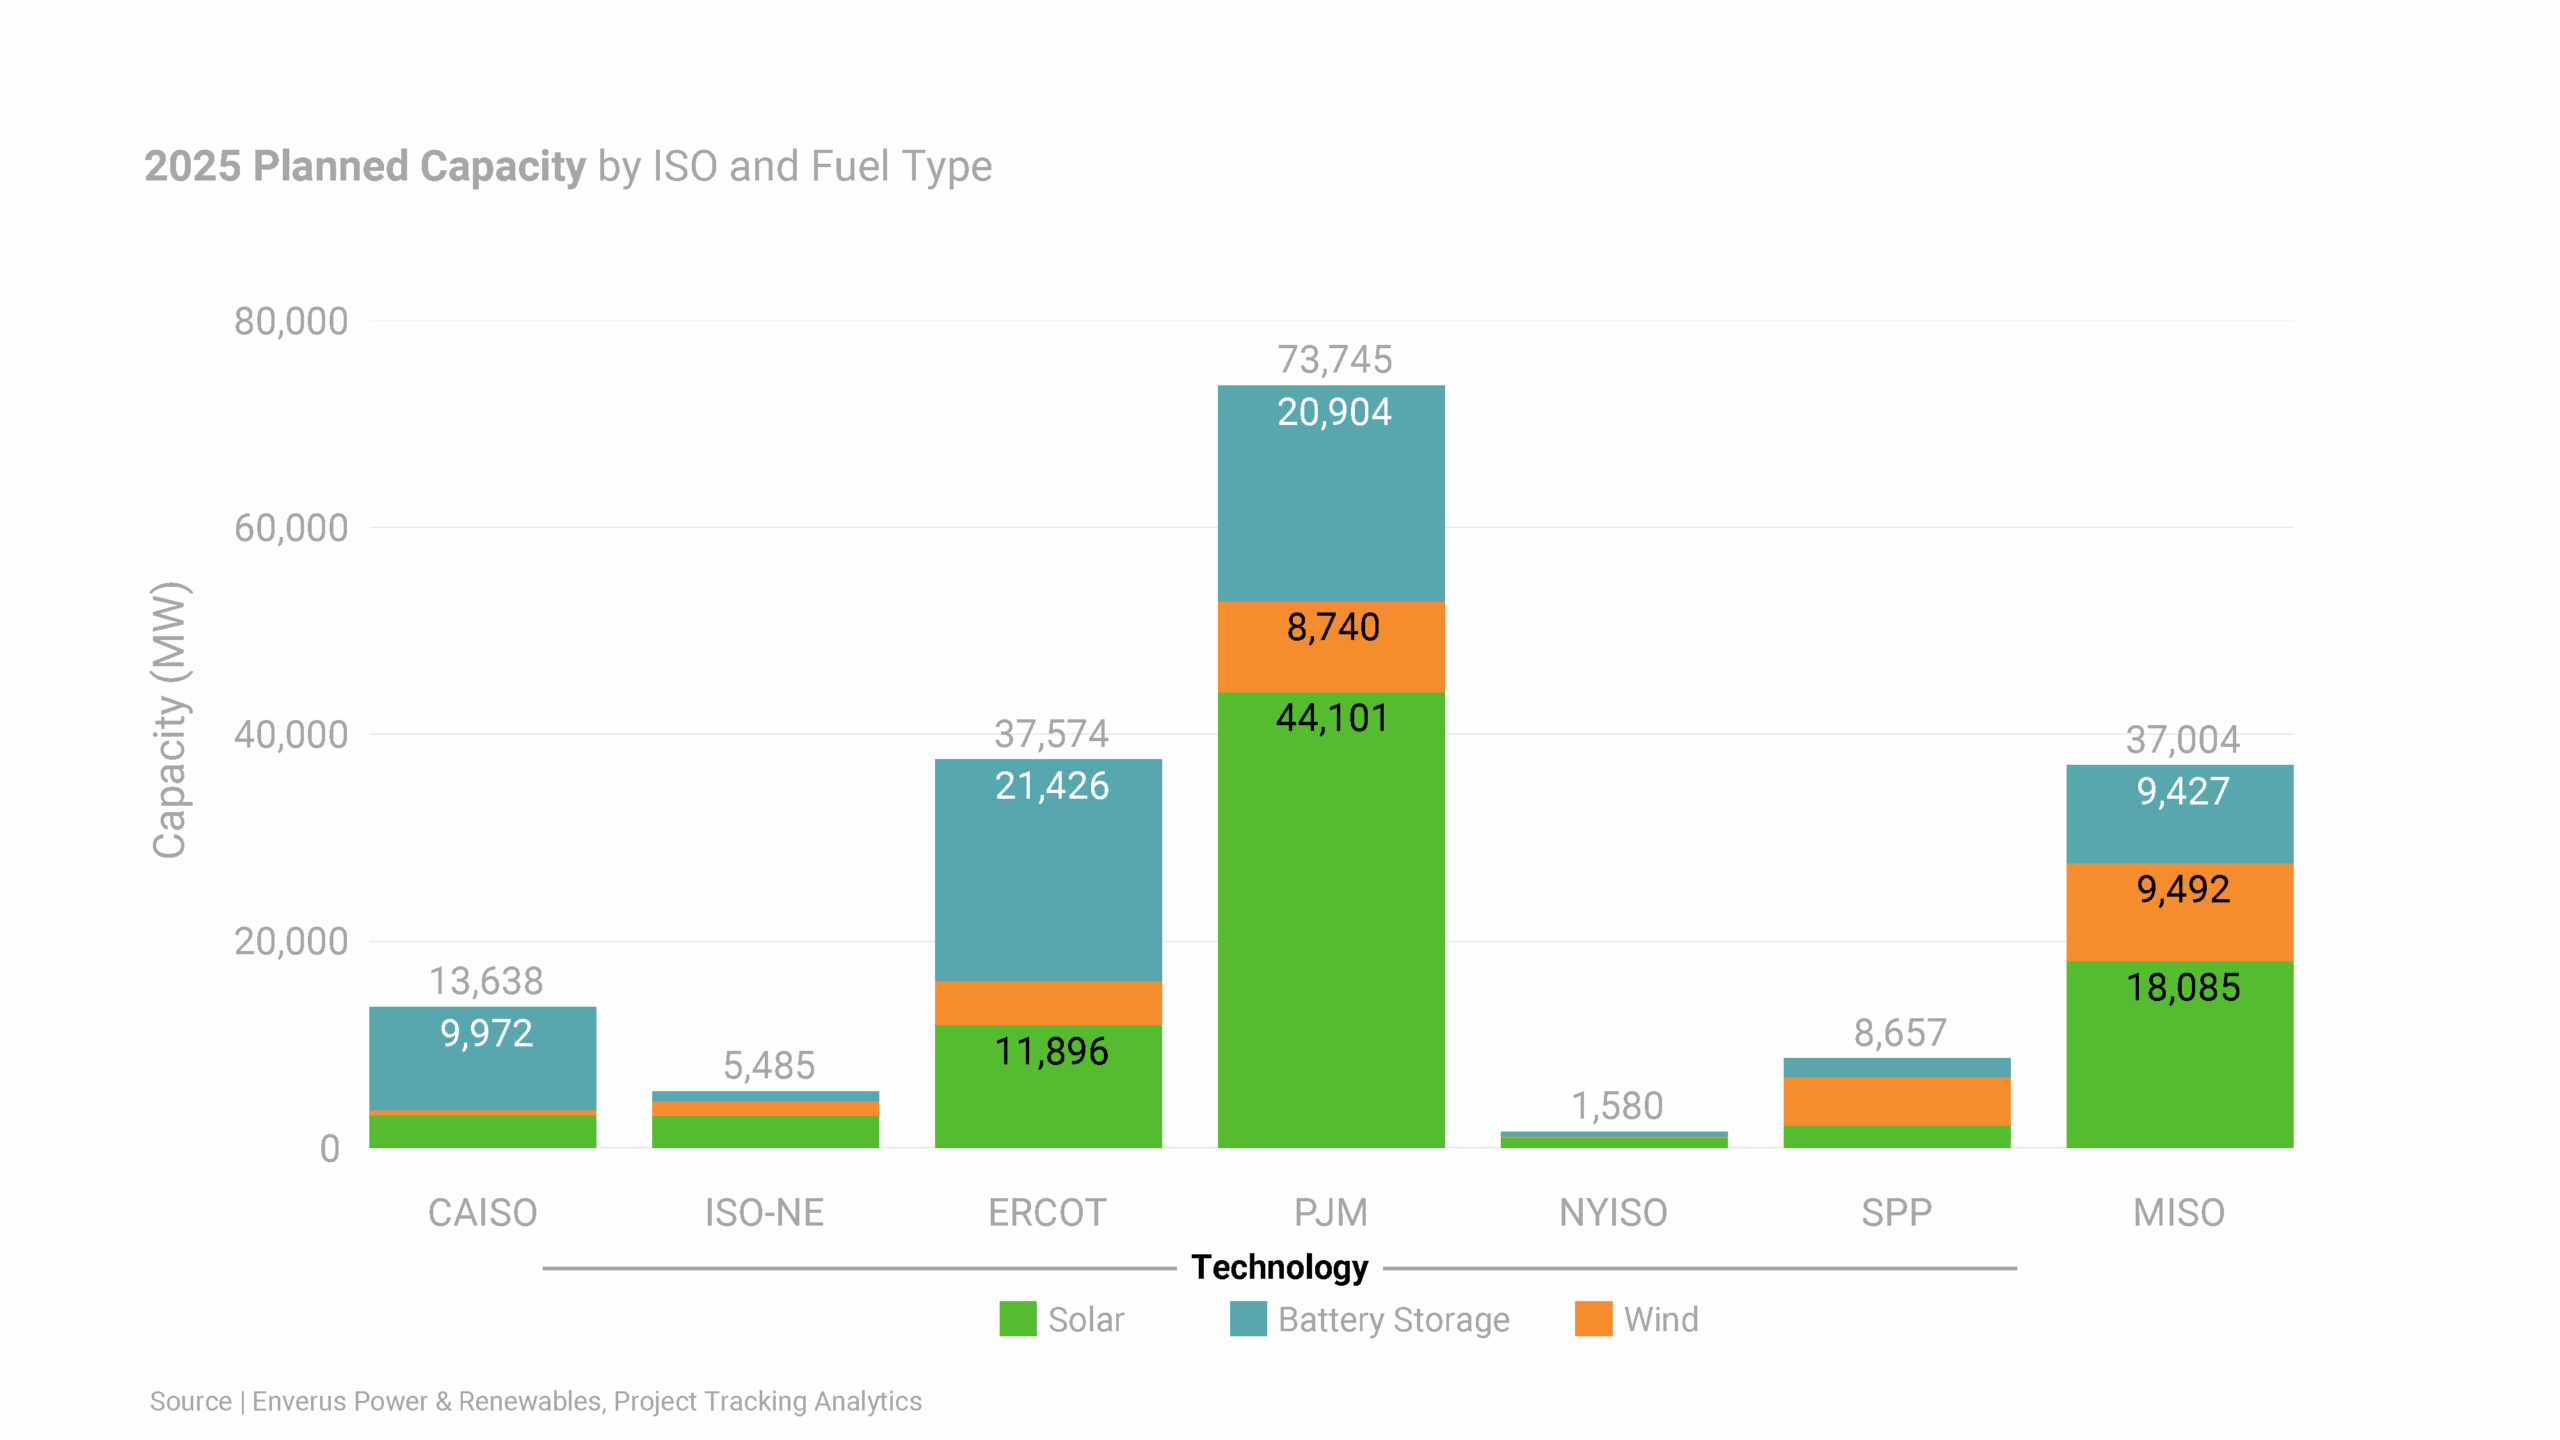
| Type | 2024 Planned Capacity | 2024 New Capacity | 2025 Planned Capacity |
|---|---|---|---|
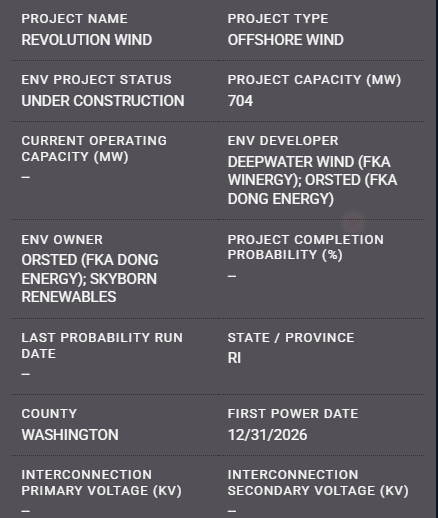
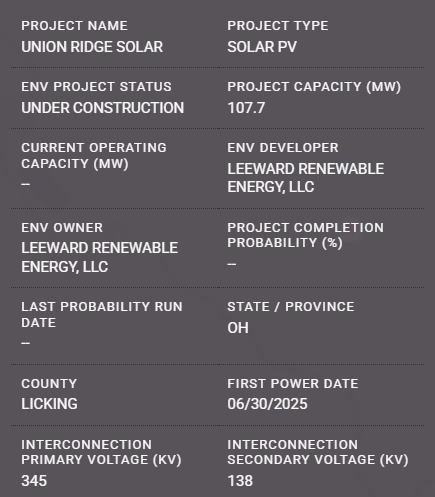
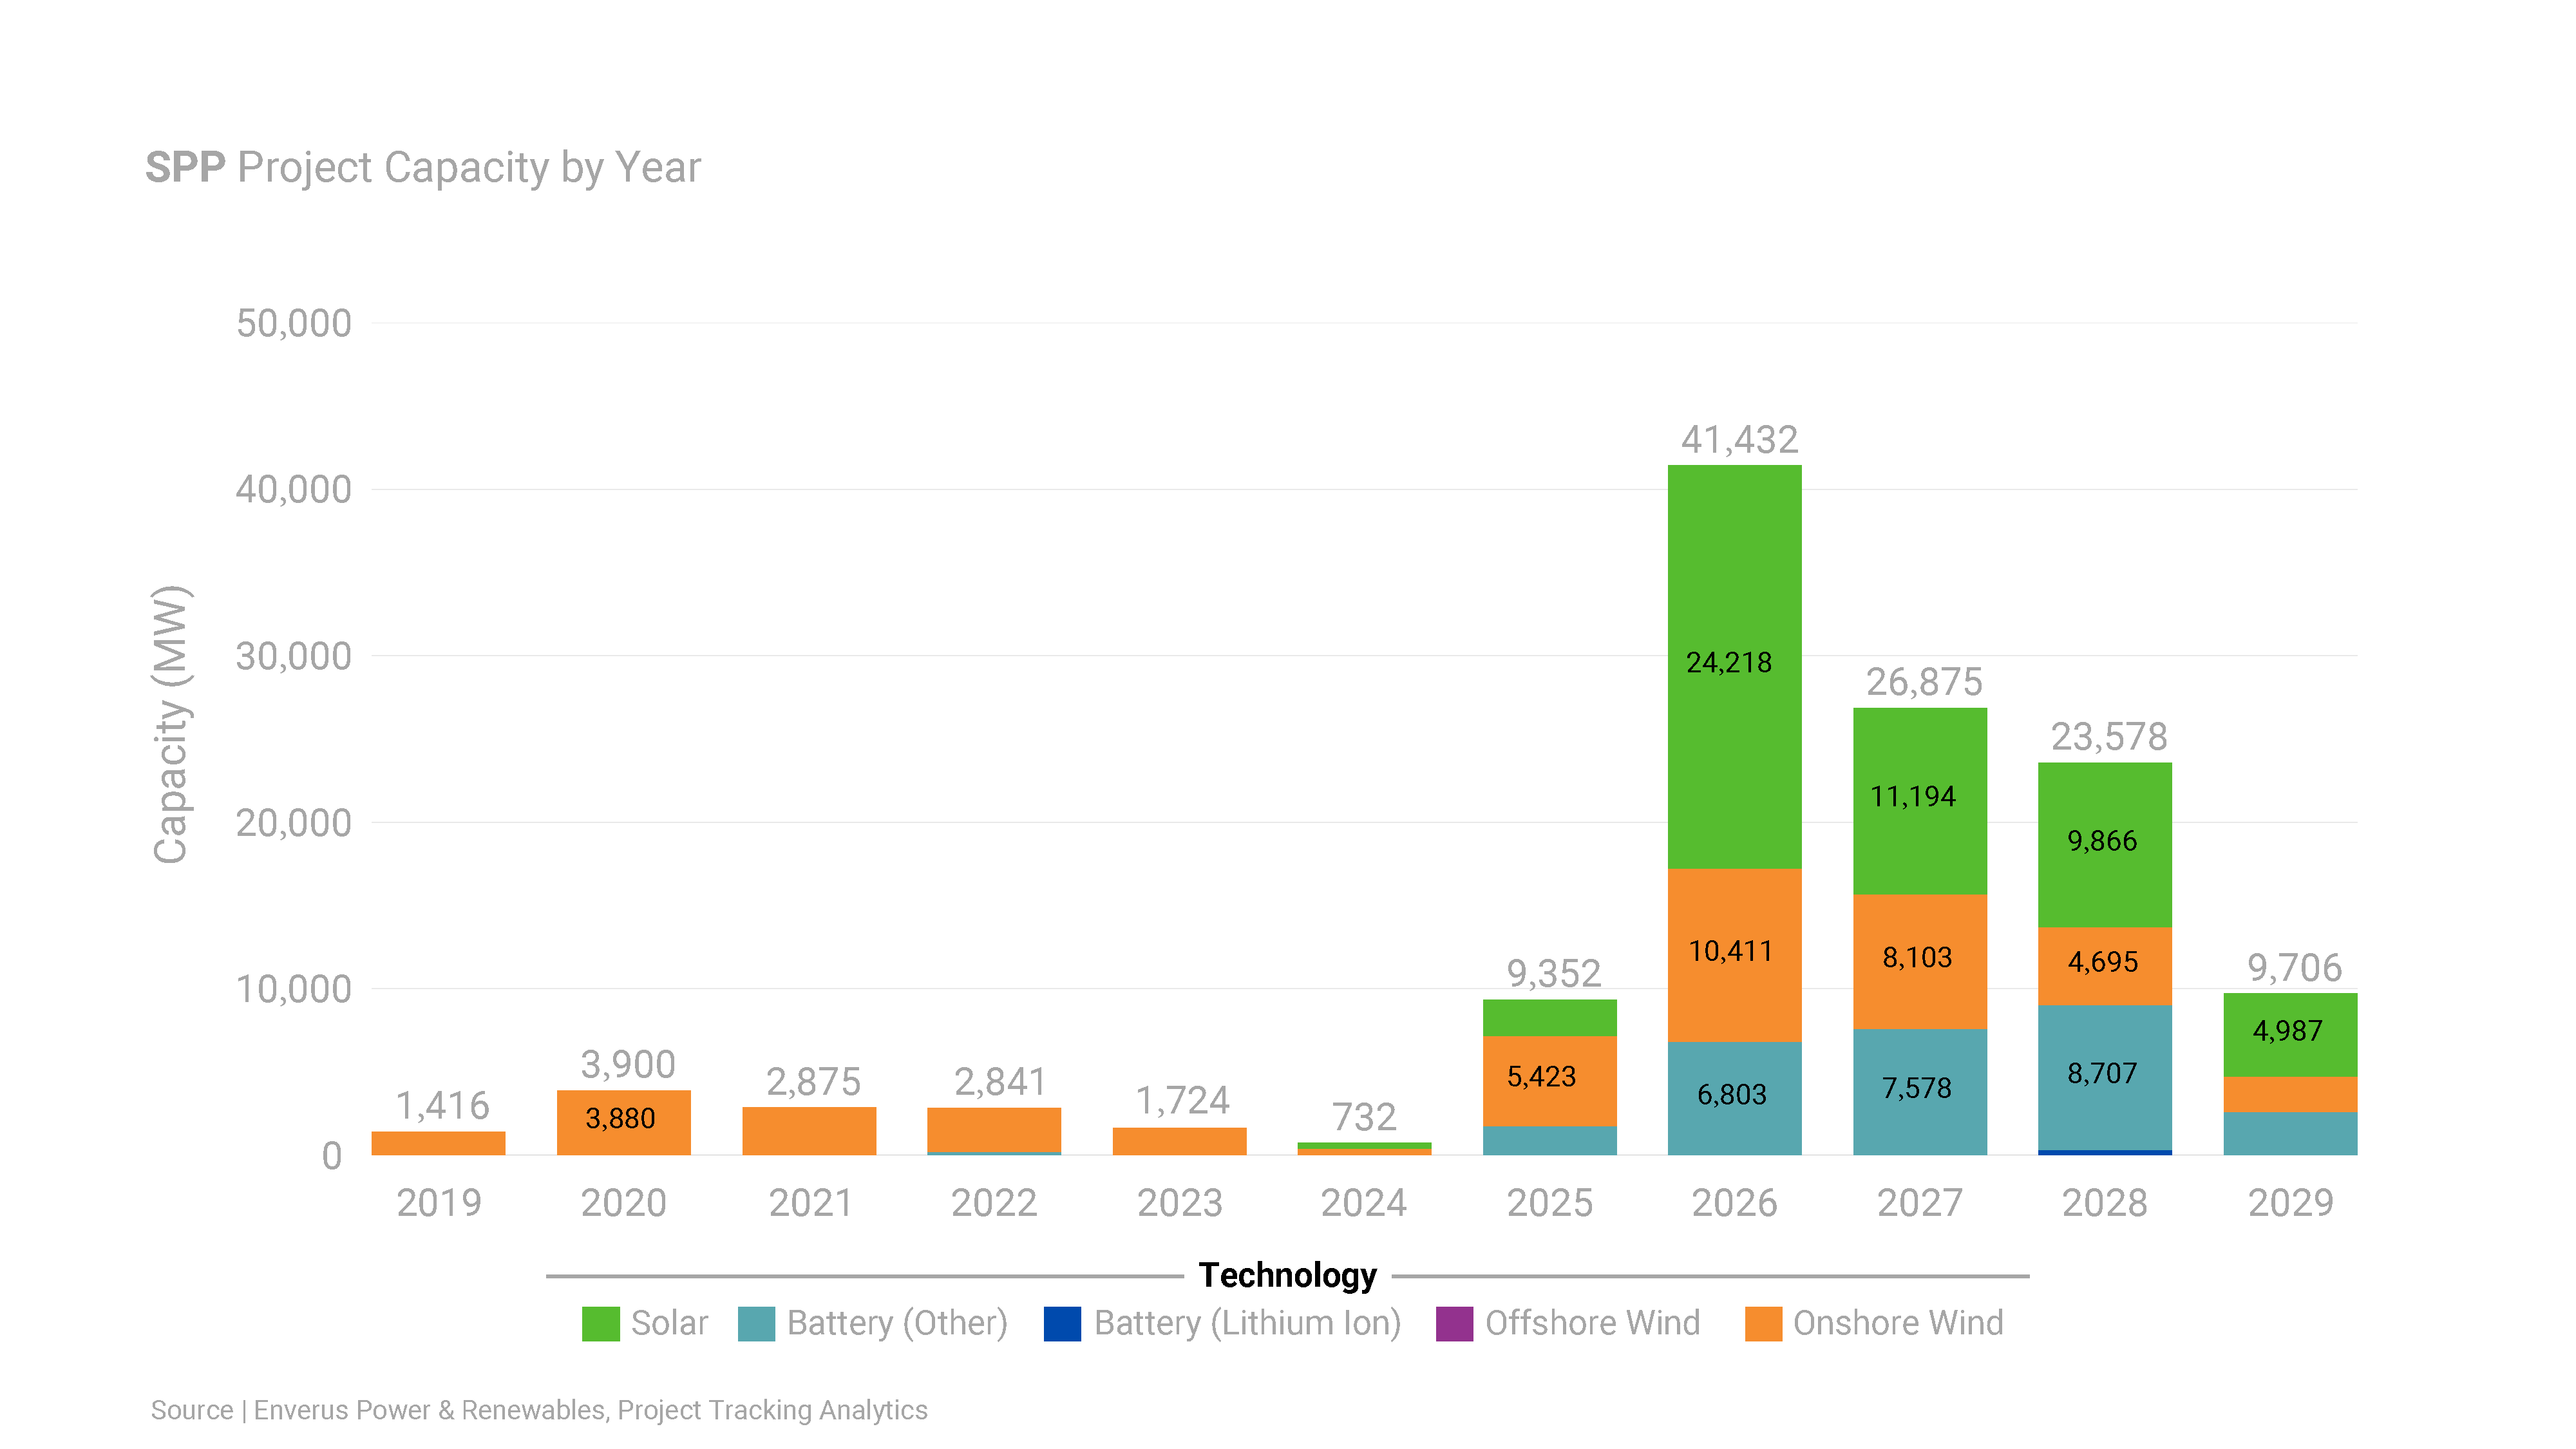
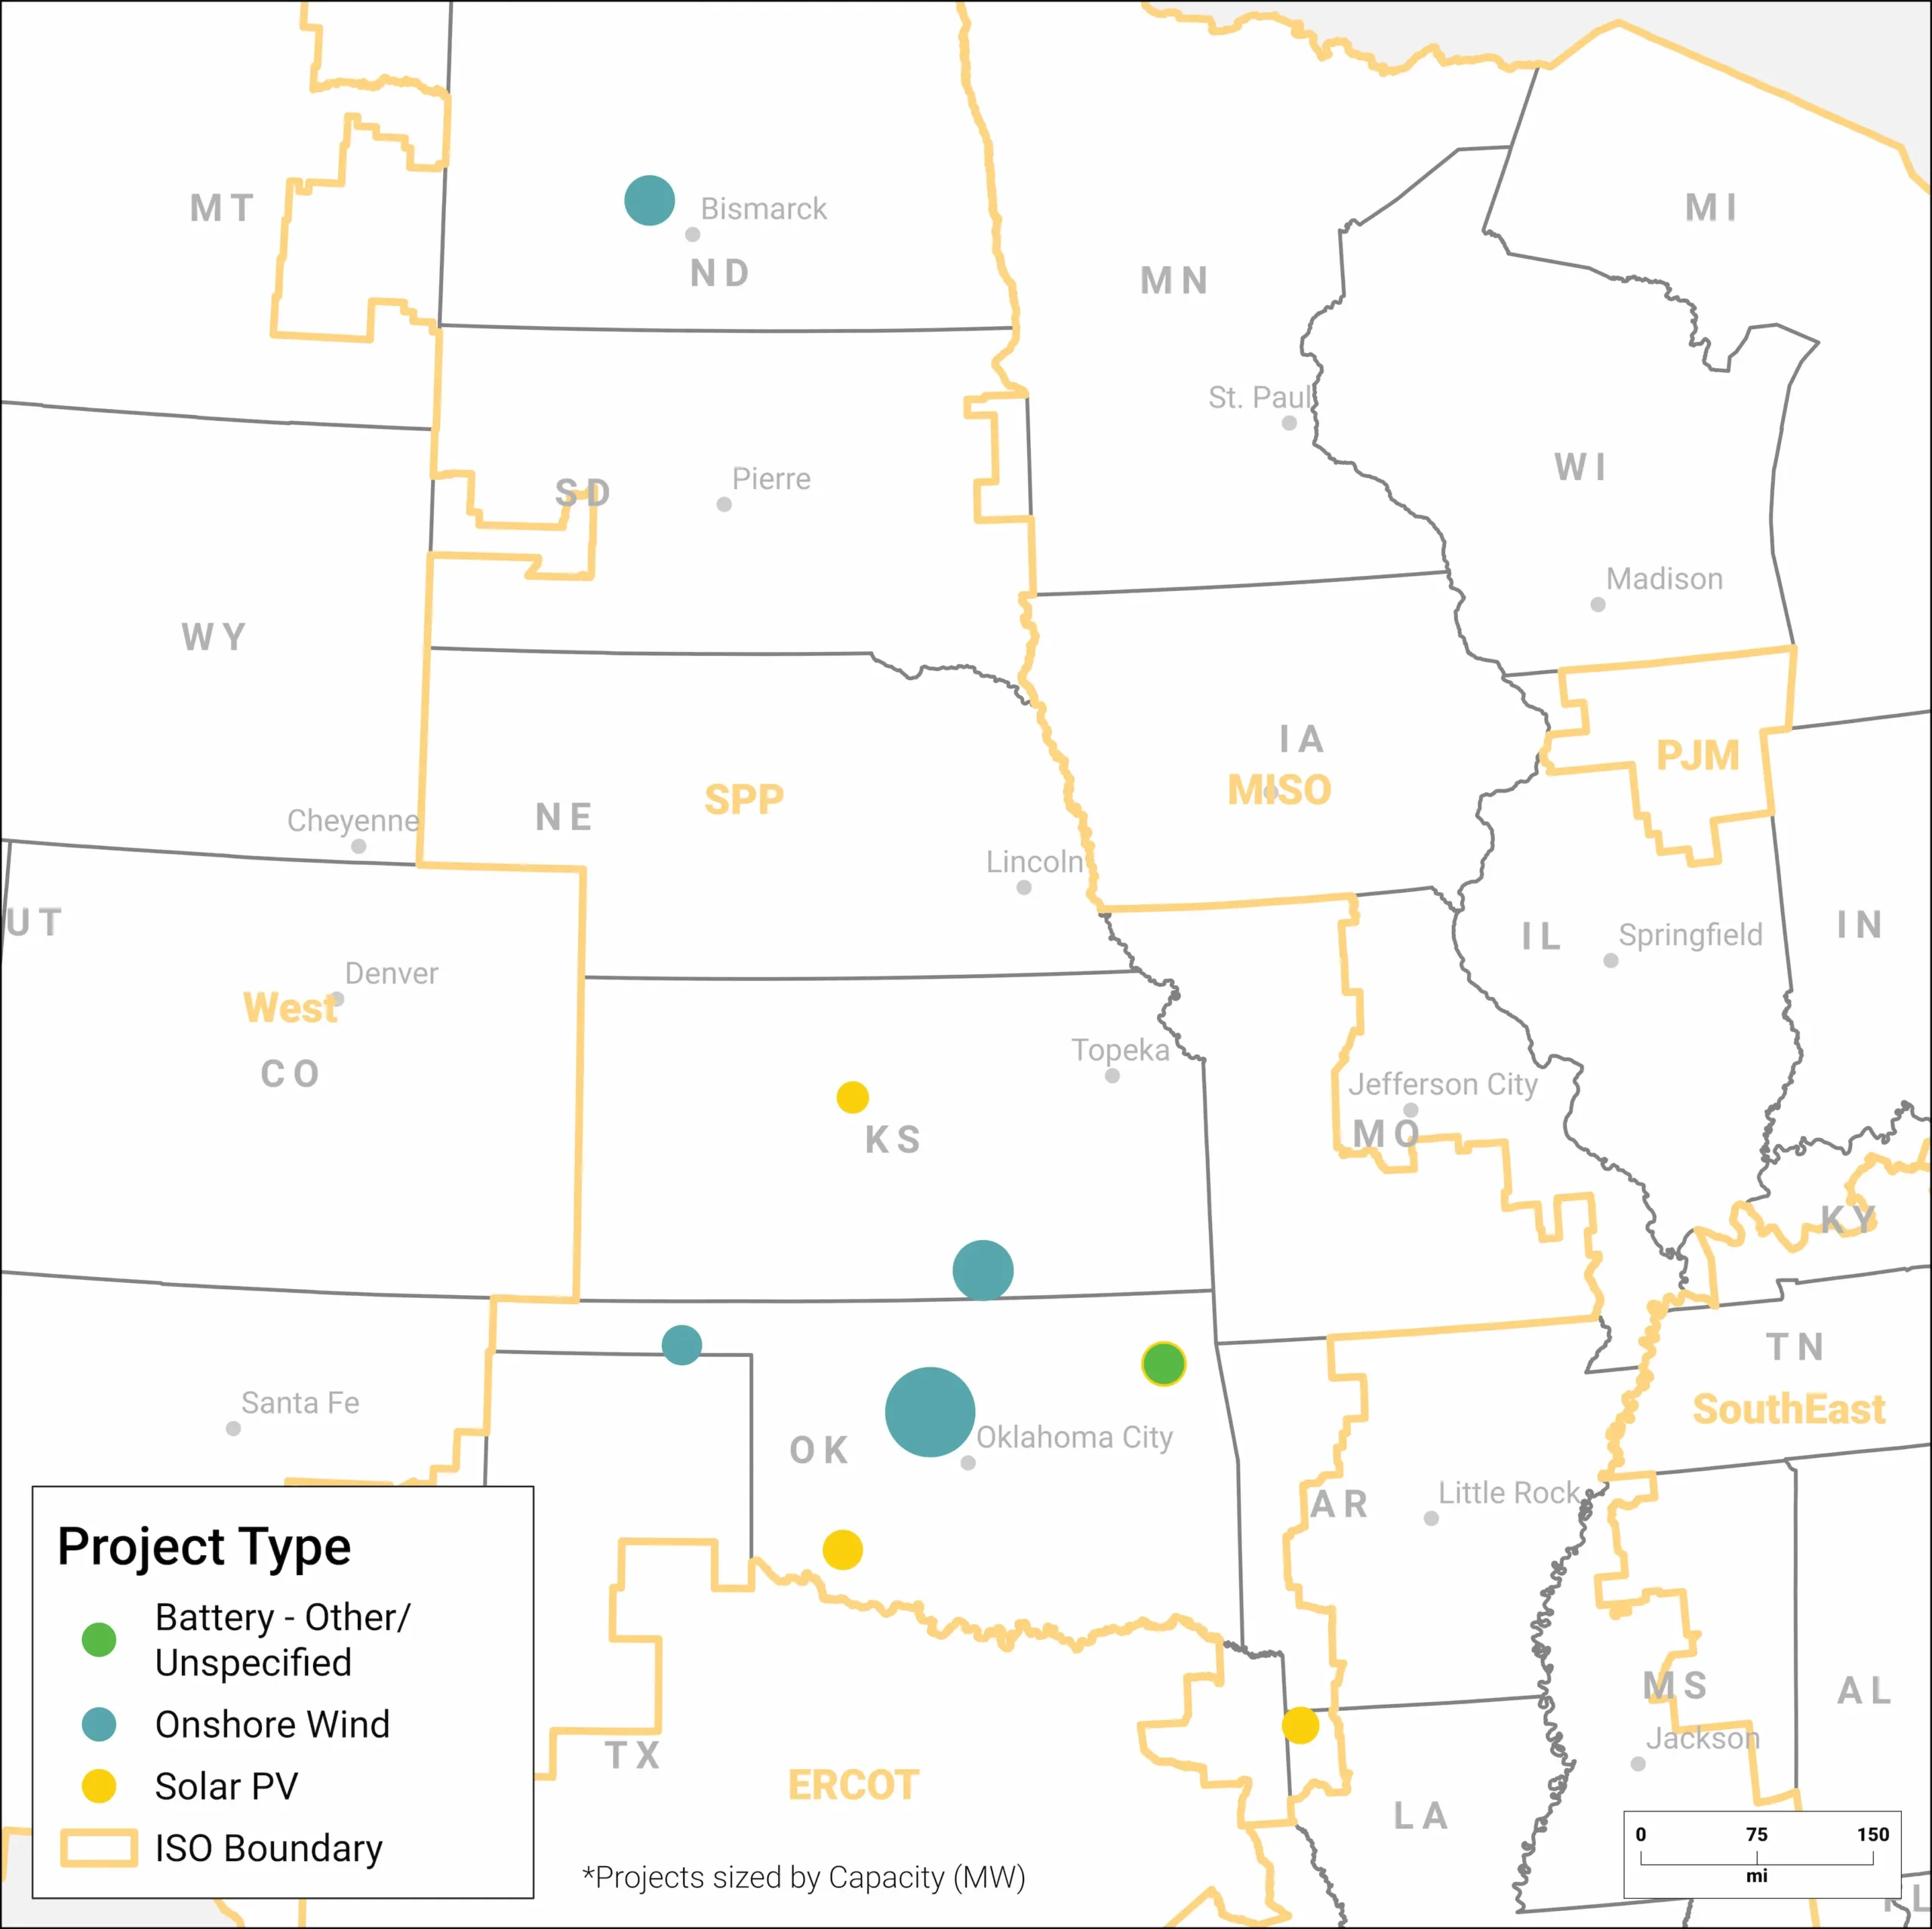
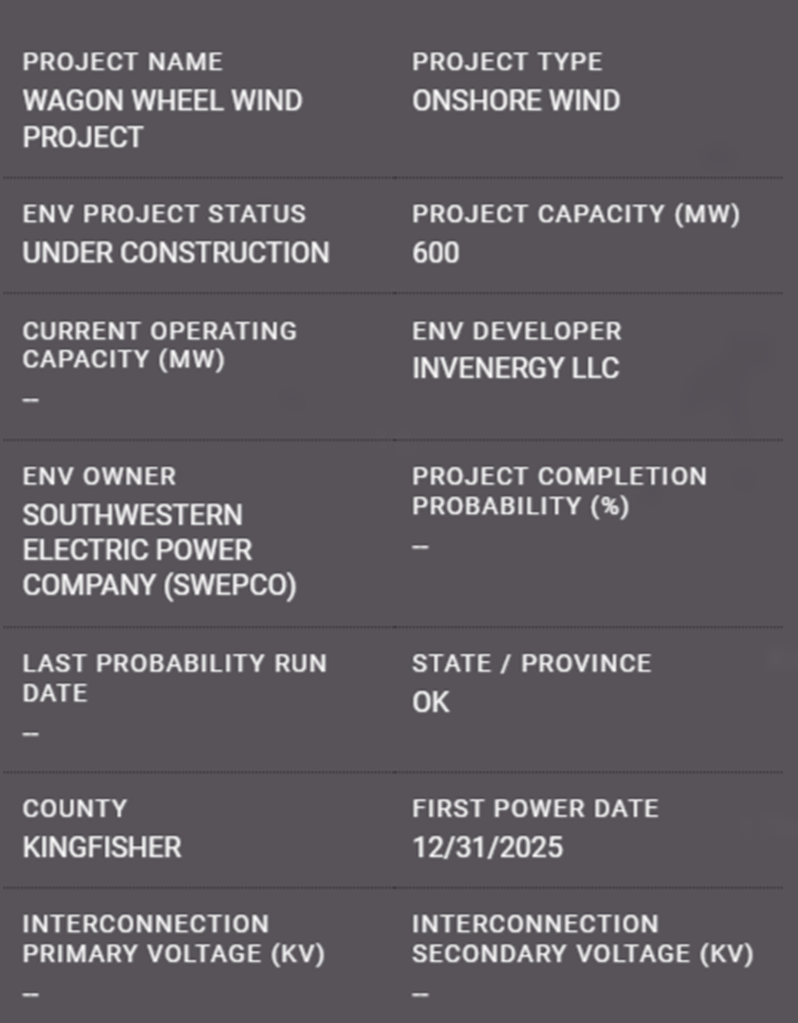
| Solar | 5.2 GW | 4.41 GW | 18.1 GW |
| Wind | 2.9 GW | 0.62 GW | 9.49 GW |
| Storage | 3 GW | 0.0 GW | 9.43 GW |
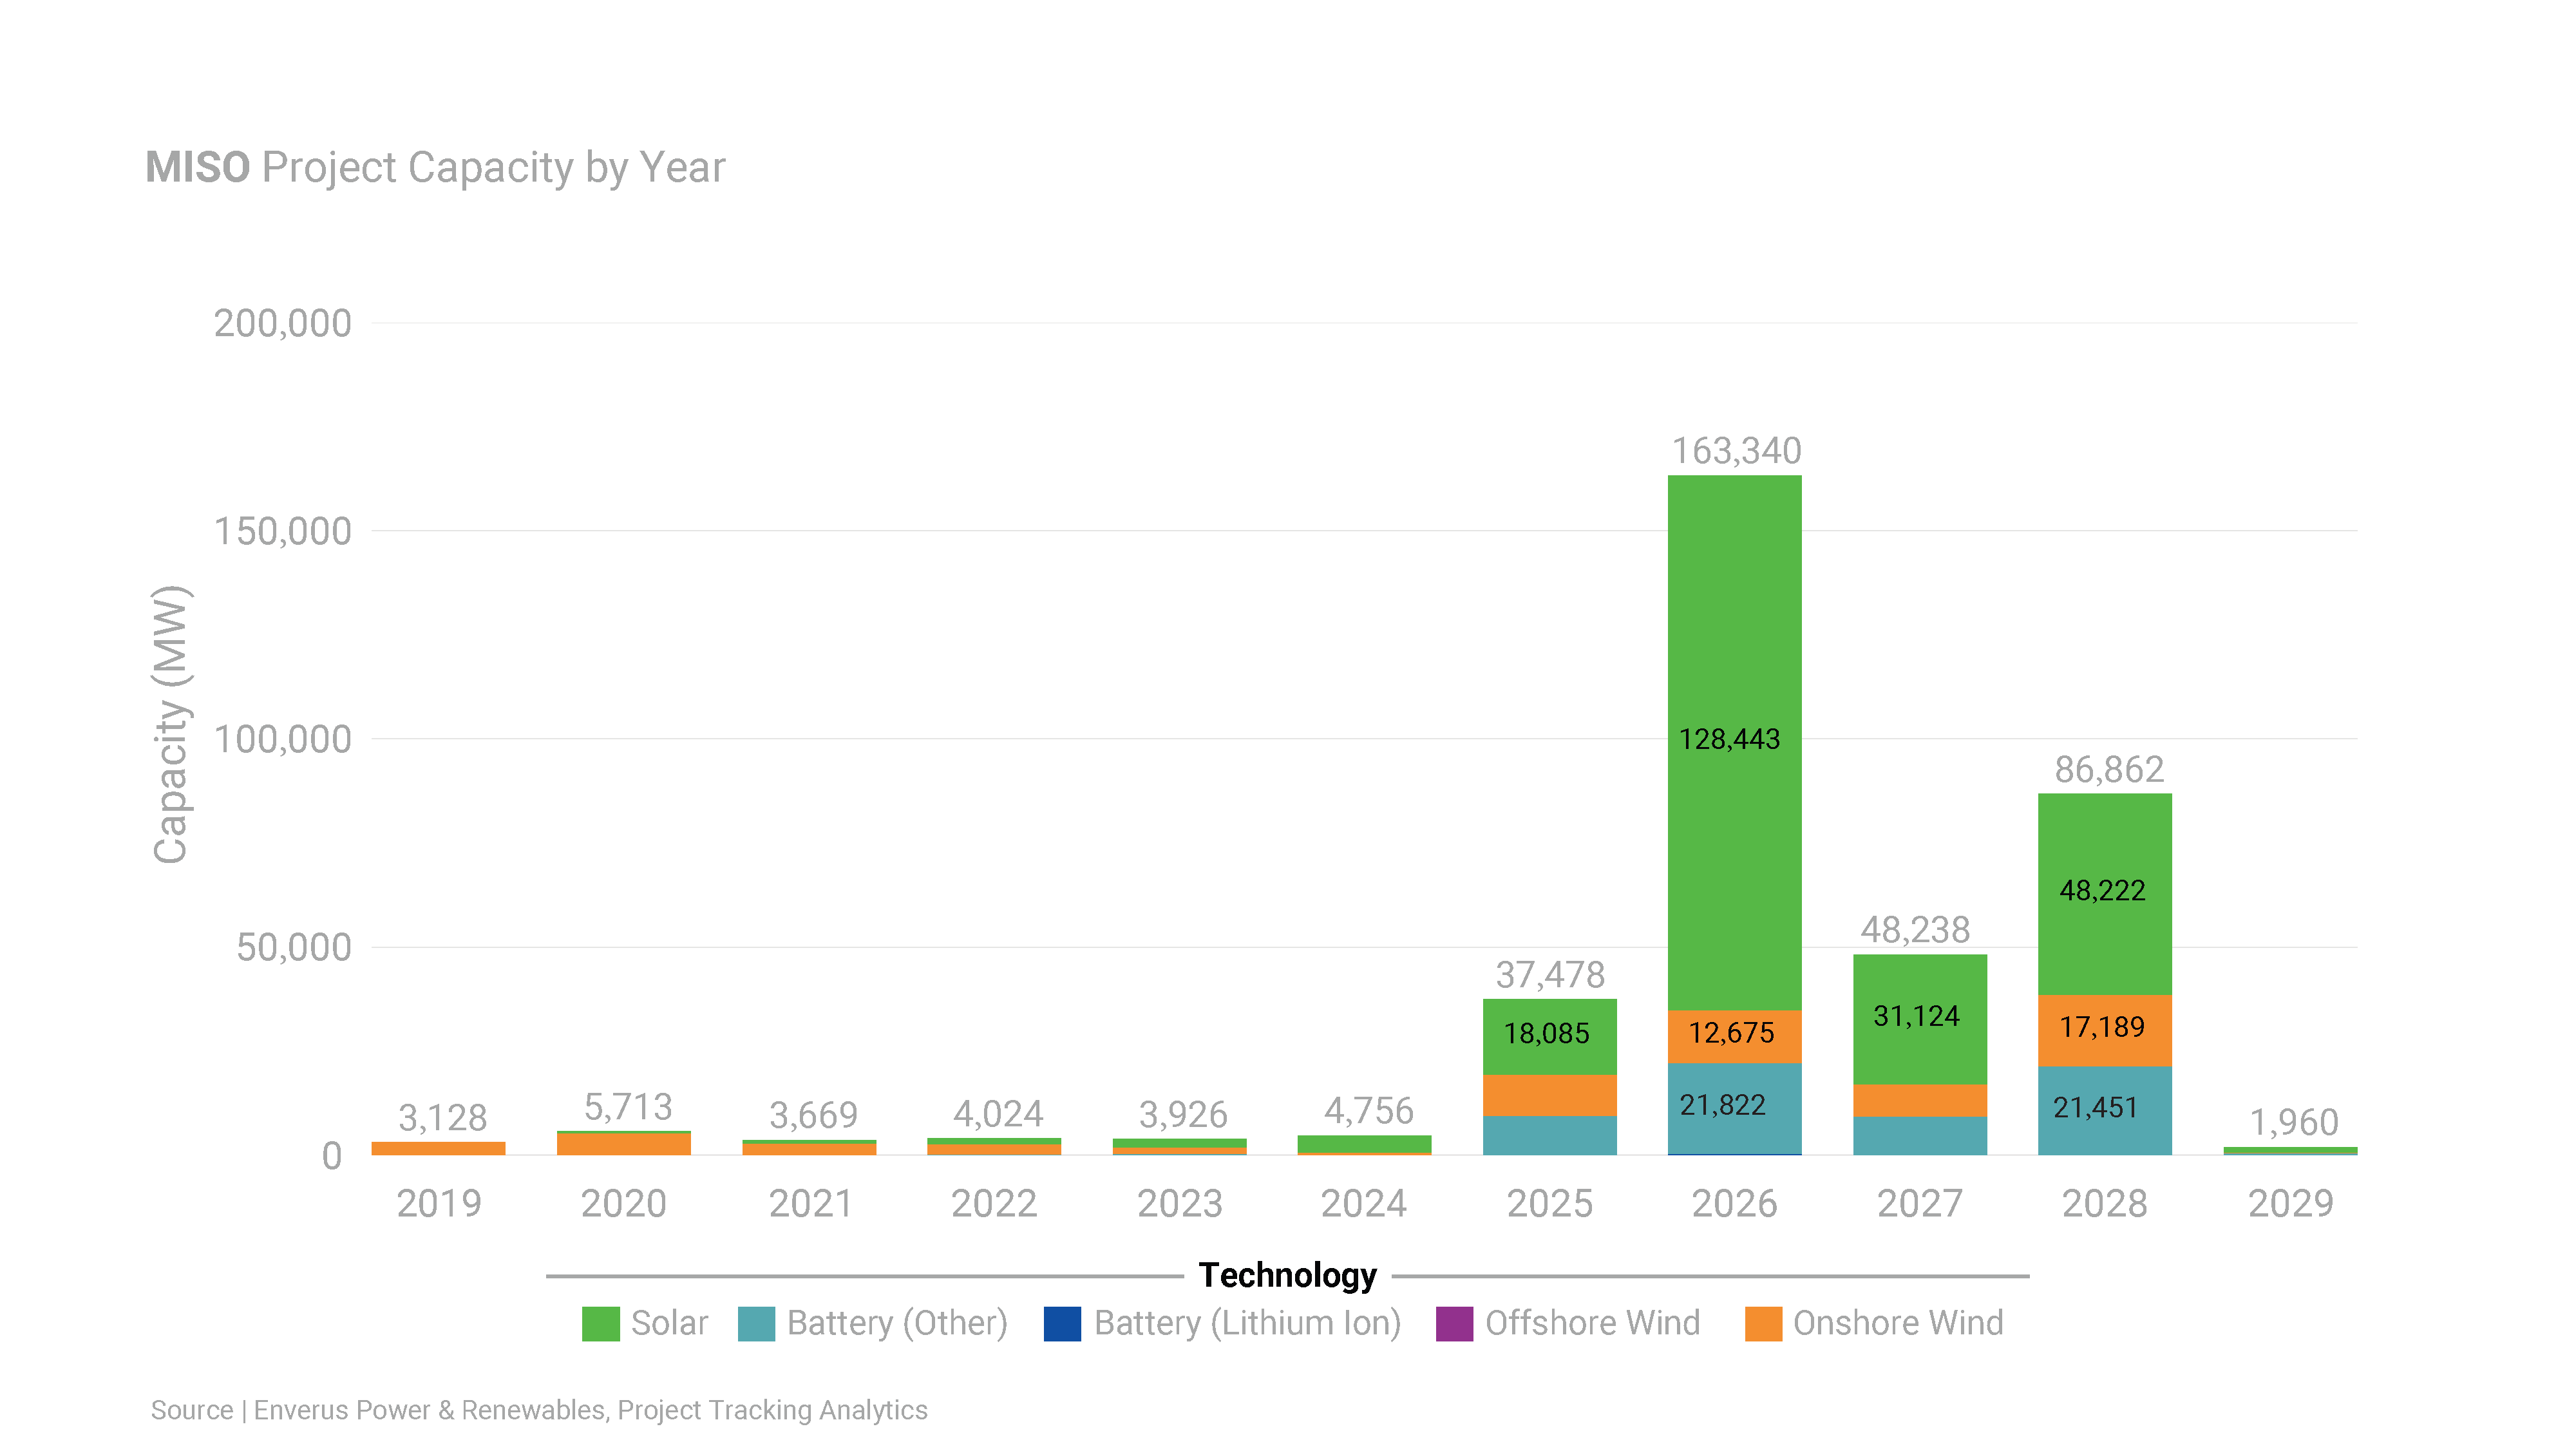
As of January 1, 2025
As of January 1, 2025
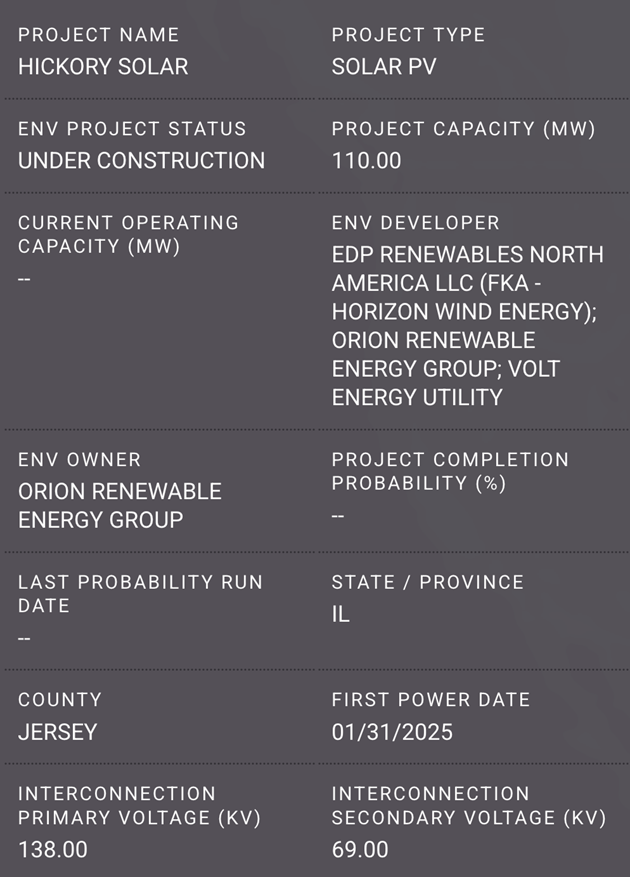
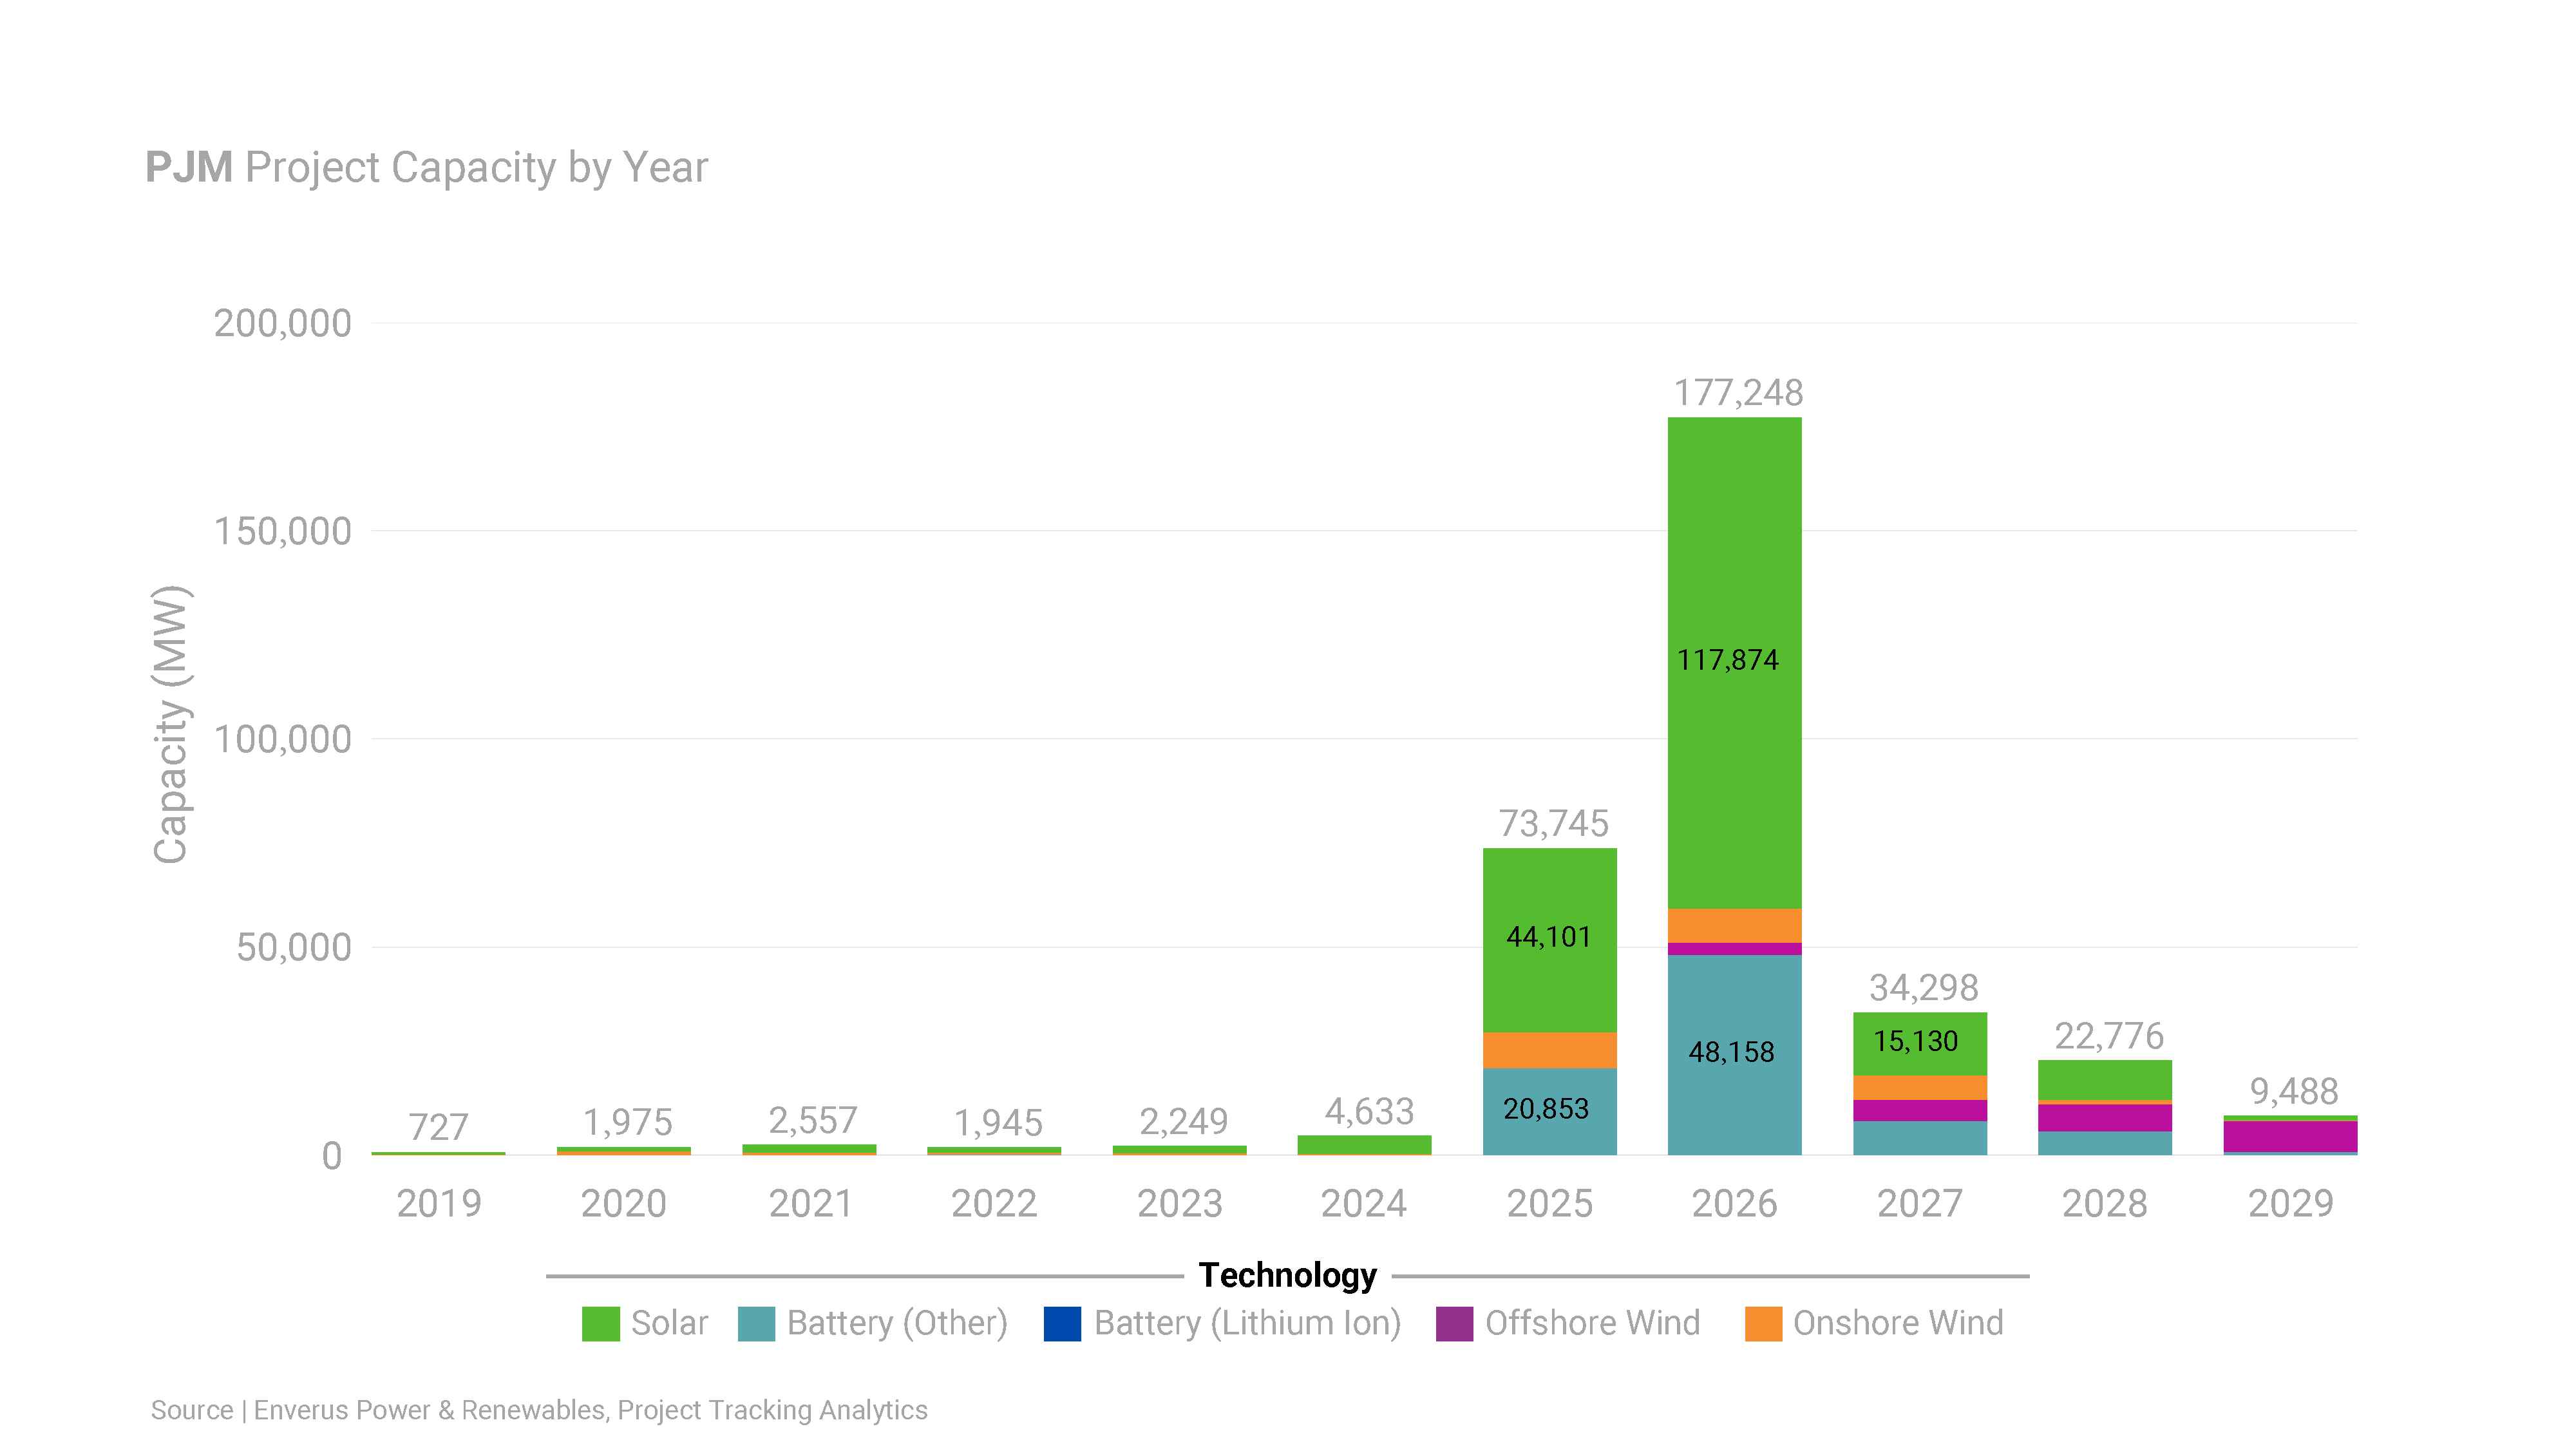
ISO Overview
| Type | 2024 Planned Capacity | 2024 New Capacity | 2025 Planned Capacity |
|---|---|---|---|
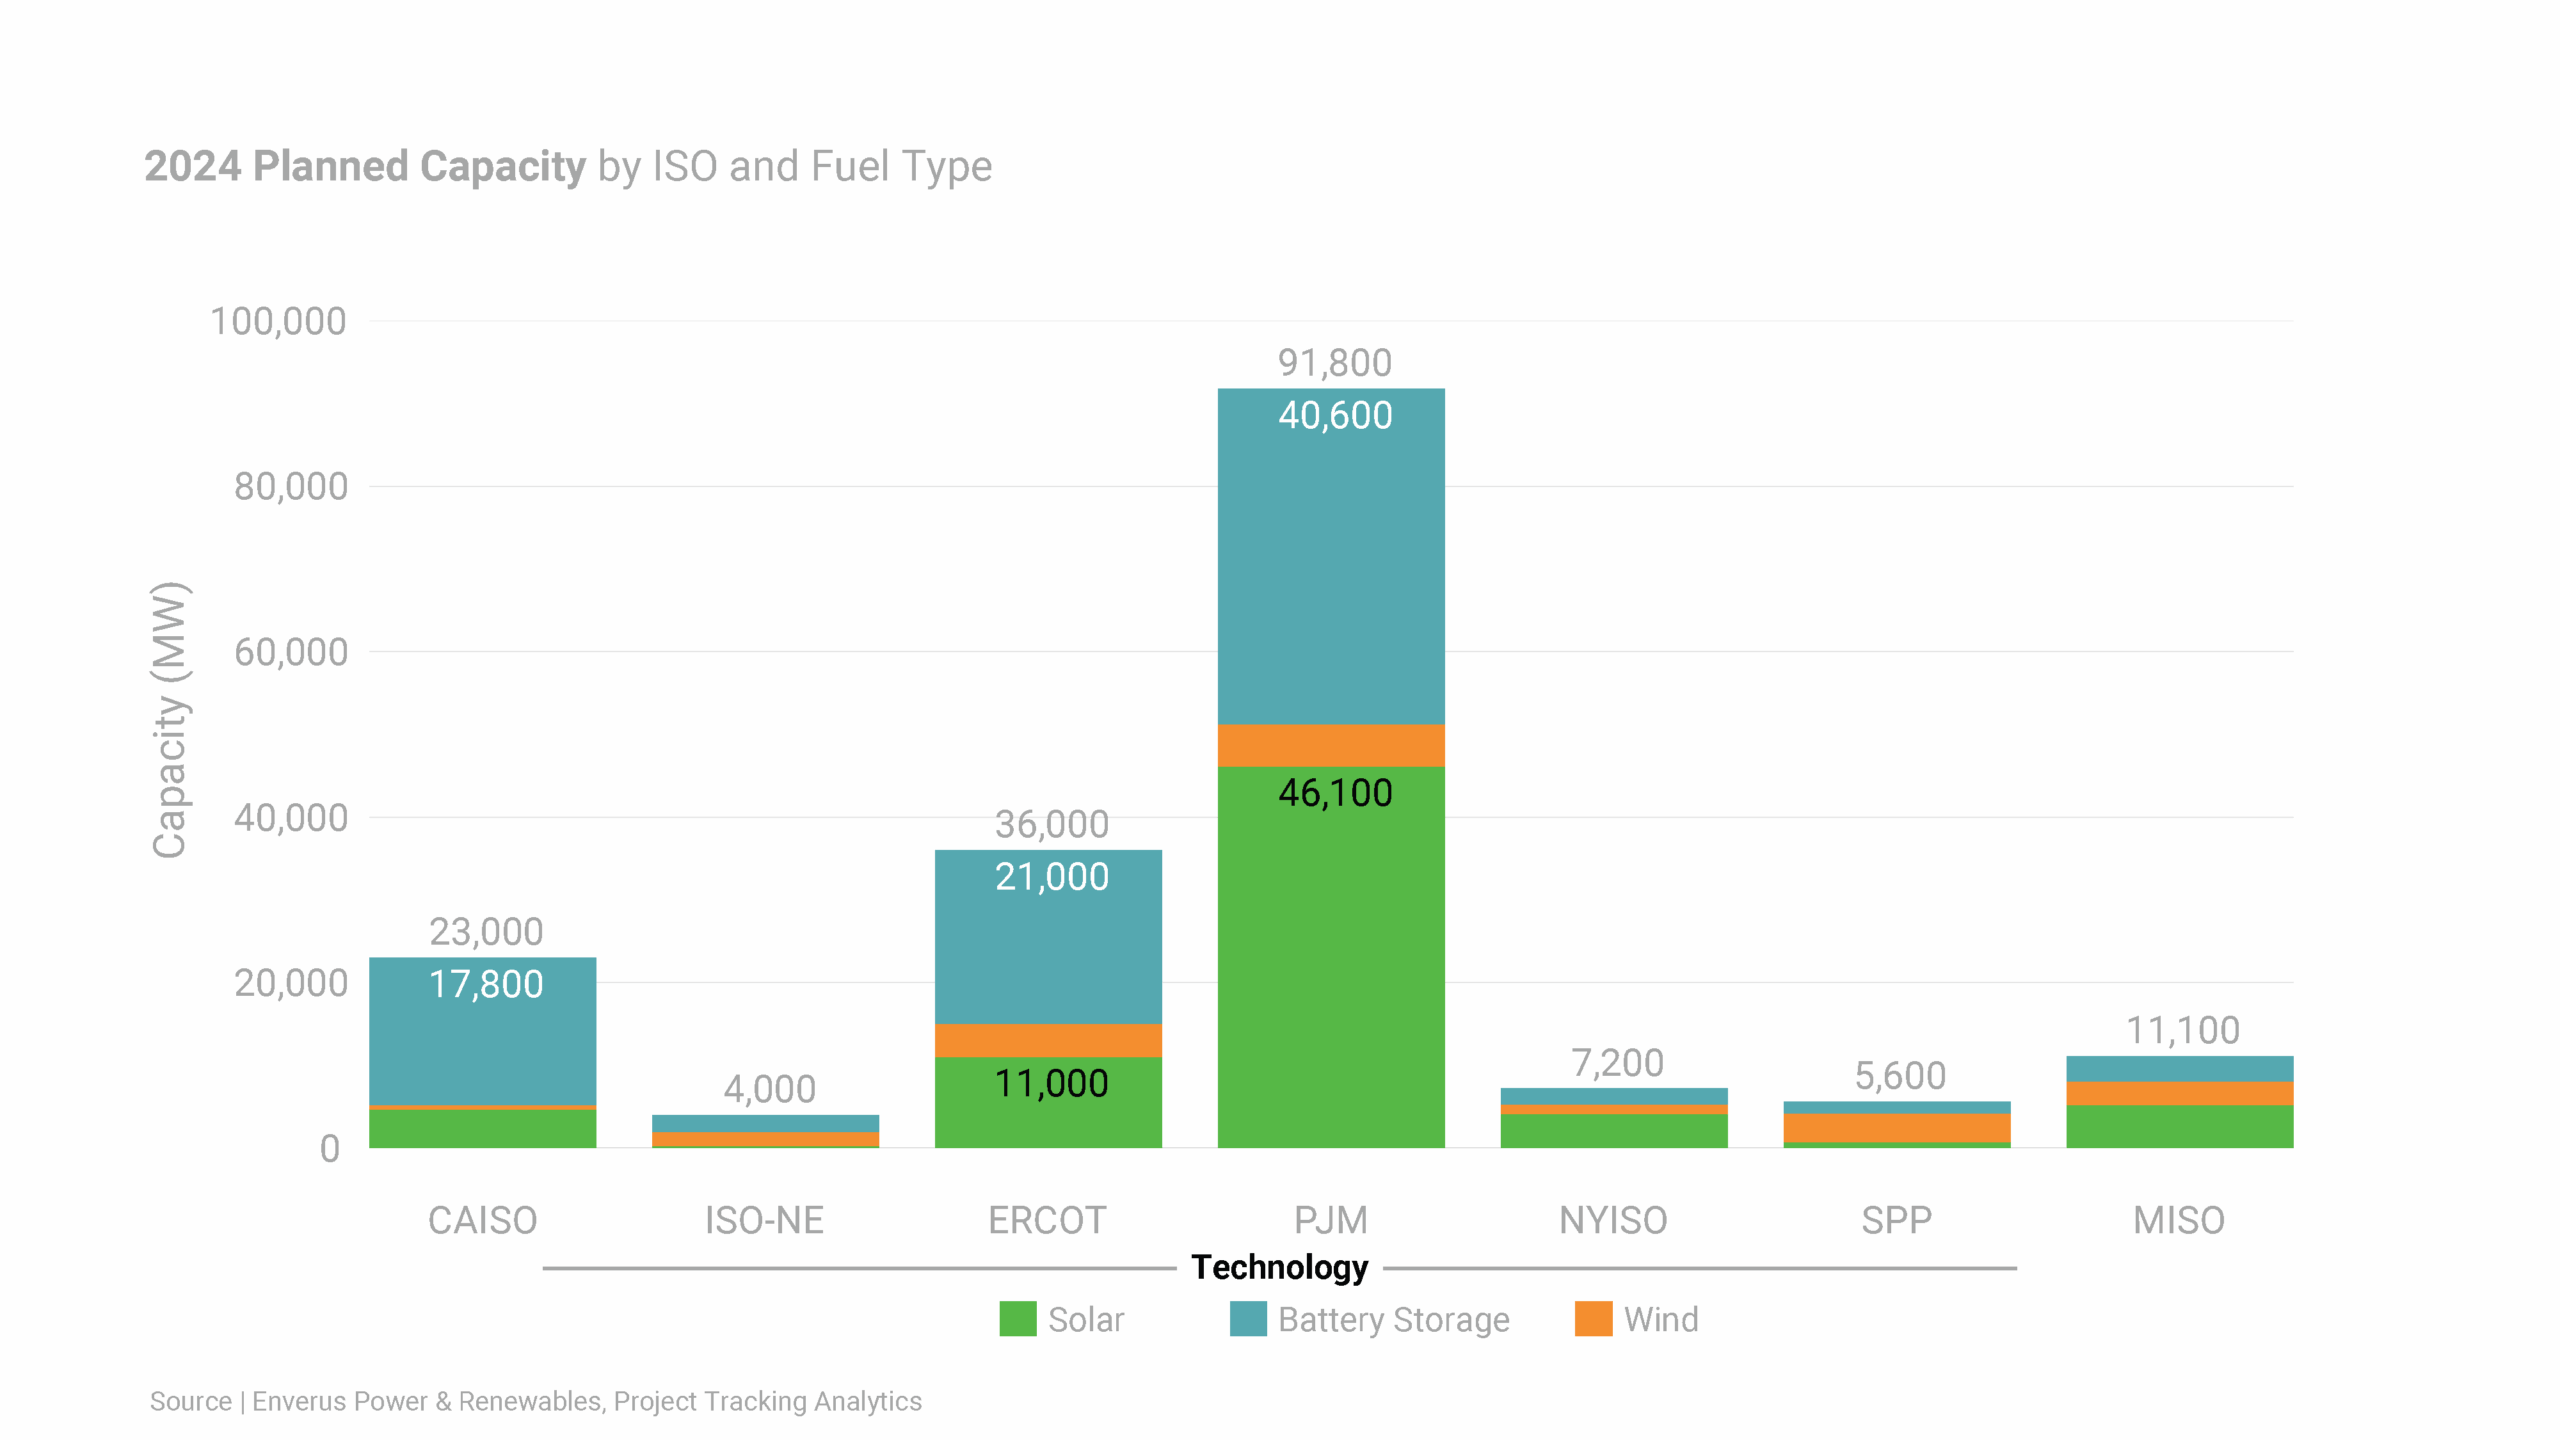
| Solar | 46.1 GW | 4.27 GW | 44.1 GW |
| Wind | 5.1 GW | 0.262 GW | 8.74 GW |
| Storage | 40.6 GW | 0.09 GW | 20.9 GW |
As of January 1, 2025
As of January 1, 2025
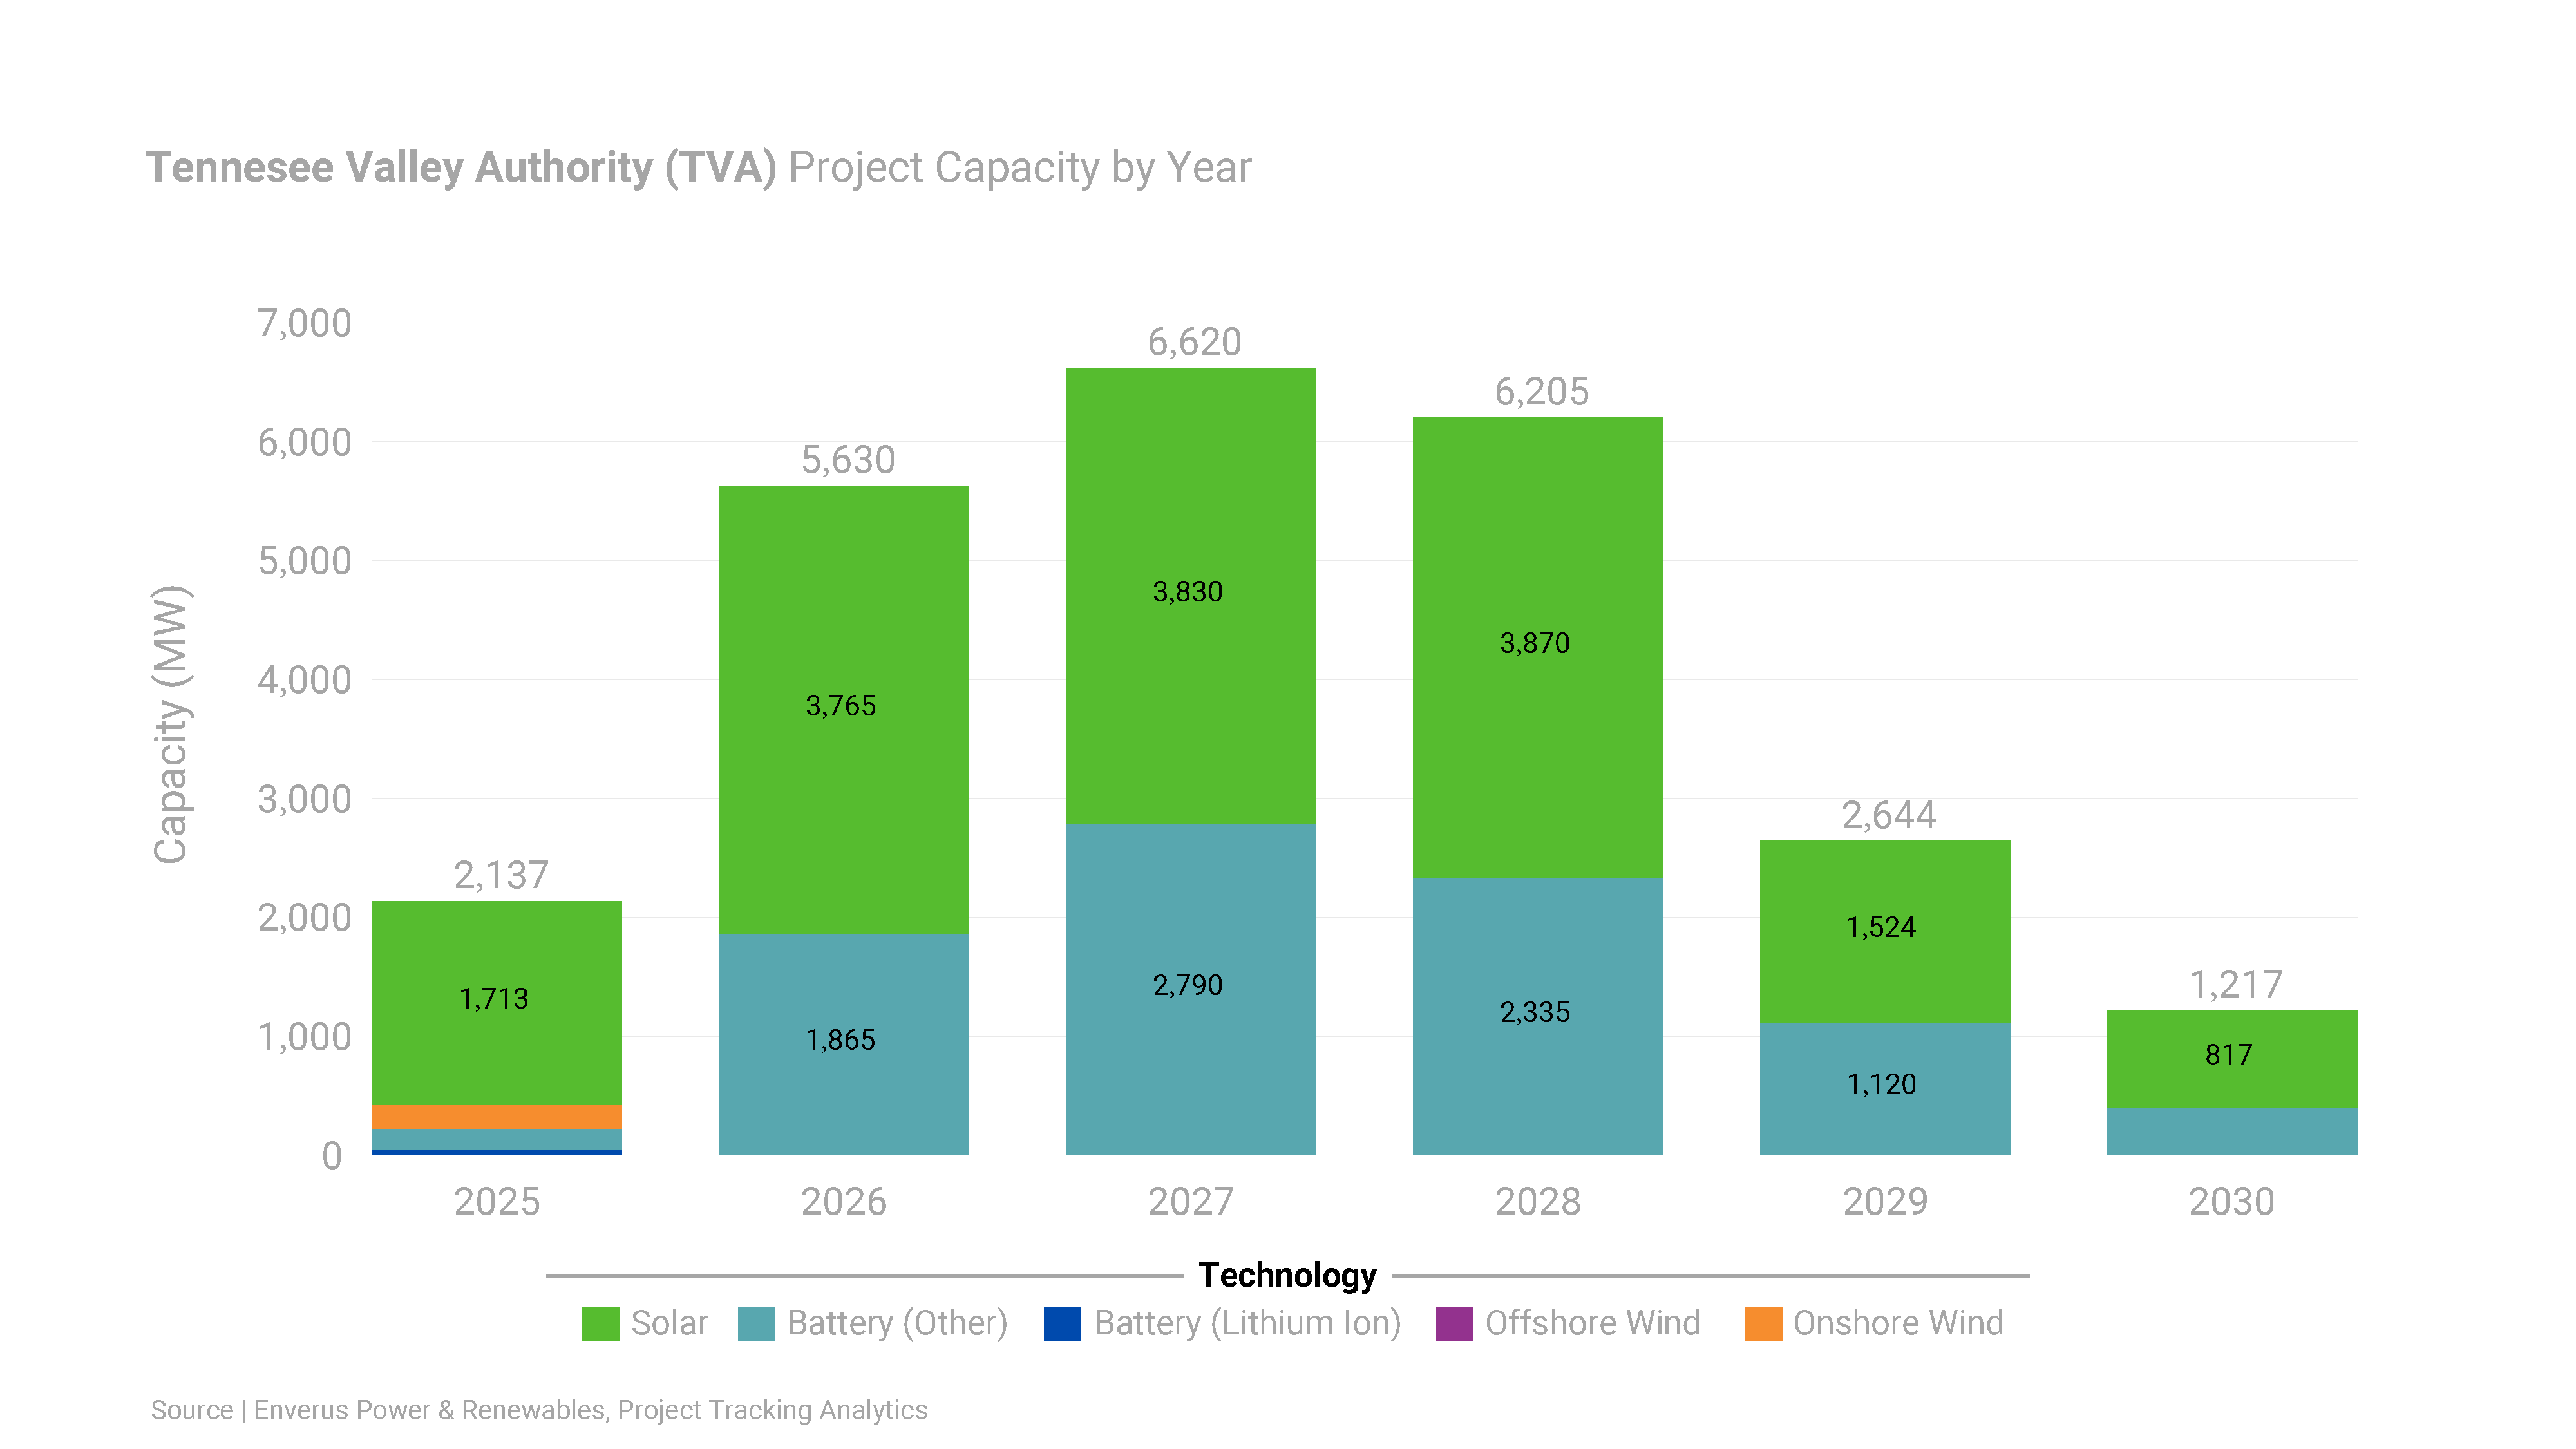
ISO Overview
| Type | 2024 Planned Capacity | 2024 New Capacity | 2025 Planned Capacity |
|---|---|---|---|
| Solar | 1.7 GW | 0.33 GW | 2.17 GW |
| Wind | 3.5 GW | 0.40 GW | 4.73 GW |
| Storage | 1.4 GW | 0.0 GW | 1.76 GW |
As of January 1, 2025
As of January 1, 2025
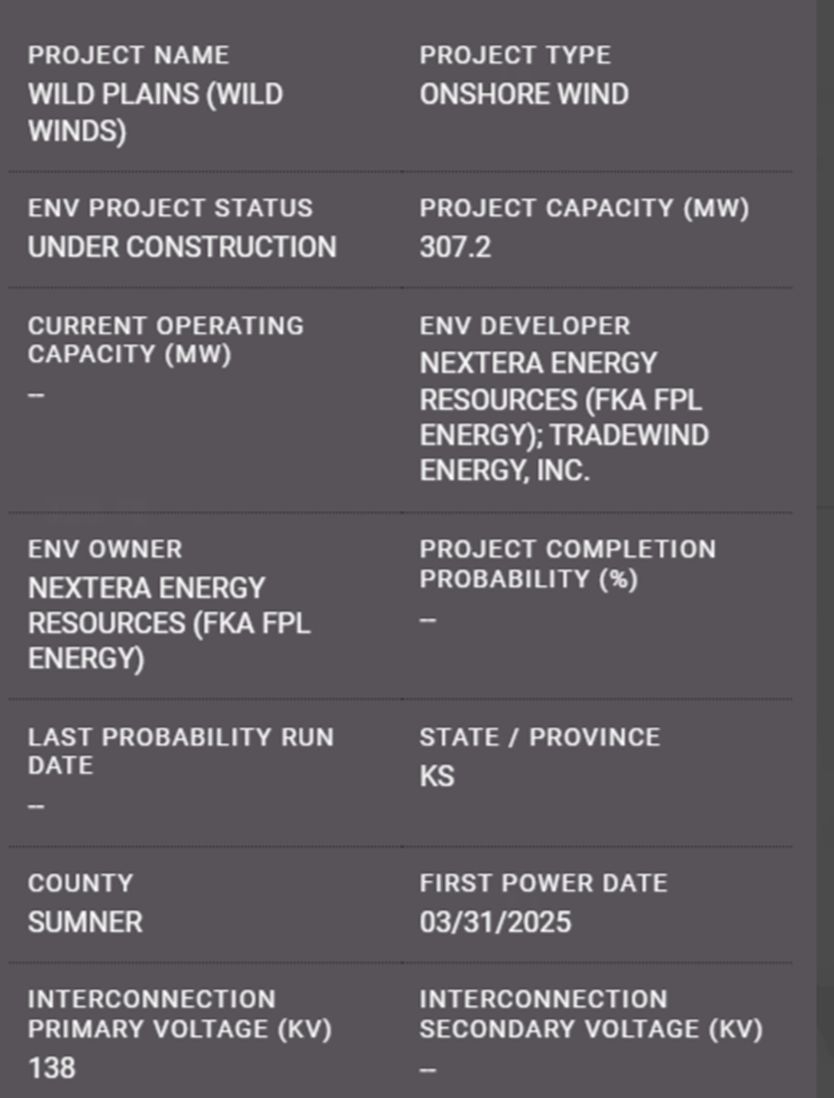
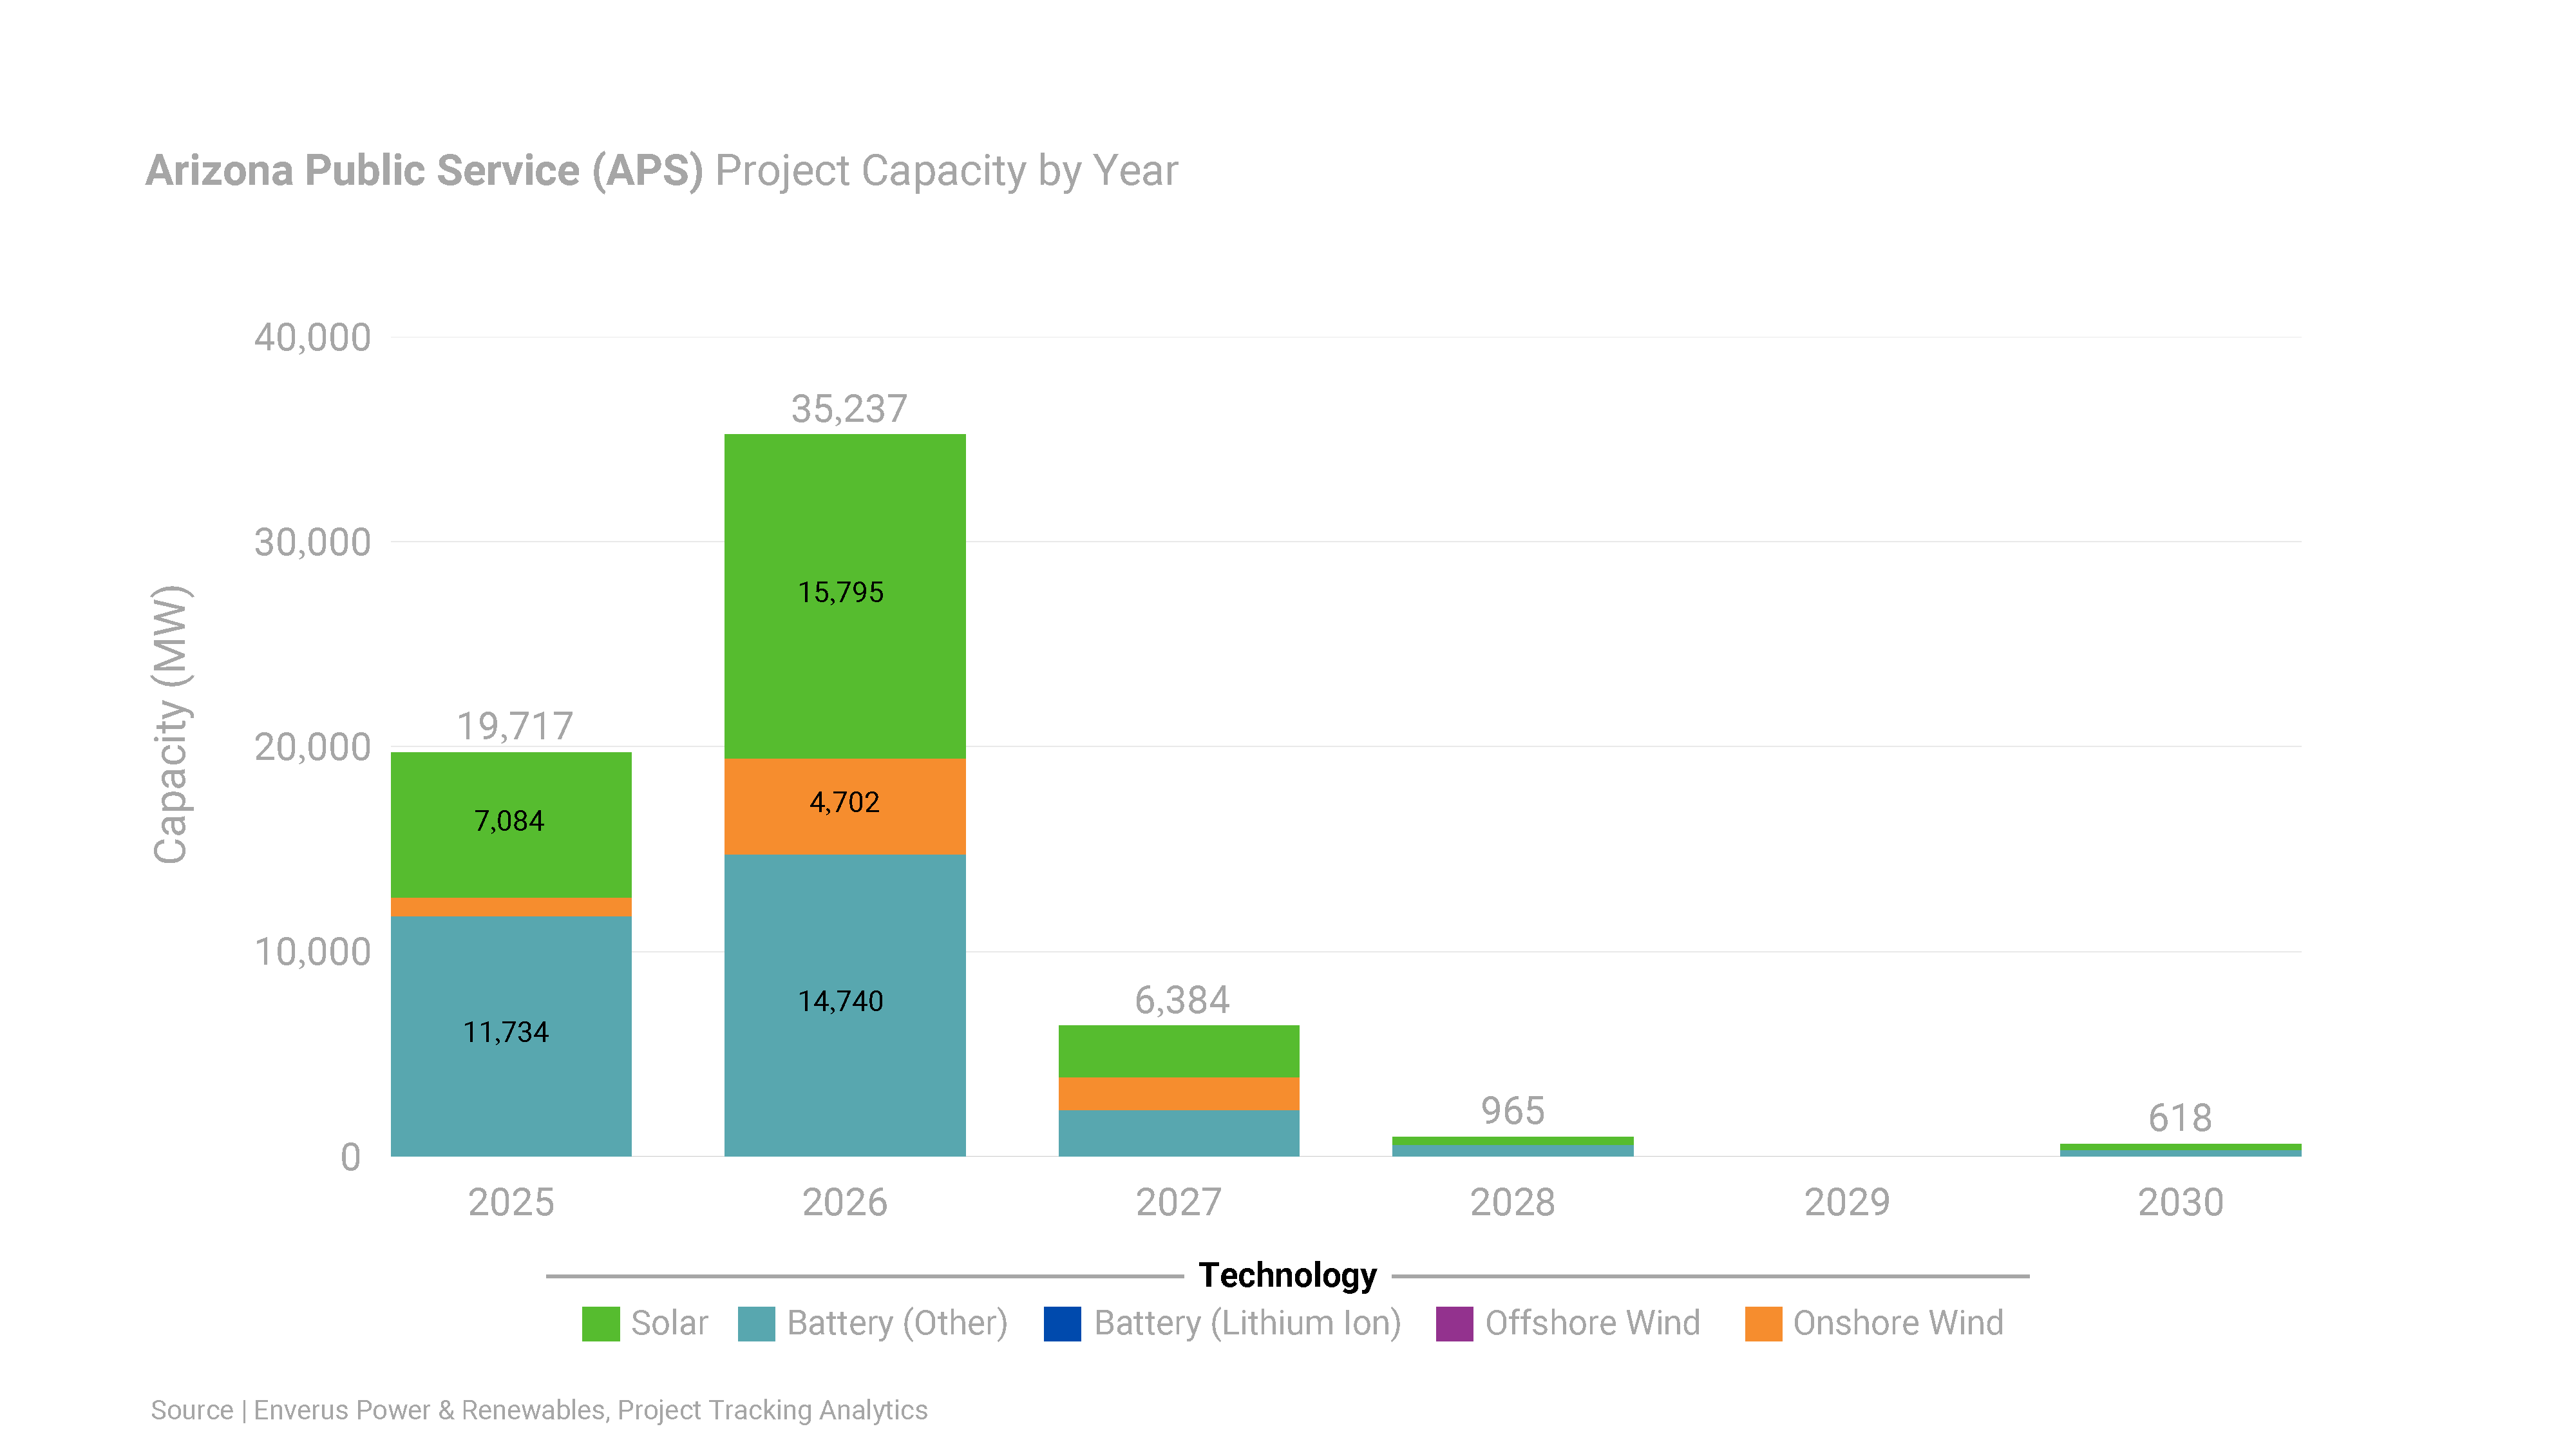
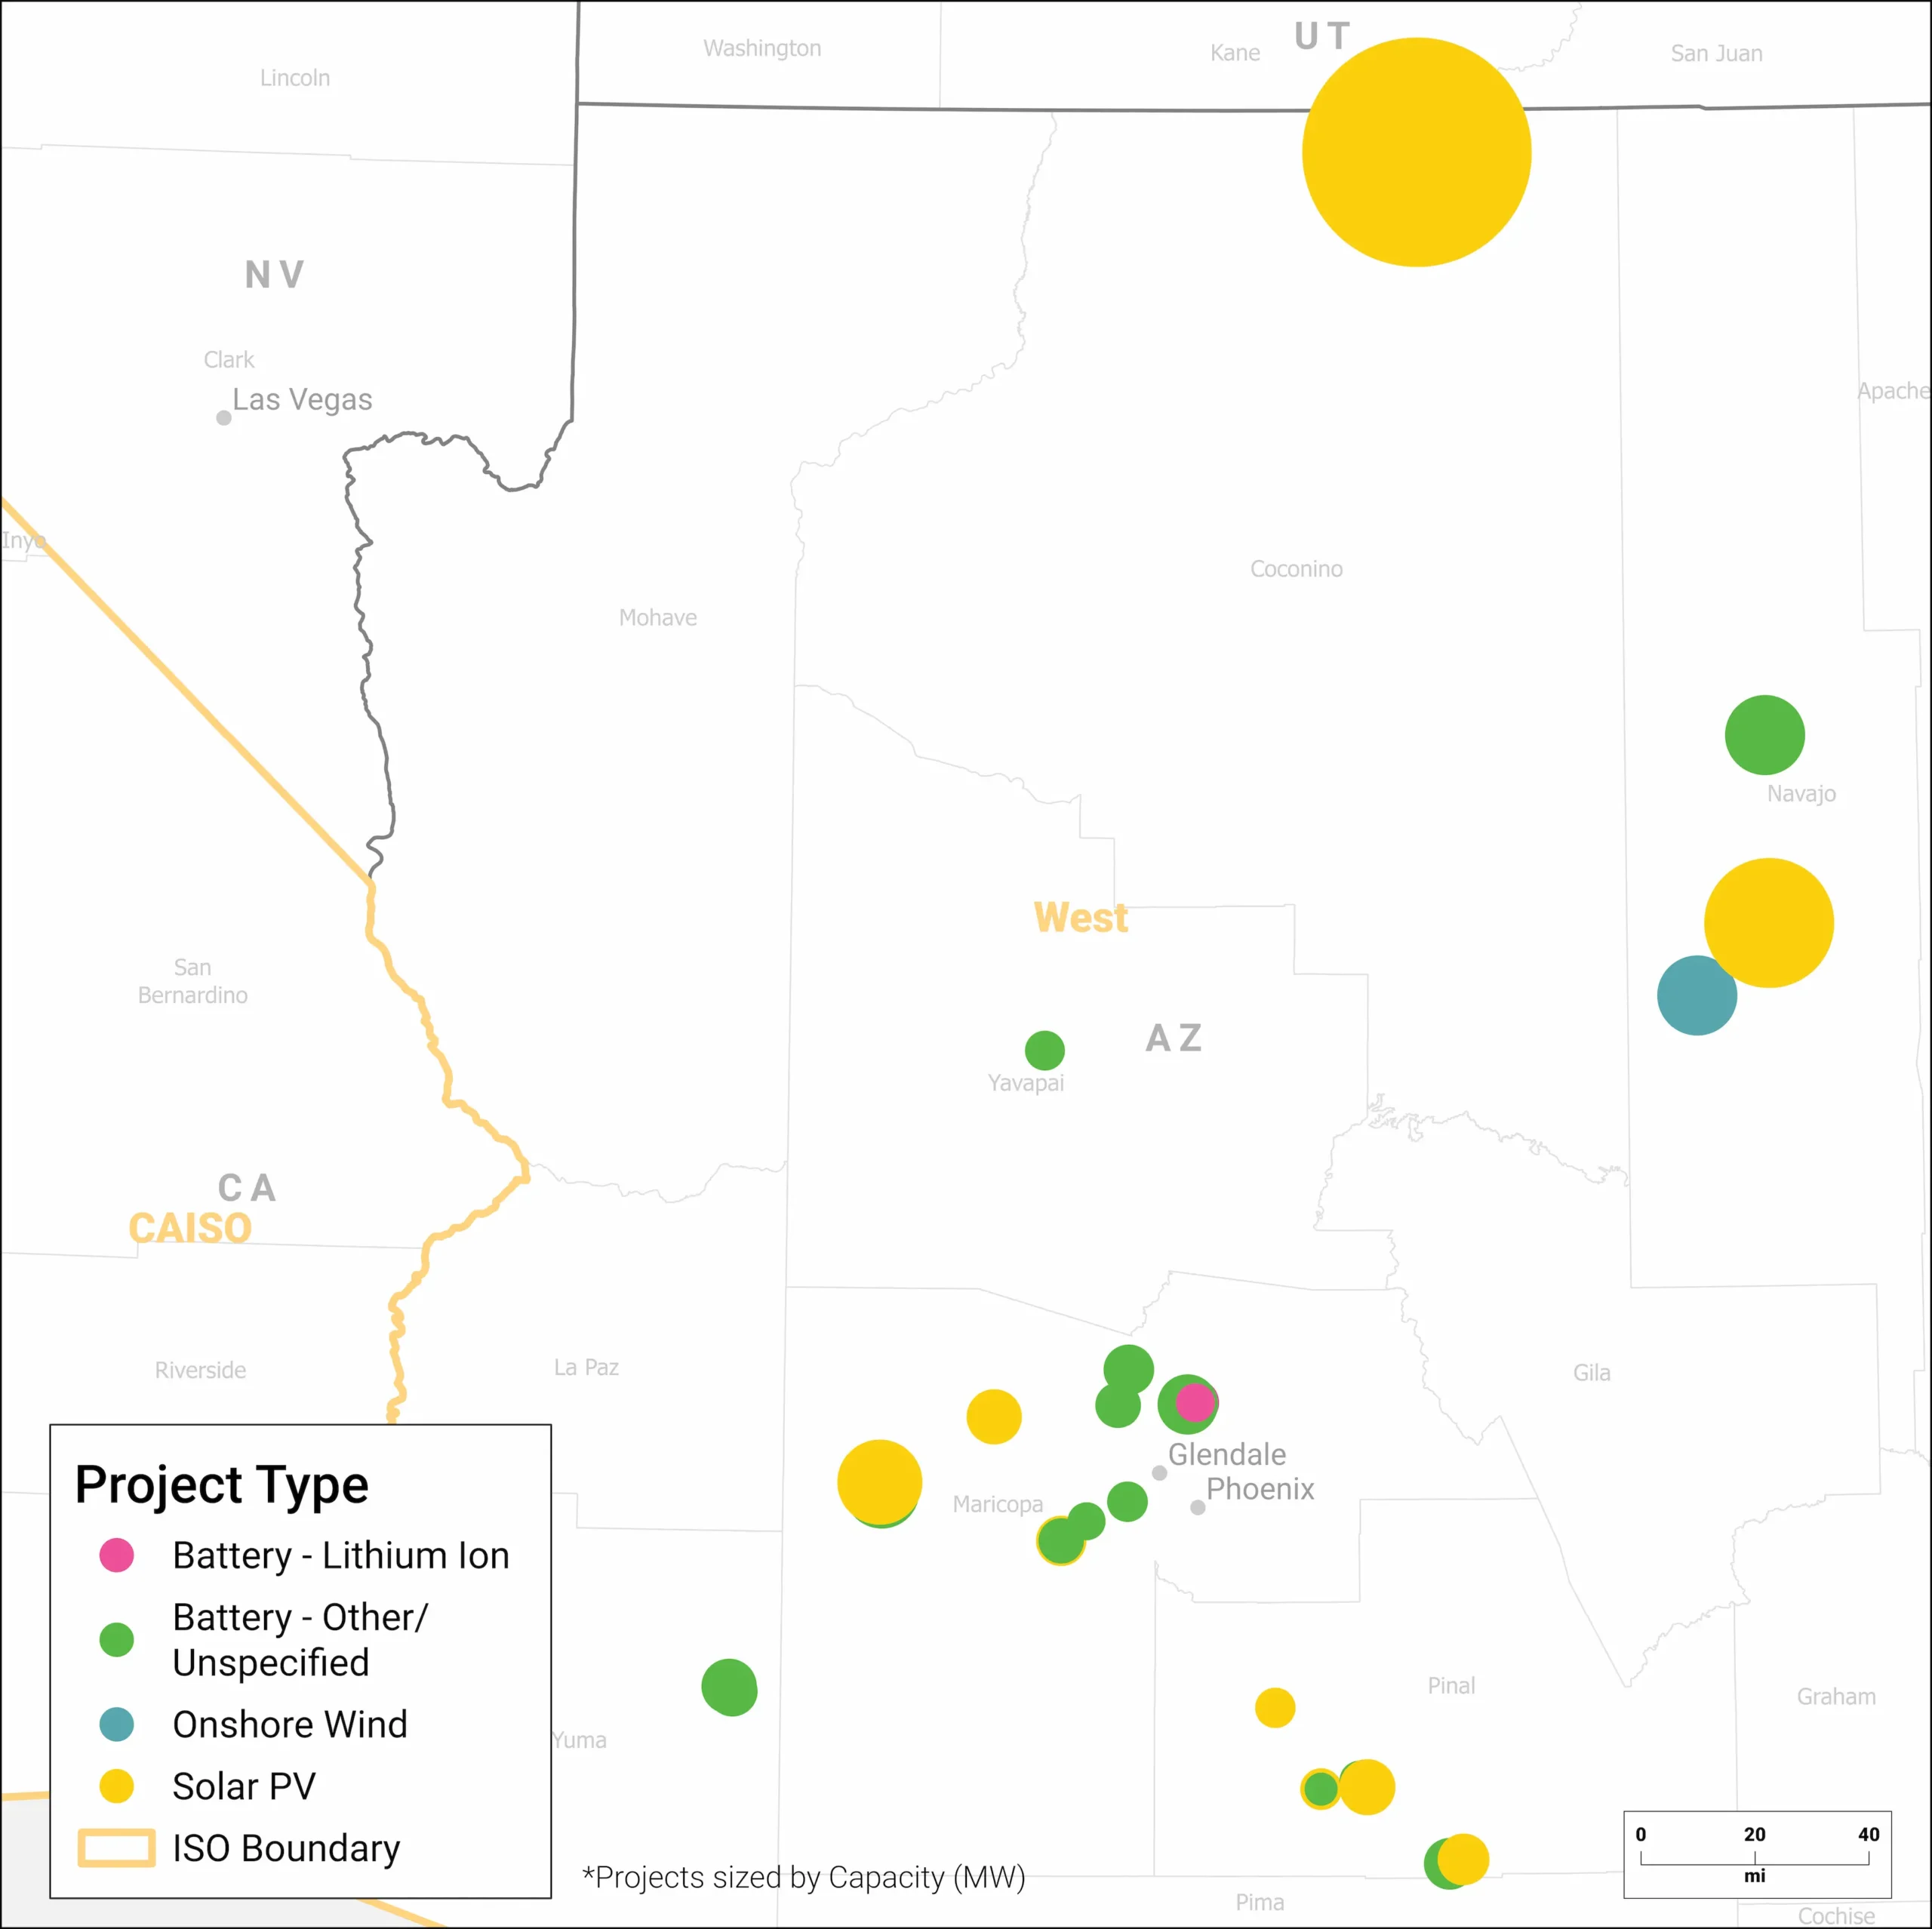
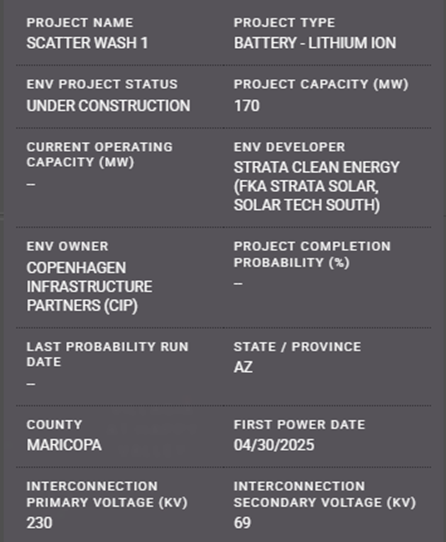
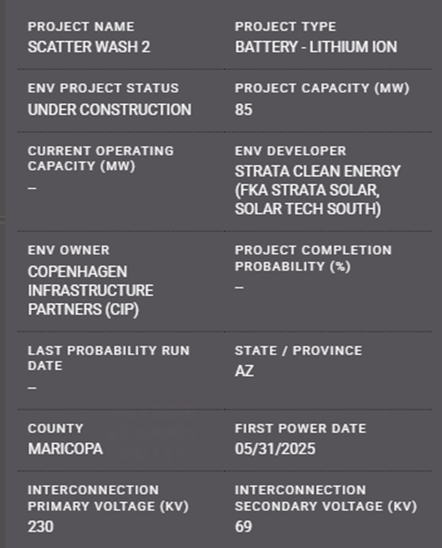
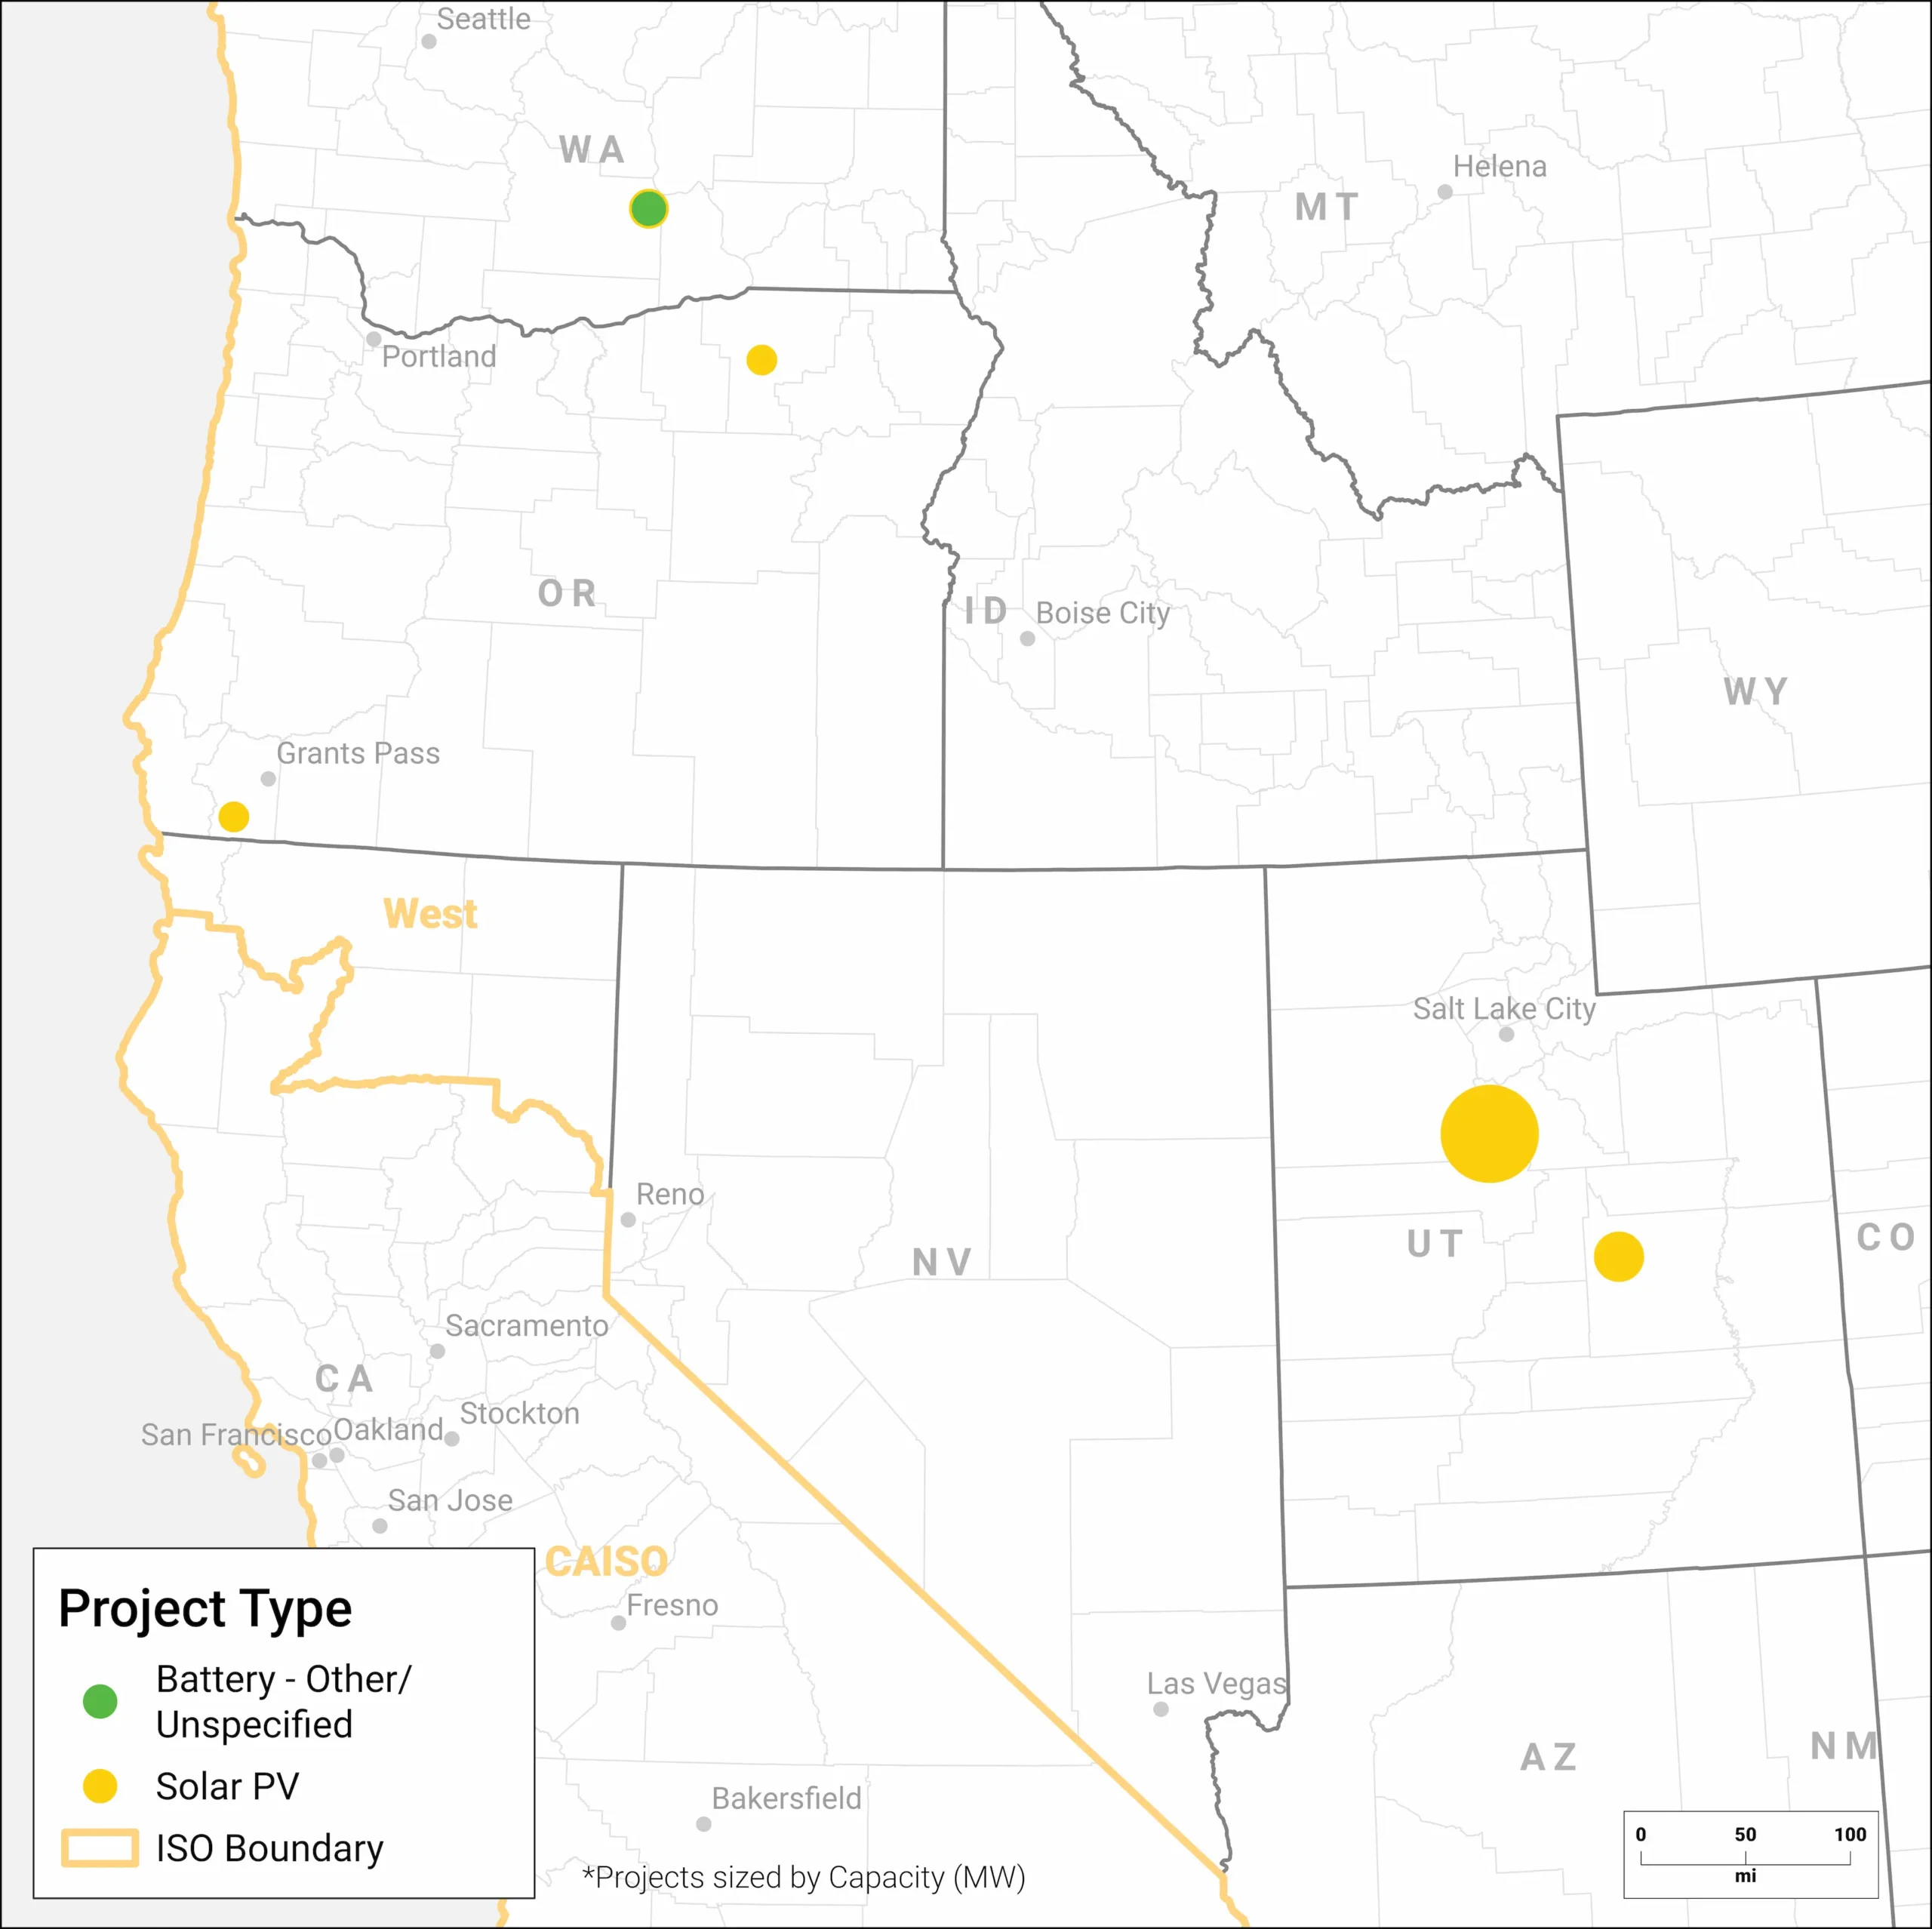
ISO Overview
| Type | 2025 Planned Capacity |
|---|---|
| Solar | 7.08 GW |
| Wind | 0.90 GW |
| Storage | 11.73 GW |
Displaying only 2025 planned capacity due to the recent integration of utility queues in PRISM, ensuring maximum accuracy.
As of January 1, 2025
As of January 1, 2025
| Type | 2025 Planned Capacity |
|---|---|
| Solar | 0.584 GW |
| Wind | 0.05 GW |
| Storage | 0.18 GW |
Displaying only 2025 planned capacity due to the recent integration of utility queues in PRISM, ensuring maximum accuracy.
As of January 1, 2025
Note on “Upcoming Projects With 2025 Operating Dates” graphs: Unlike the graphs showing projects under construction set to complete in 2025 in other regions, there are no qualifying solar, storage, or wind projects in NYISO or BPAT for 2025.
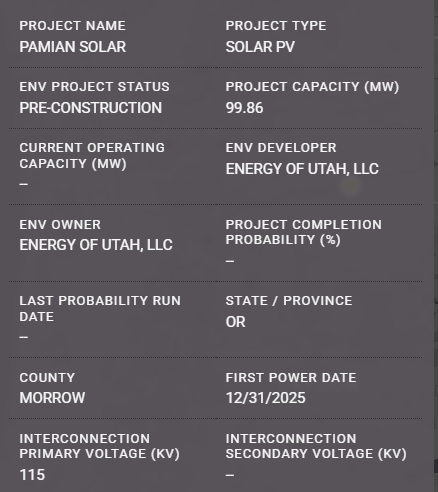
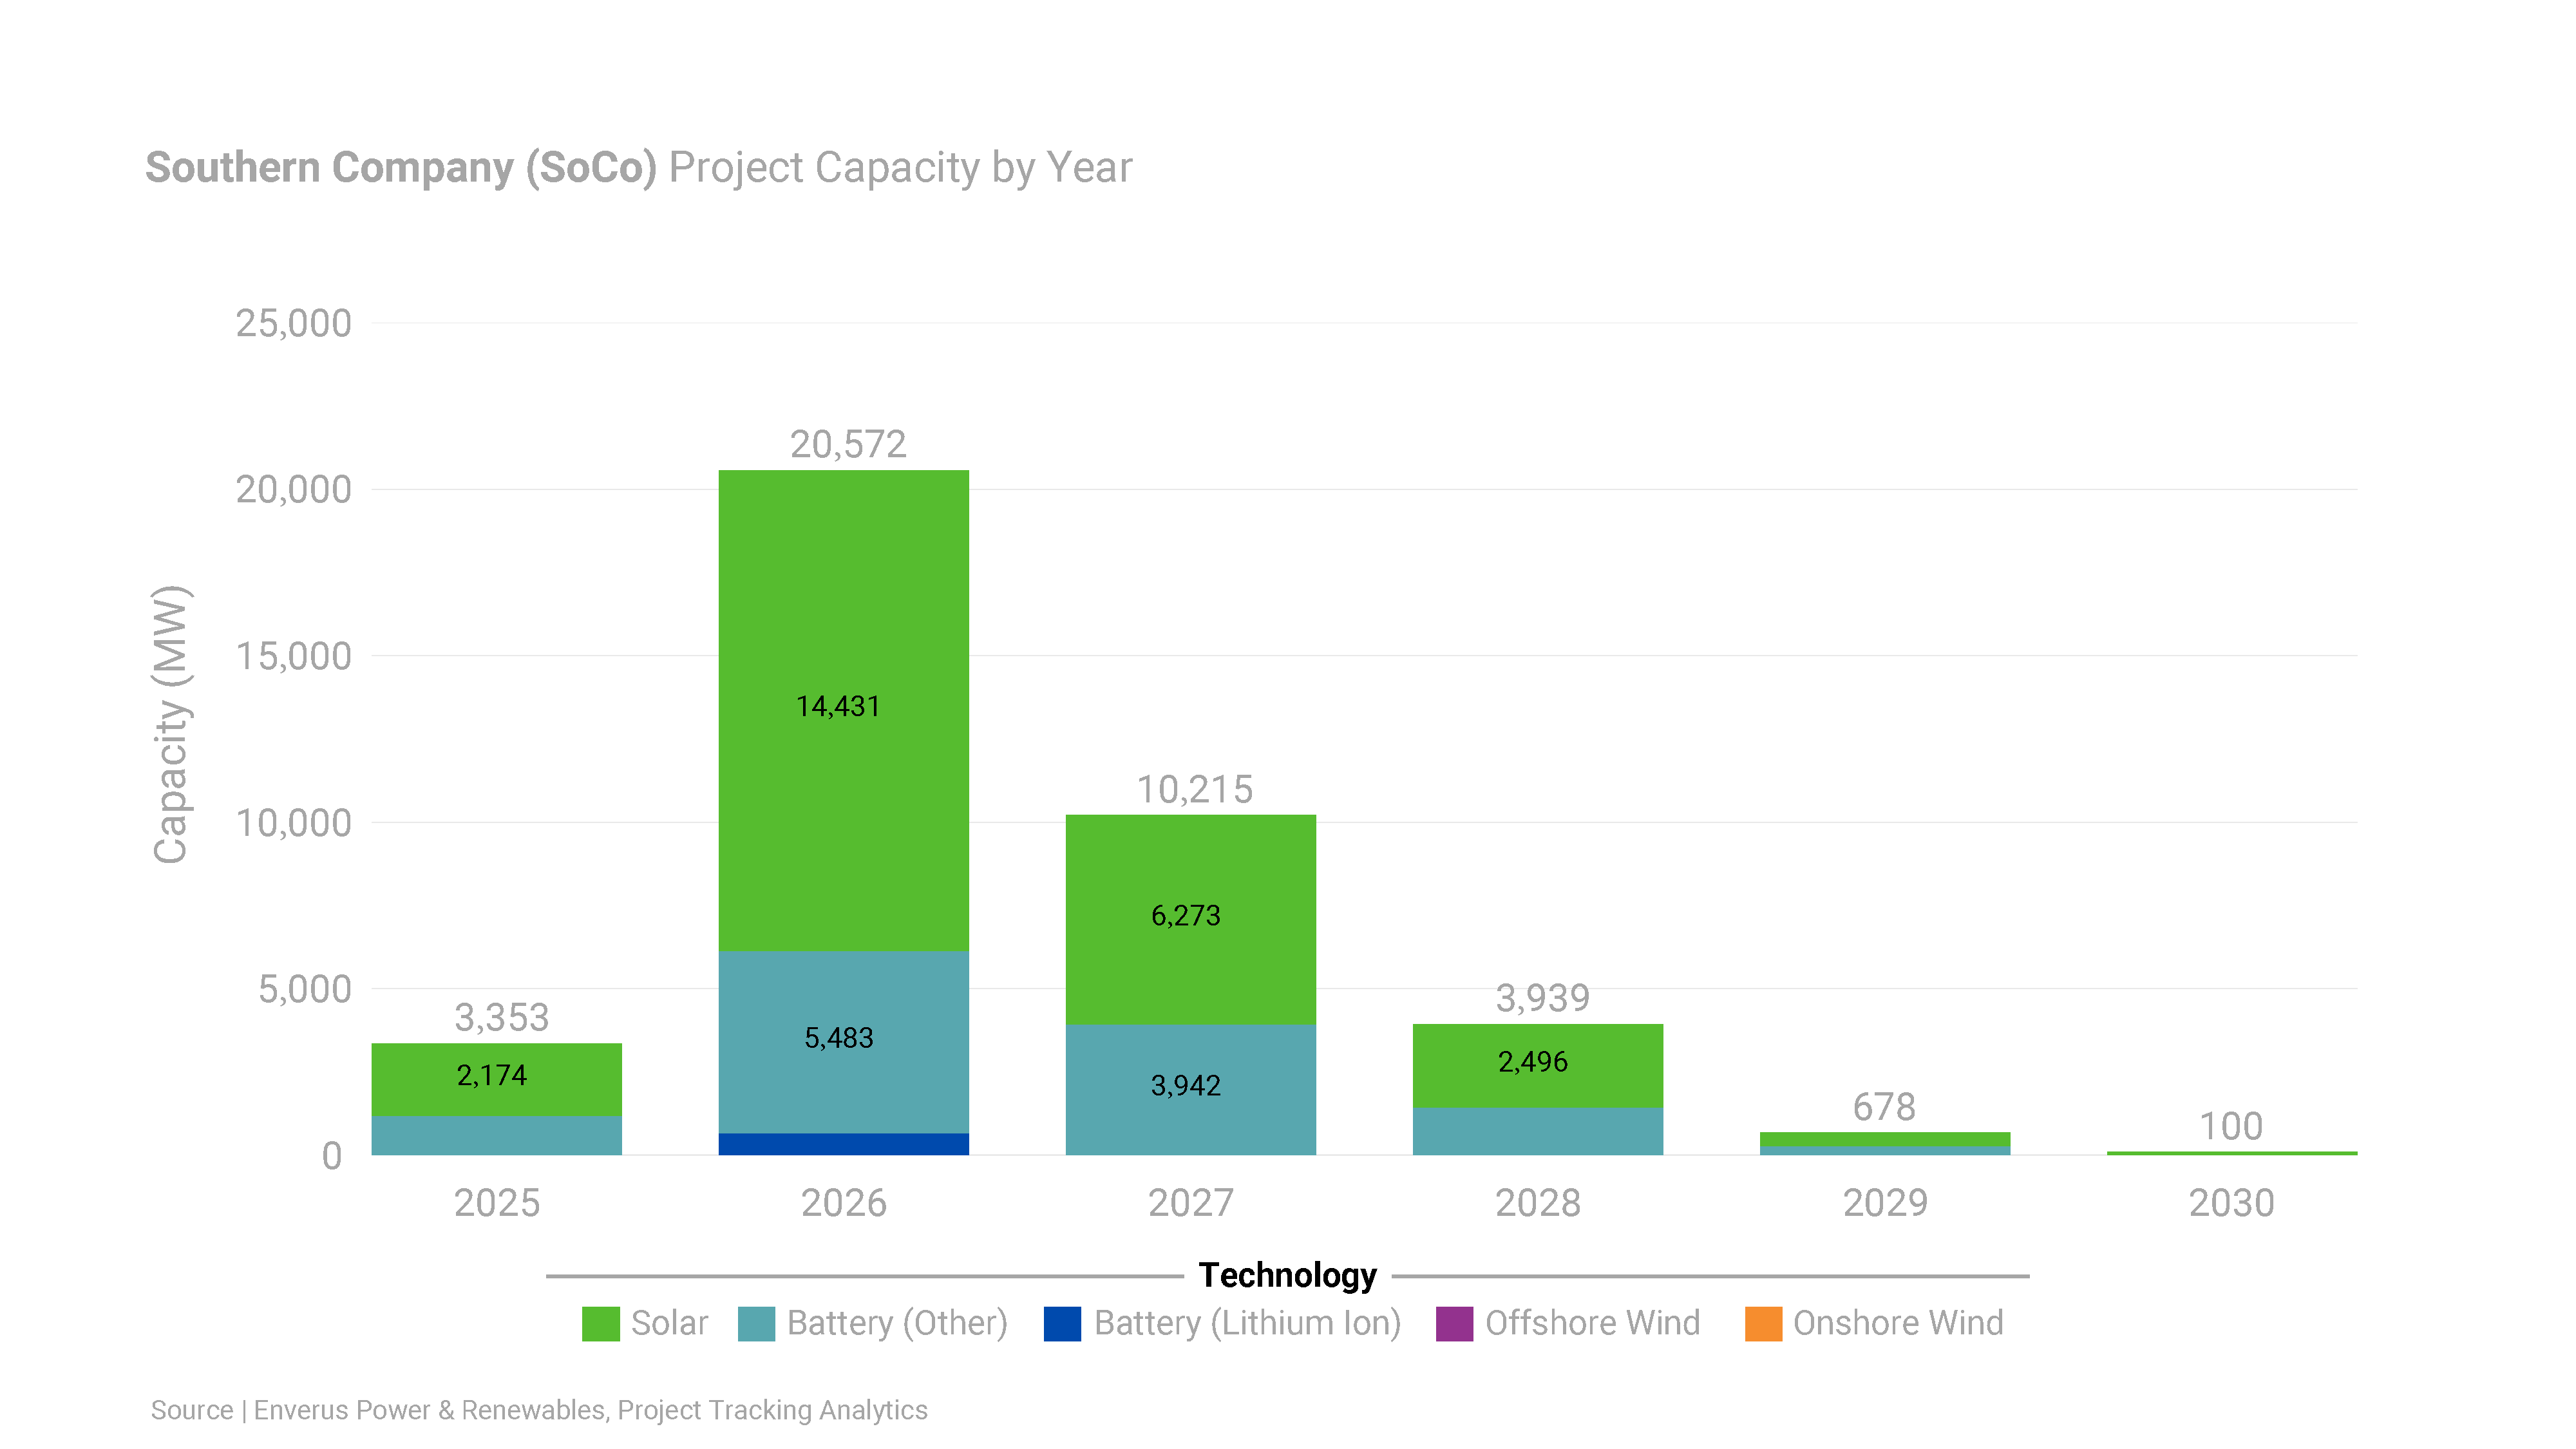
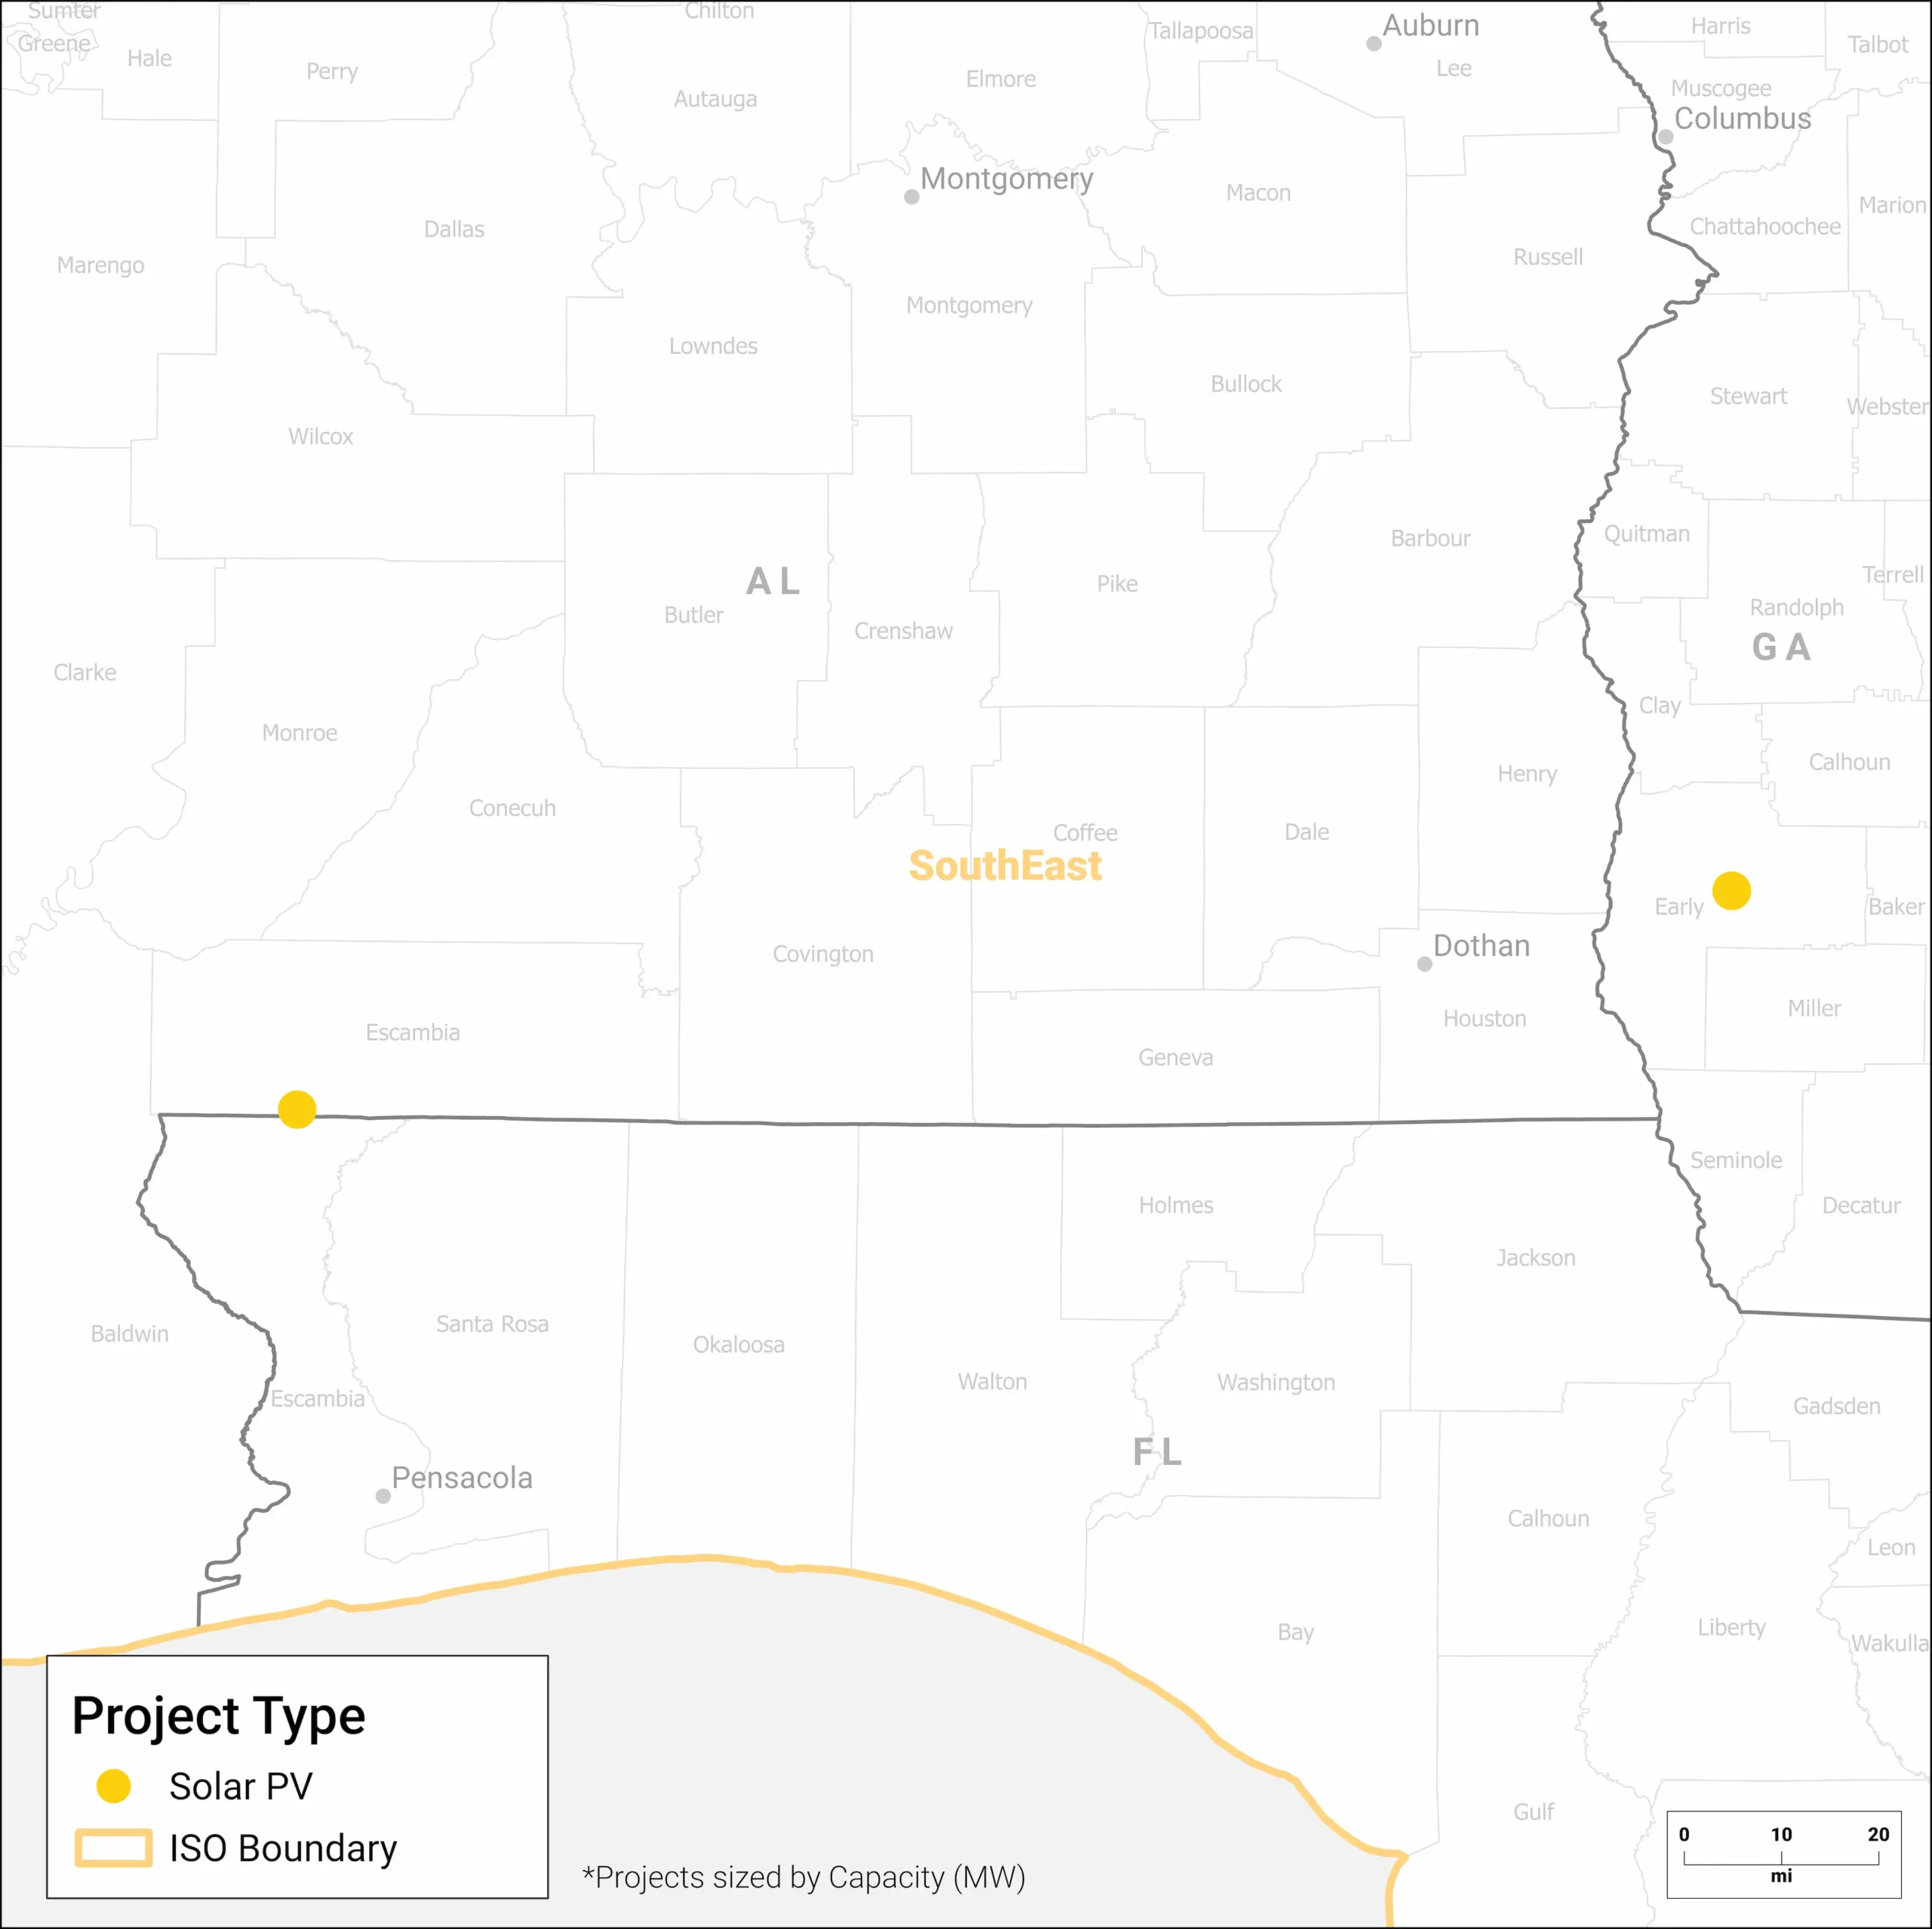
ISO Overview
| Type | 2025 Planned Capacity |
|---|---|
| Solar | 2.57 GW |
| Wind | 1.95 GW |
| Storage | 2.99 GW |
Displaying only 2025 planned capacity due to the recent integration of utility queues in PRISM, ensuring maximum accuracy.
As of January 1, 2025
As of January 1, 2025
ISO Overview
| Type | 2025 Planned Capacity |
|---|---|
| Solar | 2.17 GW |
| Wind | 0.0 GW |
| Storage | 1.18 GW |
Displaying only 2025 planned capacity due to the recent integration of utility queues in PRISM, ensuring maximum accuracy.
As of January 1, 2025
As of January 1, 2025
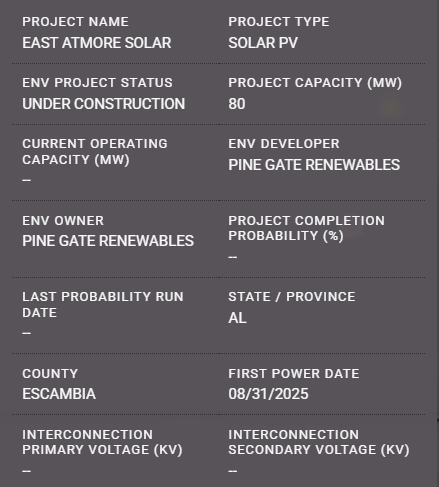
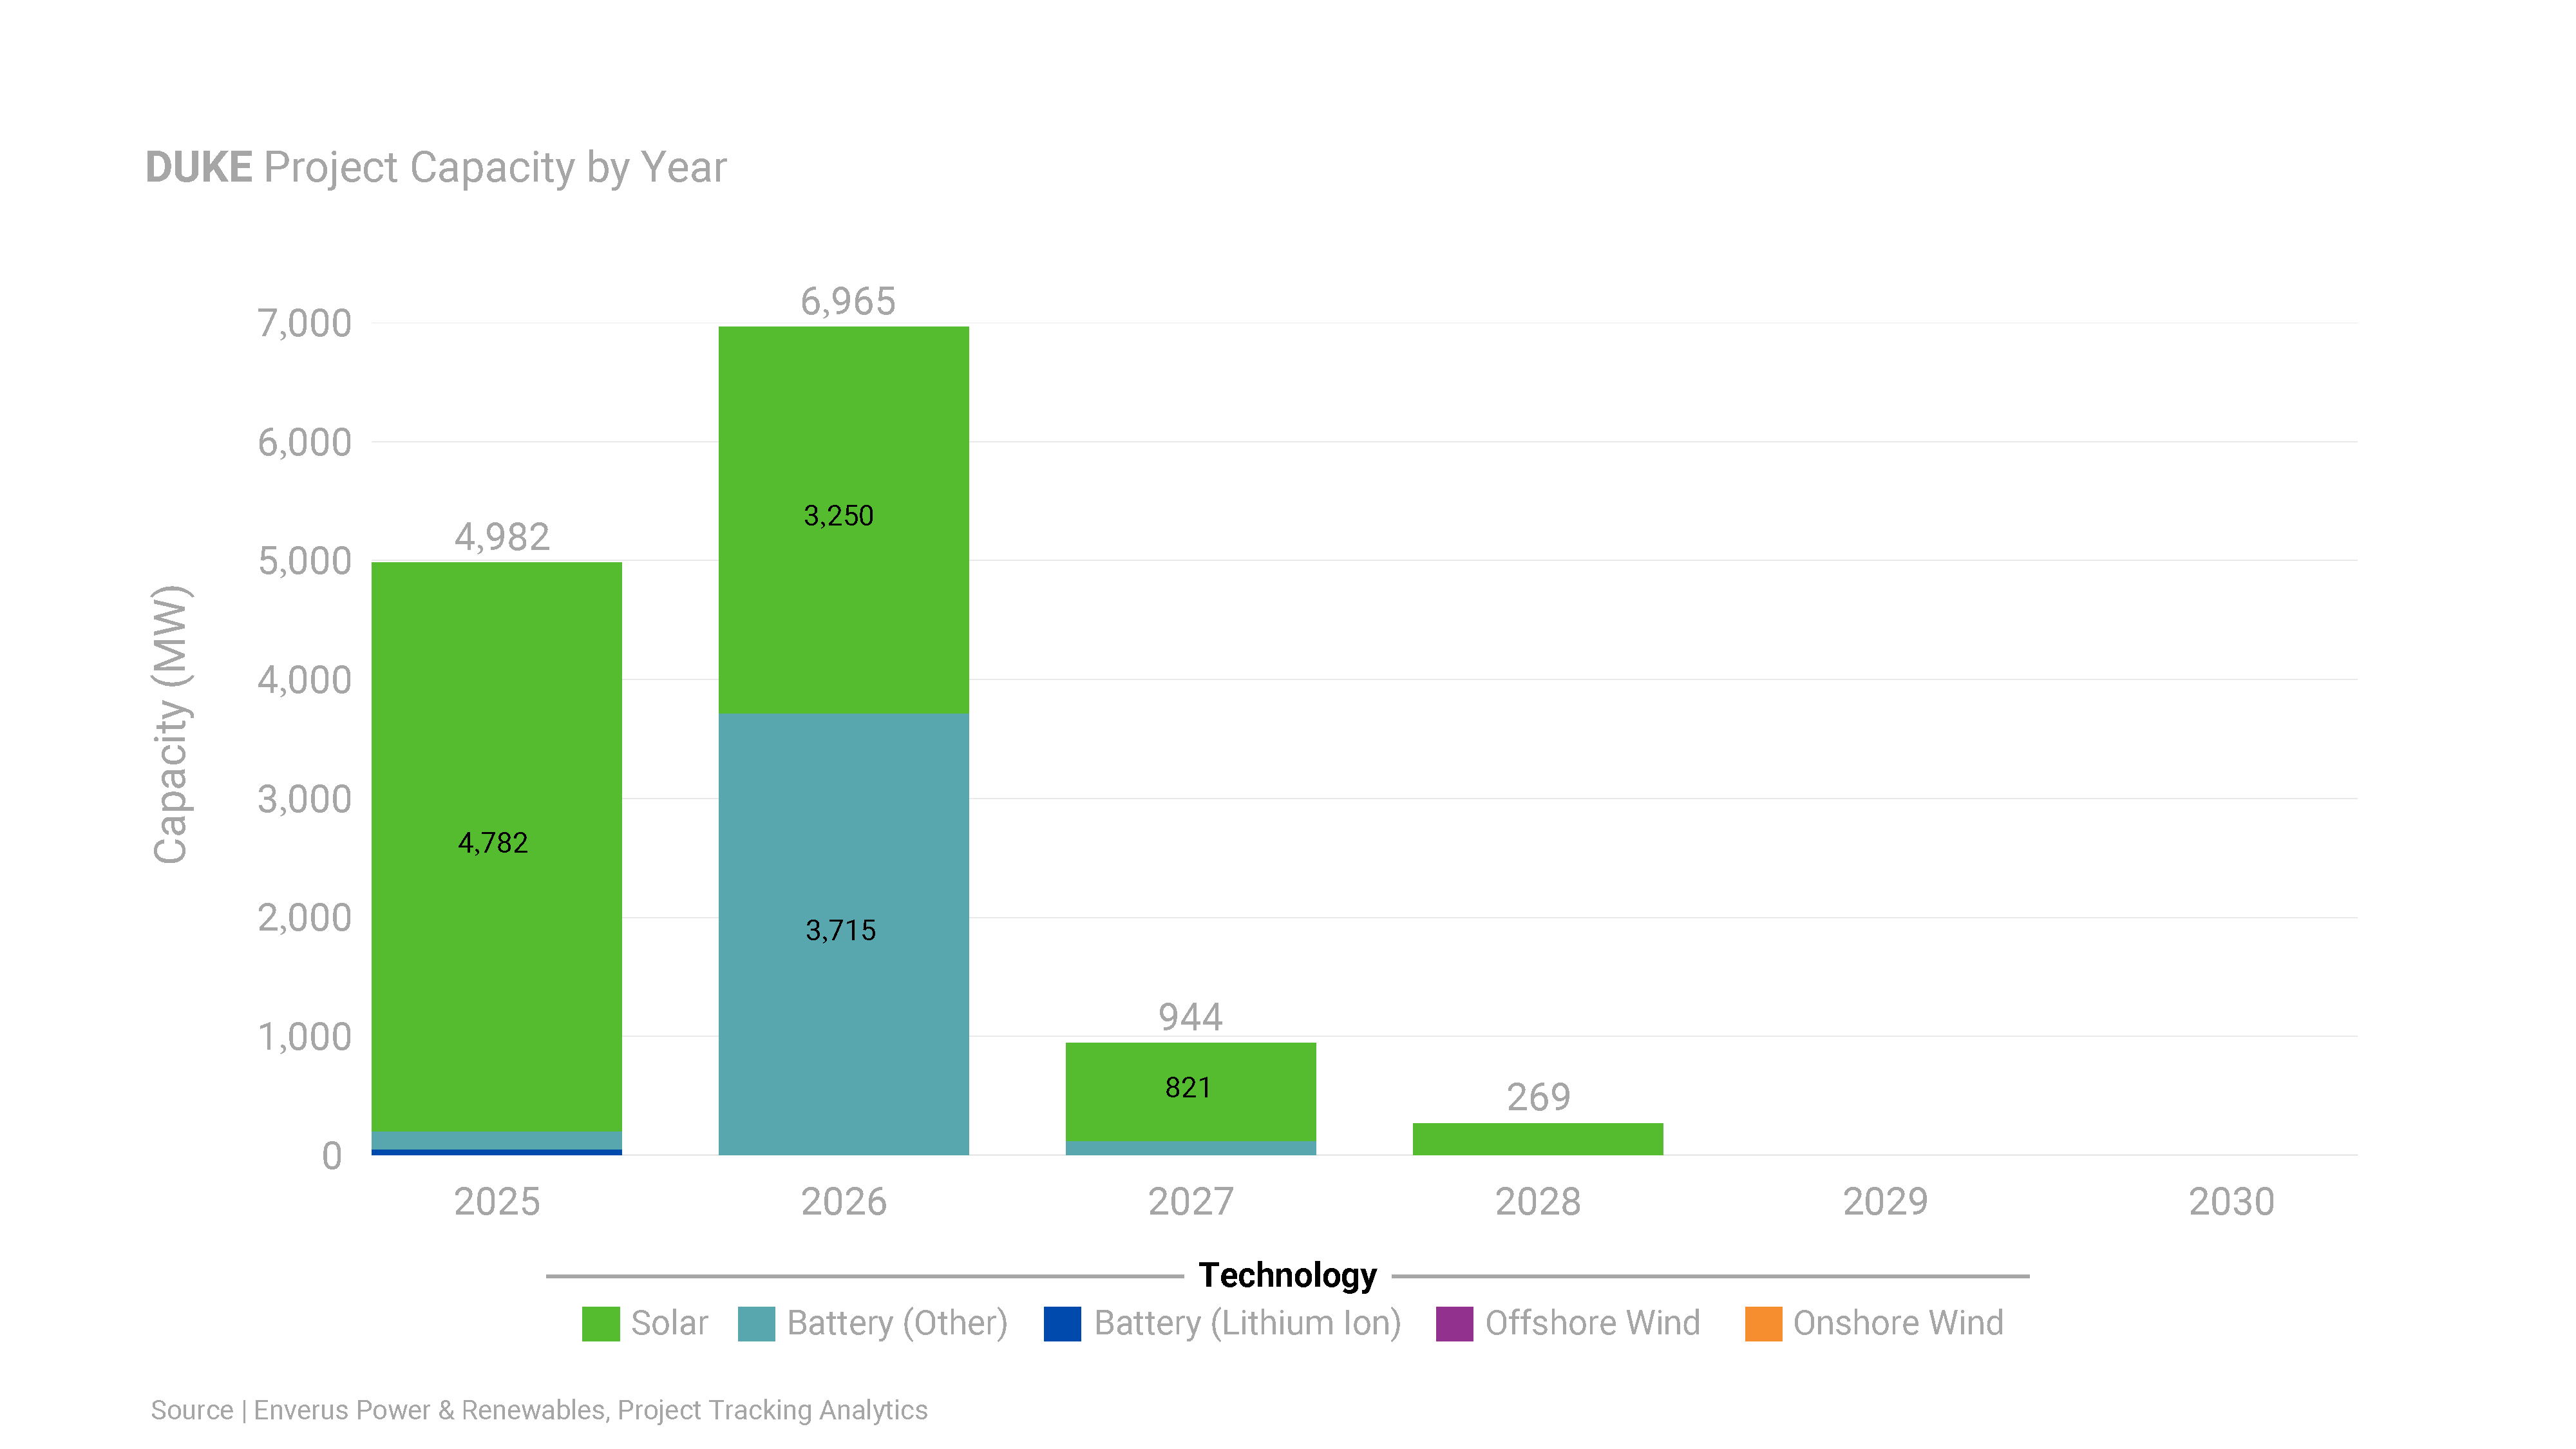
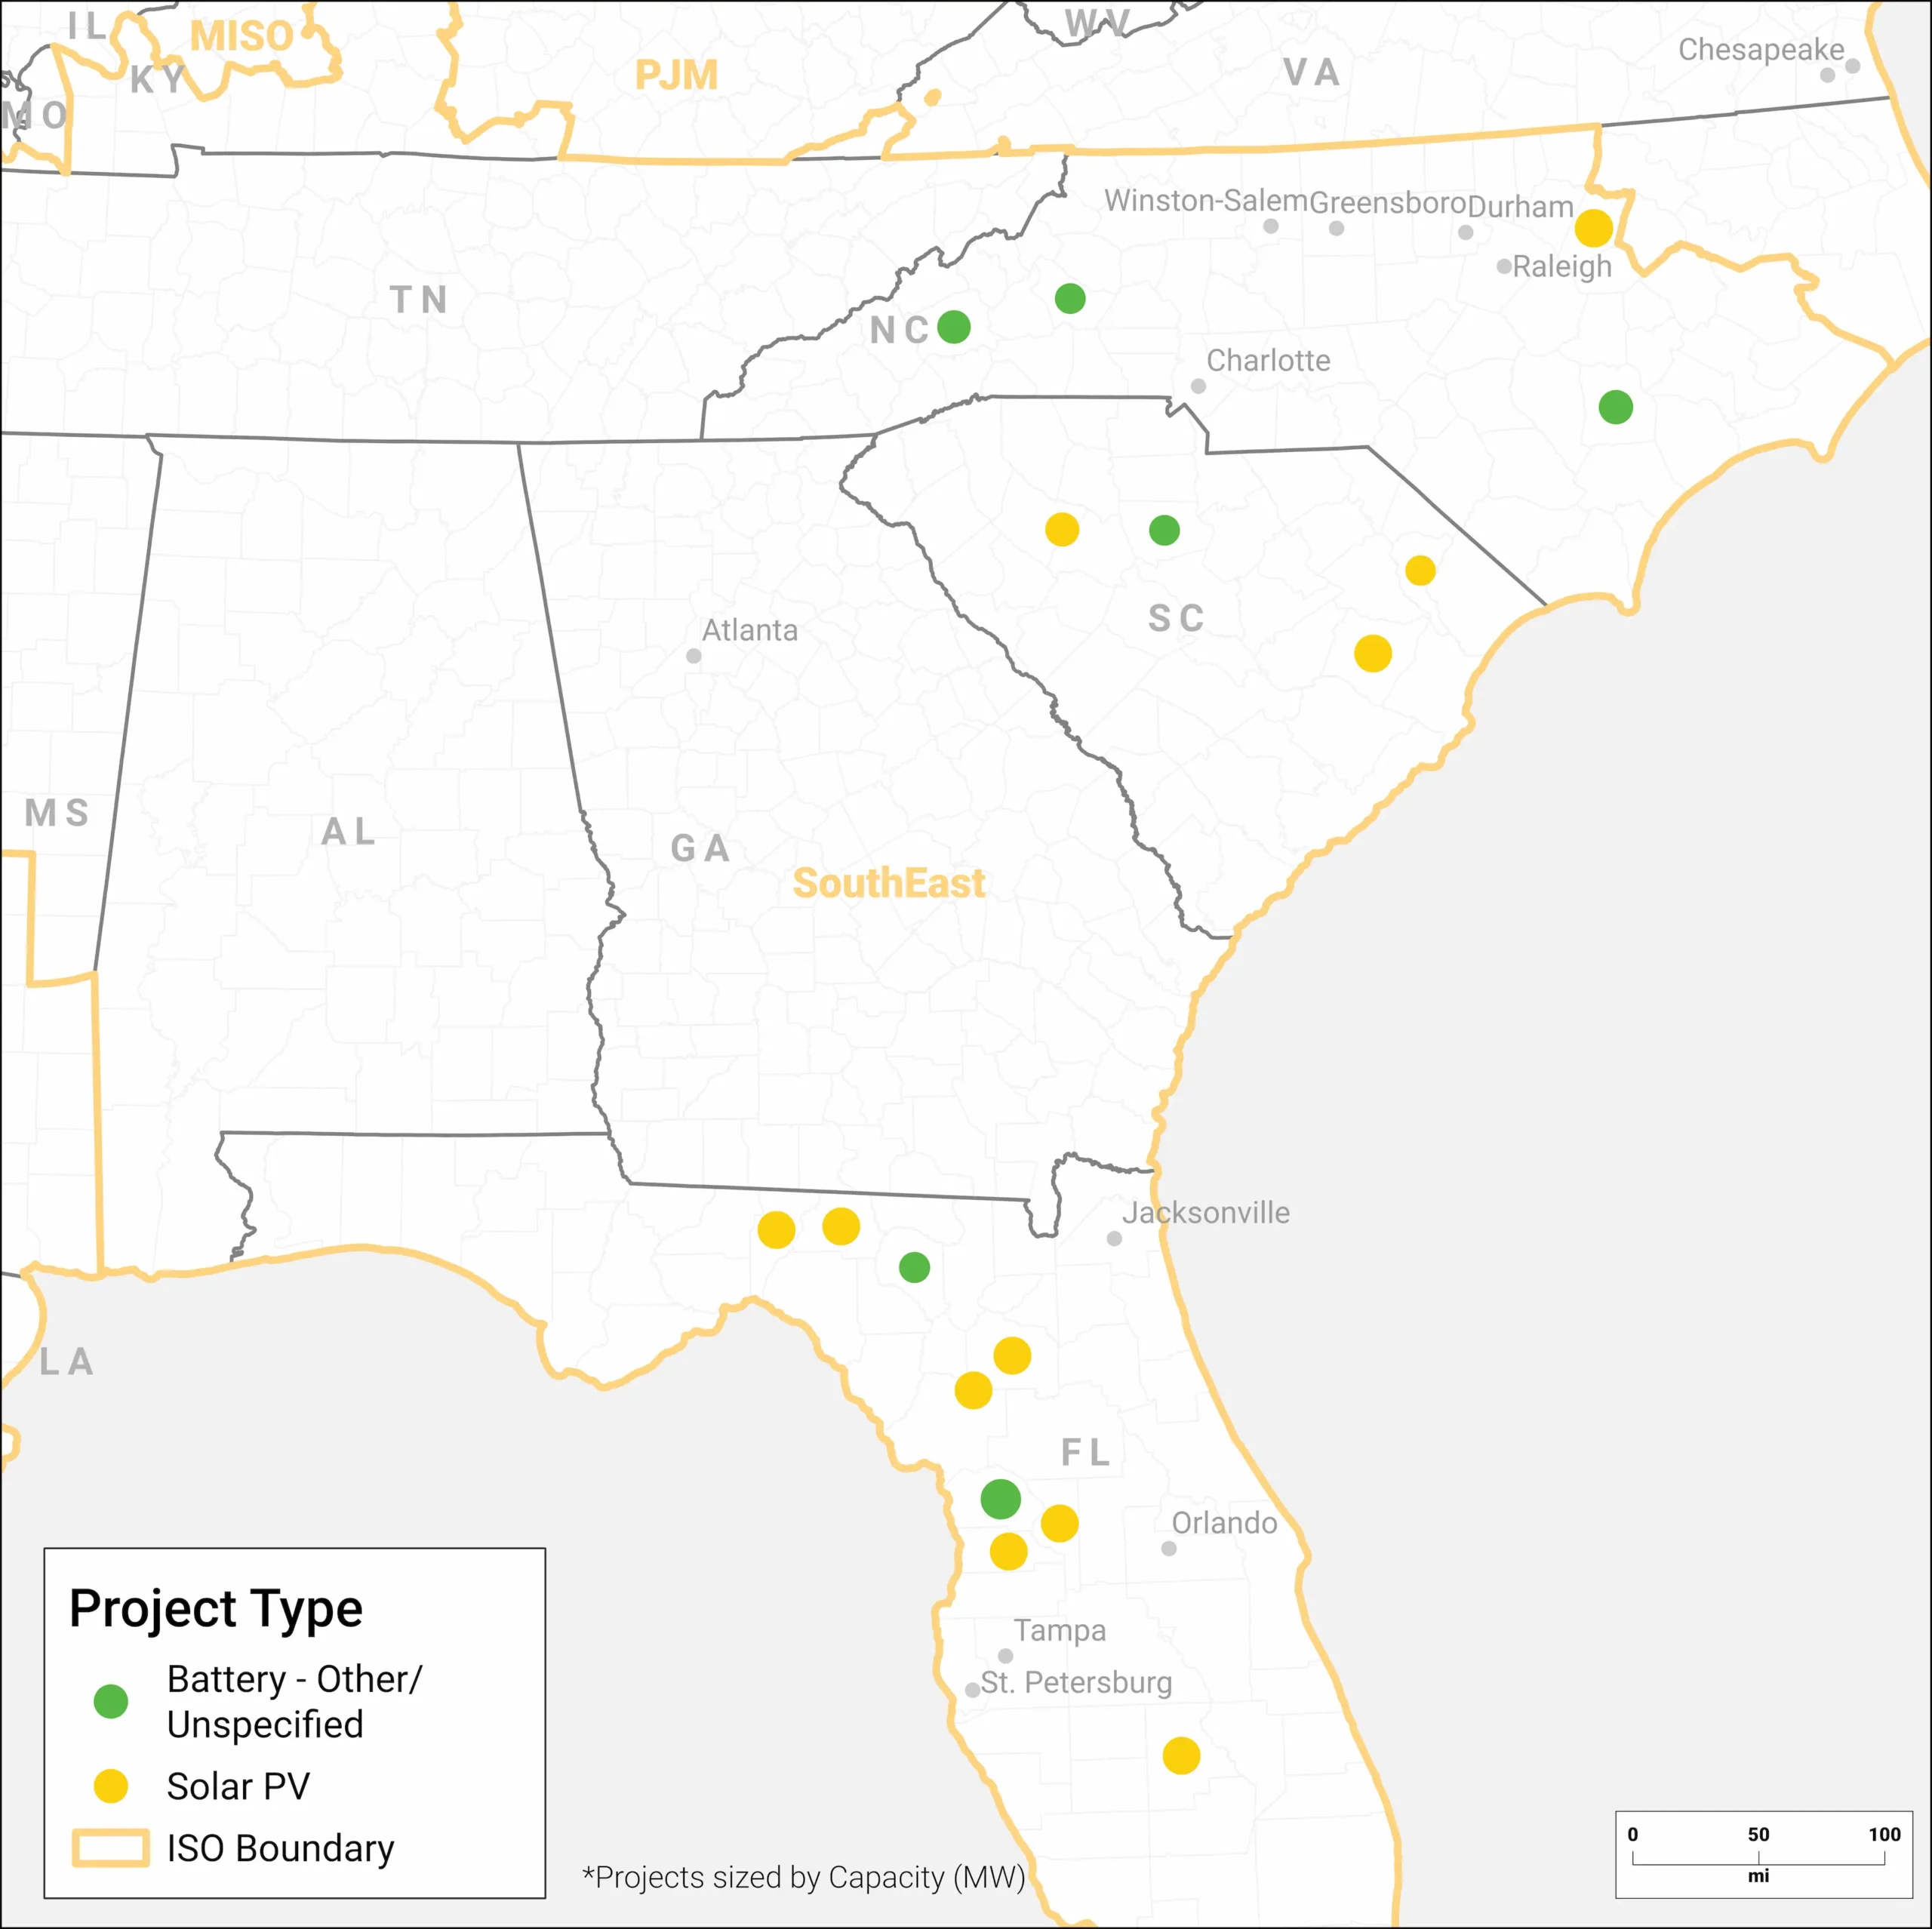
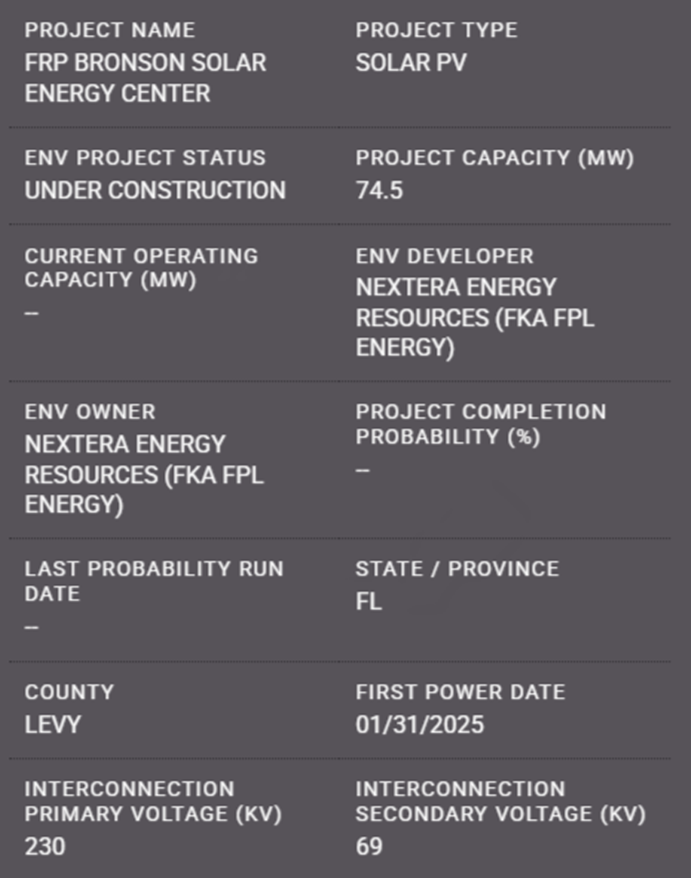
| Type | 2025 Planned Capacity |
|---|---|
| Solar | 4.78 GW |
| Wind | 0.0 GW |
| Storage | 0.2 GW |
Displaying only 2025 planned capacity due to the recent integration of utility queues in PRISM, ensuring maximum accuracy.
As of January 1, 2025
As of January 1, 2025
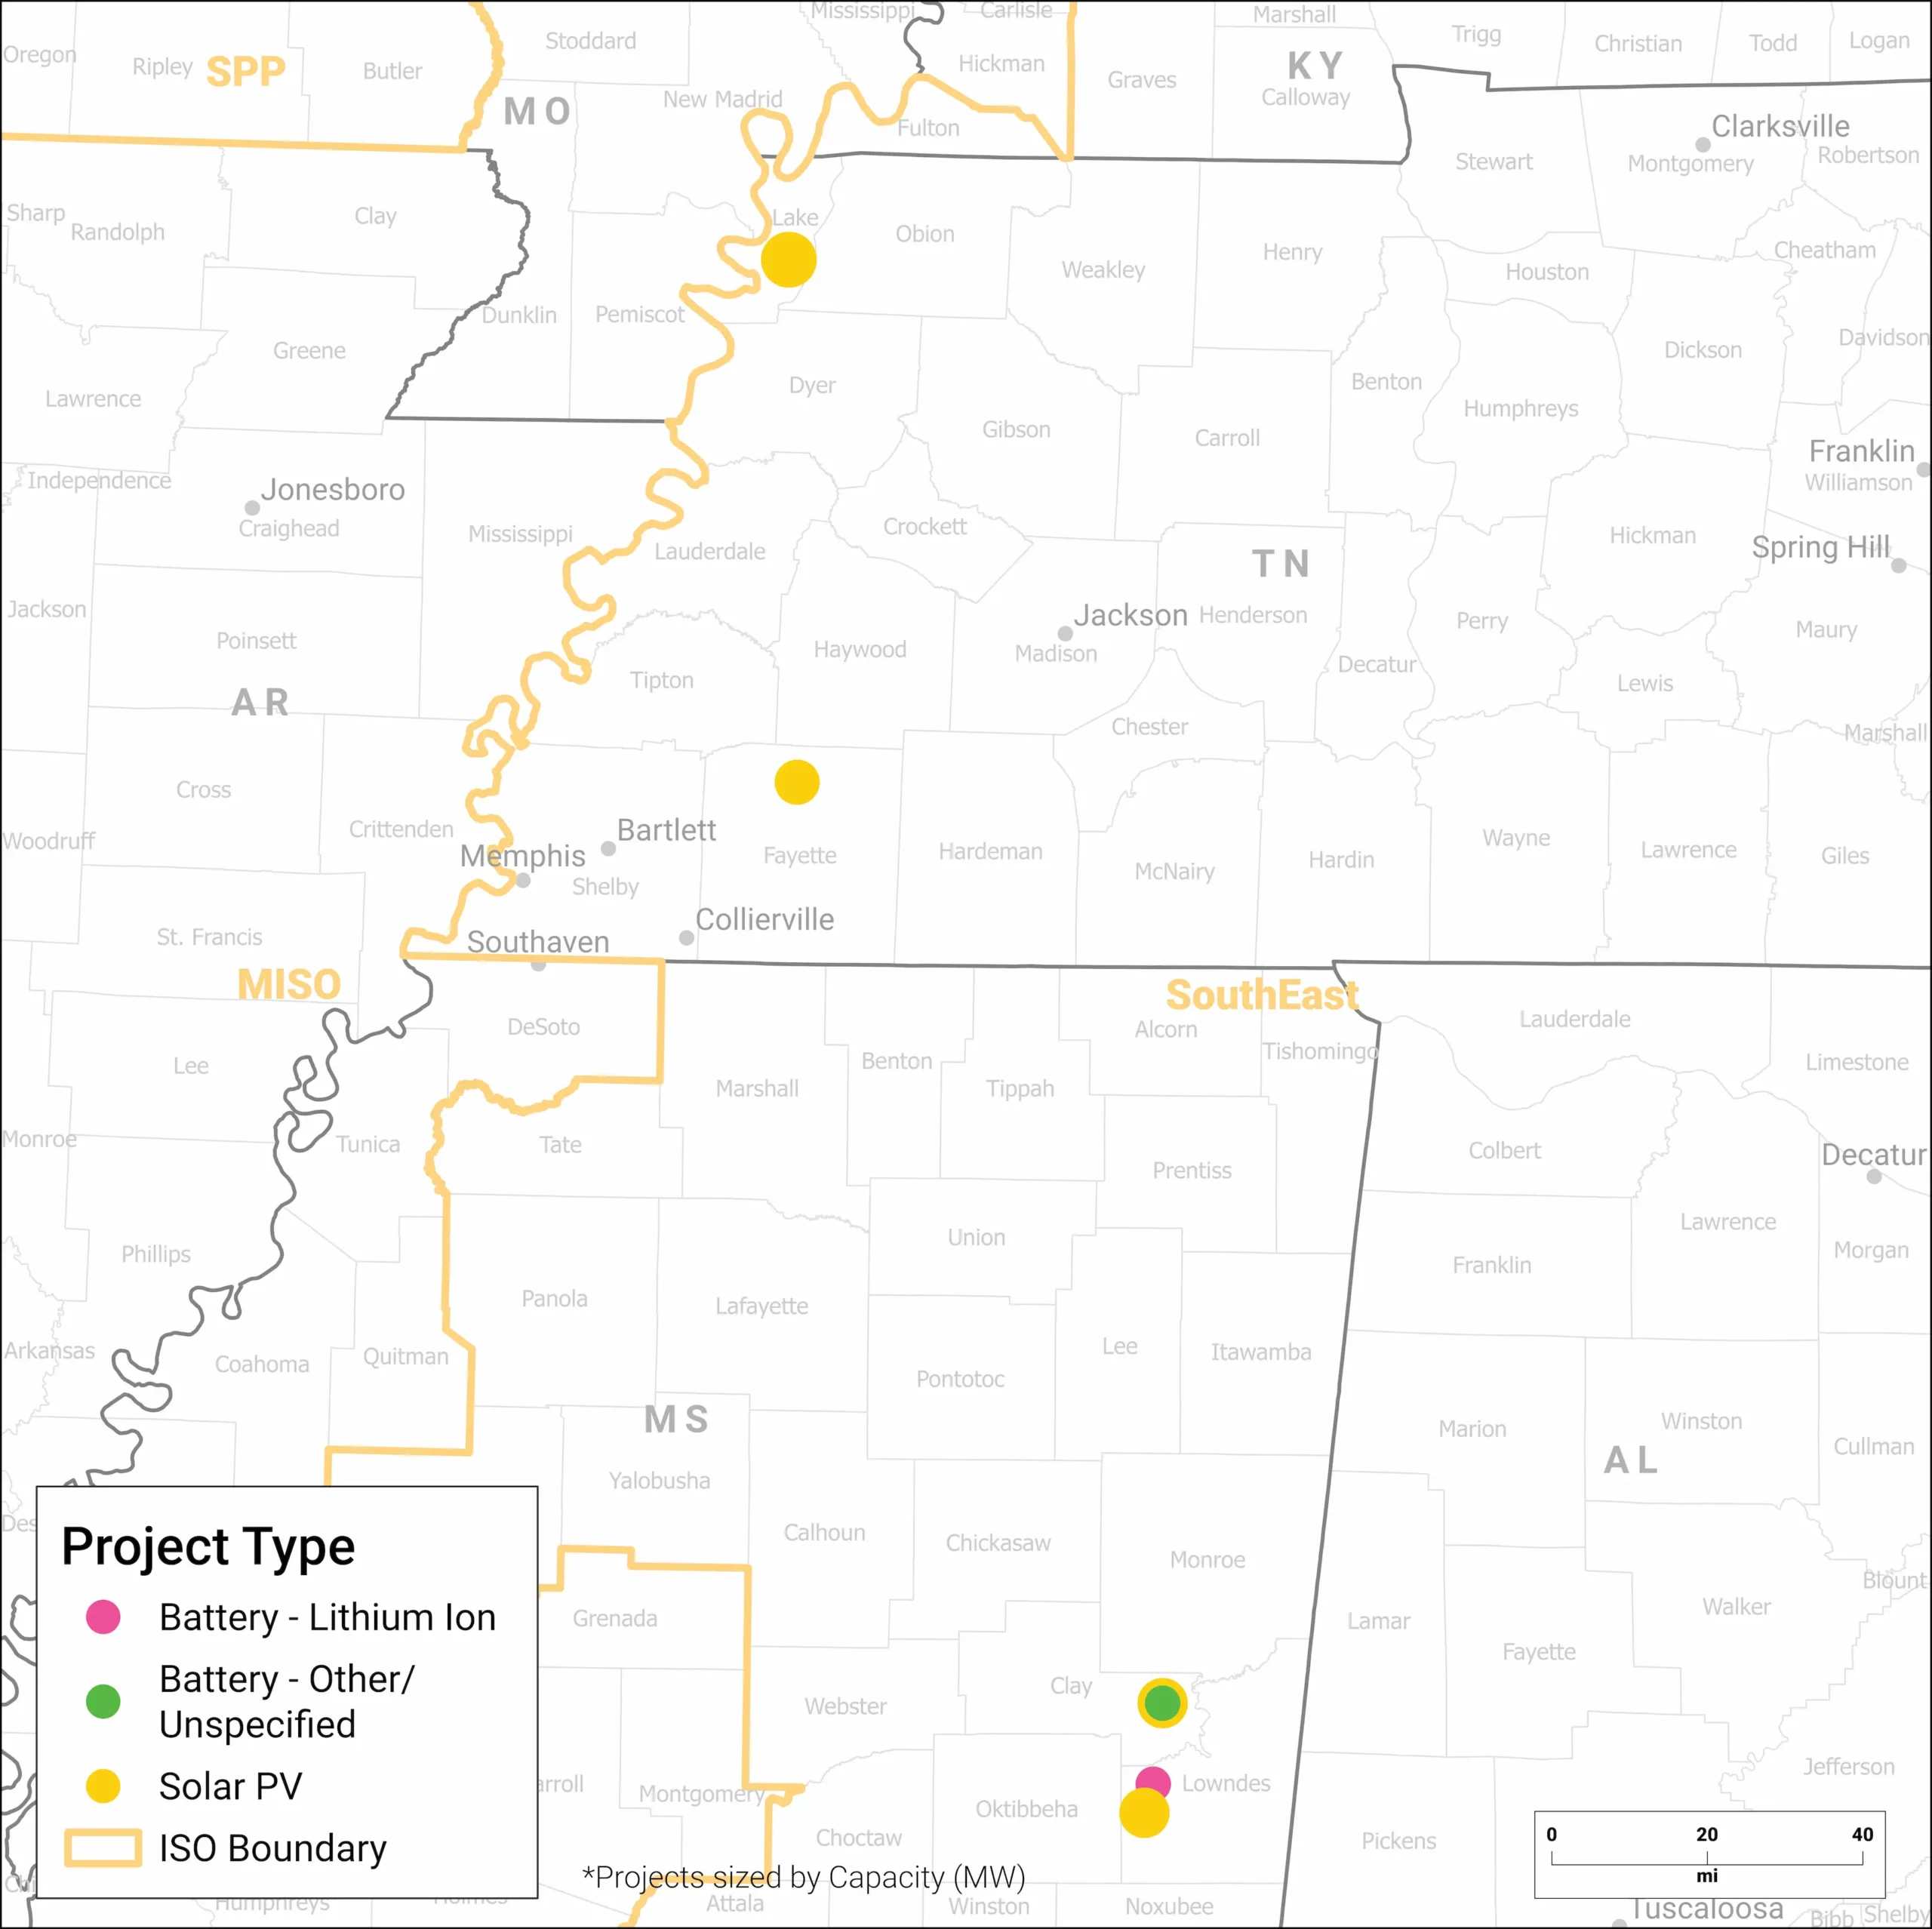
| Type | 2025 Planned Capacity |
|---|---|
| Solar | 1.71 GW |
| Wind | 0.20 GW |
| Storage | 0.22 GW |
Displaying only 2025 planned capacity due to the recent integration of utility queues in PRISM, ensuring maximum accuracy.
As of January 1, 2025
As of January 1, 2025
Advanced grid insights with accurate load forecasts and extensive monitoring enhance trade execution and profitability.
Quickly identify grid opportunities and risks with high-quality mid-term forecasts, expert analysis and streamlined grid analysis.
Confidently shape your investment strategy, identify optimal power asset locations and optimize utility scale PV project profitability—all in minutes.
With Enverus Instant Analyst™, you receive answers you can trust, delivered in seconds. Sourcing from 25+ years of vetted data and research on the most trusted SaaS platform designed exclusively for energy.
Site your next data center 4x faster with Enverus. Enverus helps you cut costs, reduce risk and site with confidence.
Scenario-based forecasts that look 20 years into the future. Confidently plan around evolving grid dynamics, identify profitable opportunities and support strategic decisions with the most trusted long-term view in power.
Arm yourself with the knowledge to inform strategic decisions and grow your business with one source for insights across oil and gas, renewables, carbon capture and ESG.
Design PV Plants & Battery Storage Systems 90% Faster with Our Advanced Solar & Battery Software.
SUGAR™ helps grid operators and utilities manage increasing interconnection queue volumes by accelerating modeling and simulation studies, with up to 2x reduction in time-consuming study processes.
Unlock returns of electron and molecule-based energy transition technologies with deal insights, from power generation assets to CCUS and hydrogen.
Tune out the noise, get unbiased evaluations and uncover hidden opportunities with advice you can trust from experienced energy and power intelligence advisors.
Comprehensive coverage of power markets and insights into emerging energy technologies and project economics.
Interconnect offers developers certainty throughout the interconnection lifecycle, providing scenario analysis and risk assessment capabilities to improve the chances of deploying new projects.
Let’s get started!
Let’s get started!
We’ll follow up right away to show you a quick product tour.
Ready to Subscribe?
Ready to Get Started?
Ready to Subscribe?
Sign Up
Power Your Insights