As a royalty and minerals investor, your financial outlook is only as good as the underlying production forecasts that consider decline curves and expected commodity prices. You need a high fidelity forecast to acquire, expand and divest at the best (defensible) price. Absent accurate forecasts, interest owners are left with difficult questions to answer, such as:
- Am I getting paid correctly on the assets in my portfolio?
- What will my revenue streams look like one to five years in the future?
- How much are my assets worth based on future economics?
- How much can I spend to acquire assets by leveraging my NPV to increase 12 month cash flow?
- What is the fair market value if I were to sell today?
Another level of complexity is that accurate oil and gas forecasts must include your current producing wells and wells likely to pay in the future, i.e., development on your properties that adds additional wells. It’s a moving production forecast target without a nuanced, data-driven strategy for understanding operator behavior.
Royalty and minerals investors have the greatest need and greatest opportunity to forecast with precision. But with many investors still relying on Excel calculators and software tools that provide little more than the back of the envelope forecast, precision is elusive. What if you could not only get your production forecasts in the ballpark of accuracy (an 80% solution), but instead forecast with the same level of reliability that reserves certification firms employ? It’s possible with PRISM Forecast Studio.
Over the next few sections, we’ll walk through some quick Forecast Studio workflows that can help your team look beyond line-of-sight opportunities. We’ll explore the five key areas and varying levels of risk and certainty you can focus on to forecast to higher profitability, from proved developed producing (PDP) and lowest risk, to proved undeveloped (PUD) and highest risk.
As a sandbox for our forecasts, we’ll use assets in the Midland Basin operated by Pioneer and Chevron. If you happen to be an interest owner in this area, you will paste in your API list to build out a map and see your unit shapes by operator. PRISM gives you a complete breakdown of your acreage, enabling users to filter the map to view laterals and well inventory along with producing wells, DUCs, native producers and permitted wells.
PDP forecast workflow
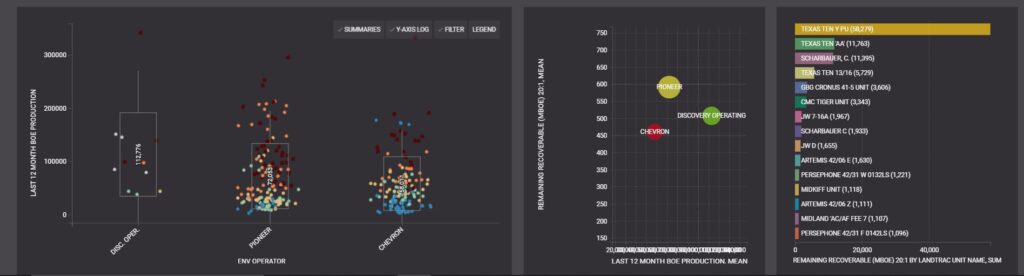
These wells are currently producing assets that provide steady streams of royalty checks and the lowest forecast risk because of their production history. By filtering the map to producing wells, we see each assets’ production zones, well header and estimated ultimate recovery (EUR). We want to quickly assess the remaining recoverable reserves by unit and discover the greatest concentration of value in our portfolio area.
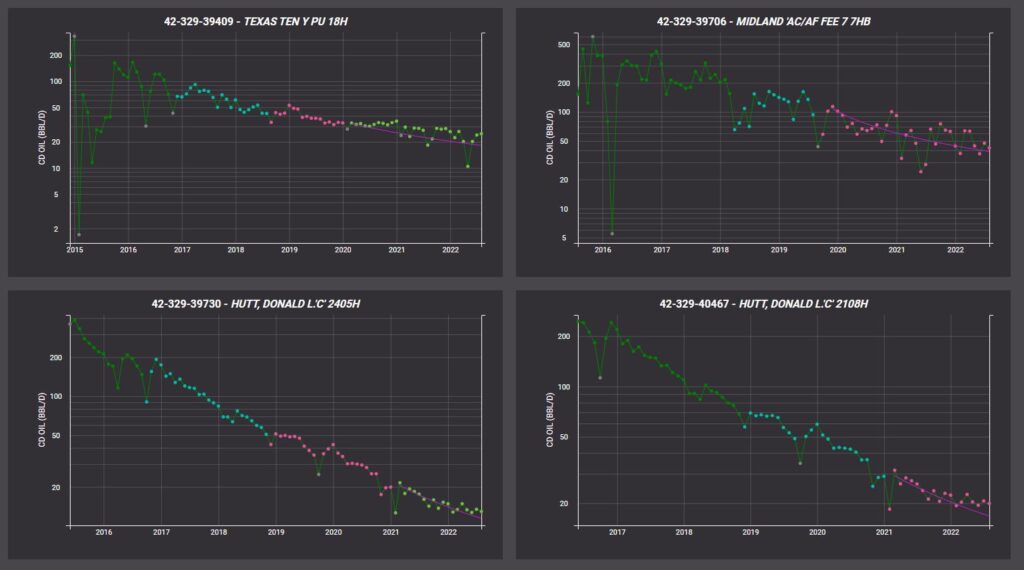
PRISM’s scatter plots tool provides a good sense of where the highest remaining EUR is grouped. Next, we’ll evaluate the 82 wells in this example with 12-month production and decline curves. Using Forecast Studio directly from within PRISM, we can build the actual PDP profile with historic data, built up by operator.
Now we put a value on this production by exporting the economic model using the PDP profile into Excel, where we can fine tune with production dates and pricing. Applying a conservative 15% discount on cash flow, the NPV of these PDP assets is $362 million, accounting for severance taxes, yields and operator royalty rate correlated with M&A activity and commodity prices. That results in a $67,000 boe per day valuation, rendered with confidence using Forecast Studio.
PDNP forecast workflow
Proved developed not producing (PDNP) wells are stuck in limbo. They have been completed but are not in pay and include shut-in wells. PDNP wells are often newly fractured but waiting on services or in process of flowing back post completion. Timing between completion and first production really depends on operator behavior, so understanding historical activity and timelines is key.
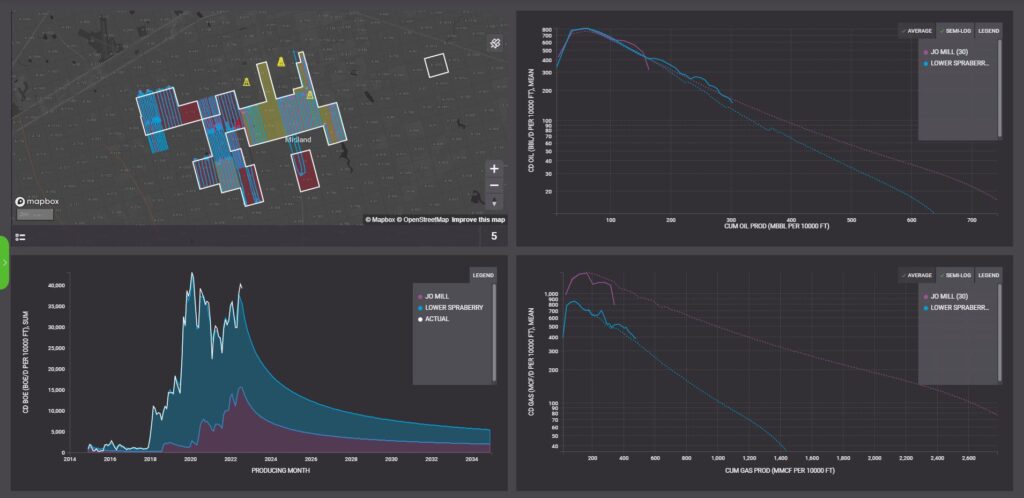
Let’s begin the workflow by evaluating only completed wells not in play by filtering for PDNP wells in the same units as before and expanding the analysis by using a three-mile radius of activity. The goal is to know when these wells will start producing hydrocarbons and revenue for interest owners.
To this end, cycle times between completion date to first production for a given operator provide a good KPI. This shows an average 40-day cycle time trending toward 30 days, signaling that we might see revenue checks soon on our PDNP wells. Forecasting from the same Jo Mill and Sprayberry intervals as the PDP workflow, Forecast Studio automatically creates type well profiles to build out our valuation, both normalized and showing which production zones outperform the others.
It’s important to note that we’re not just building a basic line model. Forecast Studio can also export a complete development model with total number of well locations by interval, giving us the timing for when production is most likely to come online. With our PDNP analysis complete, we can see that the NPV of the forecasted royalty stream is $61 million.
You can use the same workflow to forecast DUC inventory and permitted wells, giving you four powerful ways to forecast with precision. Let’s delve into the fifth and final workflow.
PUD forecast workflow
There’s no crystal ball for PUD forecasts, but we can leverage tools and data sets to see what wells are “coming soon.” Because these wells are not yet permitted, we need to infer from historical offset wells where and when drilling will start, understanding that our forecasts carry the highest risk … but we’ll use the discount rate to de-risk the forecast later.
Well spacing is a great place to start our PUD forecasting. From our area of interest in the Midland Basin, we’ll use PRISM to filter the map to evaluate development spacing by unit and interval. Analyzing operator well spacing would normally be a time-consuming workflow, but Enverus has already added future inventory to get your analysis up and running fast. Filter for Enverus Placed Wells to get a good feel for the future development scenario. To avoid double dipping production on our forecast, we include proposed and permitted wells.
Understanding when these potential future wells will come online is a matter of operator behavior and cycle times. From the rig count over time, we can see Pioneer and Chevron running a high number of rigs that has recently dropped off, indicating that these operators are not in a hurry to develop remaining inventory within the next couple of years. Why? PRISM analytics indicate this is due to the number of already permitted wells and ample supply of DUC inventory that will be burned first. We can also see that each operator is holding steady at around 60 net new wells per year and typically drills a whole pad at a time, up to seven well pads, but settling around five per pad. As a final step in our well selection, let’s filter down to future/potential location producing intervals in the Wolfcamp A and B.
Since this is a fairly high forecast risk based on timing assumptions, we’ll have Forecast Studio build our own typecurves for the selected wells. Then we’ll use the auto forecast to batch generate our forecasts with the option to manually adjust individual forecasts by using stats on overpredicted EUR.
We can export to Excel, Aries or PHDWin for deep-dive economic analysis. Having generated multiple typecurves with good justification to add to our forecast model, we can now turn our attention to valuating this PUD production potential. Using the type wells from the typecurves we created, let’s filter out the outliers to focus the forecast on normal distribution wells. Finally, we can compare historic and forecasted production to see how they fit and home in on a production profile. Rinse and repeat for the gas phase.
For this PUD forecast, a 50% discount rate is used due to the high risk relative to PDP where we used 15%.
The result is a forecasted NPV of $75 million for our selected PUD wells. Just a few years ago, this type of analysis would have taken weeks to wrangle up the right data, analyze well spacing, place wells based on company guidance, generate typecurves and run the economics model. Today, leveraging PRISM data sets and Forecast Studio, we can achieve the same level of analysis with confidence in just minutes.
Final thoughts
This is a universal, repeatable PRISM workflow royalty and minerals investors can easily apply to any basin for a complete view of current PDP and upside potential across reserves categories (permitted, DUC, PDNP and PUD).
Looking to acquire assets? You can use the exact same workflow to scout out acquisition targets ahead of the bit. And you may need credit or capital backing to do that. With reserves certification level accuracy, PRISM’s Forecast Studio provides your team with defensible methods and economics that can help make your case to private equity and lenders for a reserves-based loan, accelerating growth and de-risking your portfolio.
Want to learn more about how Enverus can help forecast higher minerals profits? Fill out the form below to speak with an Enverus expert.