[contextly_auto_sidebar]
CRUDE OIL
- Despite President Donald Trump’s pledge on Friday to fill the Strategic Petroleum Reserve “to the top,” crude oil futures continued to slide Monday morning amid growing fears of an outright contraction in global oil demand this year. A number of countries around the globe are going into lockdown in an effort to slow the coronavirus pandemic. Even without a contraction in world oil demand, the SPR fill proposed by the White House would only partly offset the volumes going into commercial stockpiles and would be too slow of a response to blunt the worst price declines in the second quarter.
- The Energy Information Administration reported that US crude oil commercial inventories increased by a whopping 7.7 MMbbl for the week that ended March 6. However, these builds were offset by large draws in gasoline and distillates. Gasoline stocks fell by 5 MMbbl while distillate stocks drew by 6.4 MMbbl. Total US petroleum inventories were down by 7.6 MMbbl versus the prior week.
- The Commodity Futures Trading Commission reported an increase in managed-money long positions in NYMEX light sweet crude futures last week, up by 33,819 contracts to stand at 258,780 contracts. Managed-money short positions fell by 2,477 contracts to stand at 111,996 contracts. Despite the decrease, managed-money short positions remain elevated, and the long-to-short ratio remains stuck near 2:1.
NATURAL GAS
- US Lower 48 dry natural gas production decreased 0.17 Bcf/d last week, based on modeled flow data analyzed by Enverus, mainly due to a decrease of 0.28 Bcf/d in the East region offset by a 0.10 Bcf/d gain in the Mountain region. Canadian net imports decreased 0.67 Bcf/d due to fewer imports into the Northeast and increased exports in the Midwest. Res/Com accounted for most of the weekly demand drop week-over-week, falling 6.27 Bcf/d, while power and industrial demand decreased 0.18 Bcf/d and 0.69 Bcf/d, respectively. LNG export demand increased 0.39 Bcf/d on the week, while Mexican exports were flat. Weekly average totals show the market dropping 0.84 Bcf/d in total supply while total demand fell by 6.98 Bcf/d.
- The storage report for the week that ended March 6 showed a draw of 48 Bcf. Total inventories now sit at 2.043 Tcf, which is 796 Bcf higher than at this time last year and 227 Bcf above the five-year average for this time of year. With the decrease in demand outpacing the decrease in supply, expect the EIA to report a weaker draw next week. The ICE Financial Weekly Index report currently predicts a draw of 5 Bcf for the week that ended March 13.
- Current weather forecasts for the six- to 10-day period from the National Oceanic and Atmospheric Administration’s Climate Prediction Center show normal to below-average temperatures in the northern two-thirds of the Lower 48, while above-average temperatures are seen from South Texas through the Southeast and Florida. In the eight- to 14-day forecast, the above-average temperatures extend up the East Coast.
- At the expense of the crude market, gas found some traction last week. After trading as low as $1.61 last Monday, prices rallied up to nearly $2/MMbtu on news that Saudi Arabia released the floodgates on crude production and dropped their crude prices. This happened after Russia rejected the OPEC+ production cut plan. WTI dropped significantly after Saudi Arabia dropped prices and increased production, and it traded in the $30-$35/bbl range last week, with trading opening below that range this morning. E&P companies are reporting new activity plans in light of the depressed crude prices, outlining decreased capex and less-ambitious drilling plans. This change to the crude market brought some bullish sentiment to the natural gas market with the anticipation of decreases in associated gas production to help balance the oversupplied market. However, prices weren’t able to hold near the $2/MMbtu mark, and since opening last week the April 2020 contract has traded in a range between $1.610 and $1.998. At the time of this writing, the April 2020 contract was trading near the middle of the range at $1.826/MMbtu, down about 4 cents from Friday’s close.
NATURAL GAS LIQUIDS
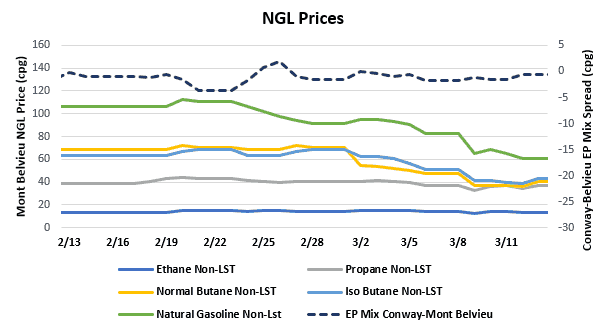
- NGL prices saw declines week-over-week as crude oil prices continue to decline after Saudi Arabia flooded the market with crude and dropped its prices, combined with decreased demand related to the COVID-19. Ethane saw the smallest decline on the week, falling $0.009/gallon to $0.138. Propane fell $0.043/gallon to $0.354, normal butane fell $0.141/gallon to $0.375, isobutane fell $0.179/gallon to $0.407, and natural gasoline fell $0.270/gallon to $0.643.
- The EIA reported a draw of propane/propylene stocks for week that ended March 6, with inventories decreasing 2.92 MMbbl. Stocks now stand at 67.03 MMbbl, which is 16.87 MMbbl higher than the same week in 2019 and 17.13 MMbbl higher than the five-year average. The five-year average draw for next week’s report is 525,000 bbl, although the same week last year saw a build of 951,000 bbl.
SHIPPING
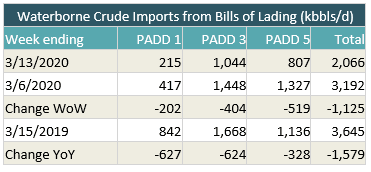
- US waterborne imports of crude oil fell last week, according to Enverus’ analysis of manifests from US Customs and Border Patrol. As of this morning, aggregated data from customs manifests suggested that overall waterborne imports decreased by 1.125 MMbbl/d compared with the prior week. PADD 1 imports dropped by 202,000 bbl/d, PADD 3 imports by 404,000 bbl/d, and PADD 5 imports by 519,000 bbl/d.
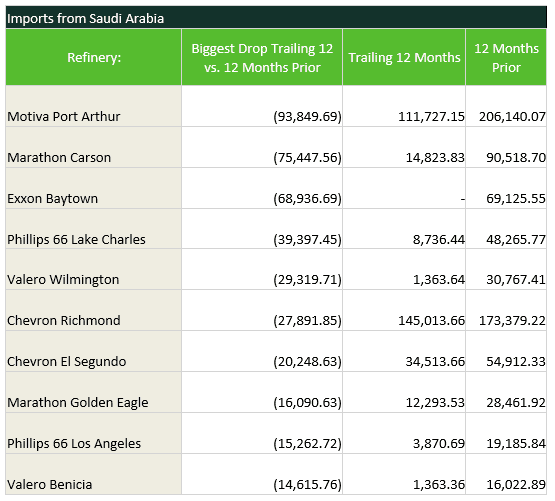
- With Saudi Arabia cutting oil prices and exports ramping up, we should start to see an increased level of imports from that country. Imports from Saudi Arabia to the US have fallen significantly since last year, down to an average of 483,000 bbl/d over the past 12 months versus 921,000 bbl/d for the 12 months before that. With Saudi crude coming back to the US, the list below shows the refineries that have seen the biggest drops in their Saudi imports.