[contextly_auto_sidebar]
CRUDE OIL
- US crude oil inventories decreased by a modest 0.4 MMbbl the week that ended Jan. 17, according to last week’s report from the US Energy Information Administration. Gasoline inventories increased by 1.7 MMbbl and distillate inventories decreased by 1.2 MMbbl. Total petroleum inventories posted an increase of 1.9 MMbbl. US crude oil production was estimated to be flat on the week, and crude oil imports were down by 120,000 bbl/d to 6.432 MMbbl/d.
- Whatever small amount of support there was behind higher crude prices after the signing of the interim US-China trade agreement crumbled in spectacular fashion last week. News of the spread of Wuhan coronavirus beyond China’s borders sparked fears of a repeat of something similar to the 2002-2003 SARS outbreak, which resulted in lower demand for transportation fuels throughout Asia, especially jet fuel. March WTI opened on Tuesday following the Martin Luther King Jr. Day holiday at $59.35/bbl and settled Friday at $53.18/bbl. Heavy price declines last week show coronavirus concerns outweighing supply impacts caused by the supply disruption in Libya, which took 800,000 bbl/d off the market.
- The Commodity Futures Trading Commission report released Friday for positions on Jan. 21 showed an increase in Managed Money long positions by 5,941 contracts. Managed Money short positions decreased by 706 contracts.
Market internals developed a bearish bias with the price collapse last week. The declines expanded the price range to $5.88 on strong volume but a decrease in total open interest. The declines in open interest were driven by the liquidation of some of the long positions developed over the previous weeks. - The current market is developing oversold momentum indications and will need some time to consolidate last week’s moves. Further declines will find support at 2 standard deviations below the 20-week average of $52.02 down to the September low of $50.99. Rallies will have a difficult time extending beyond the 200-day average of $57.65. When prices broke down through that key average last week, the declines accelerated.
NATURAL GAS
- US Lower 48 dry natural gas production decreased 1.09 Bcf/d last week, based on modeled flow data analyzed by Enverus, while Canadian imports increased 1.79 Bcf/d. Res/Com demand saw an increase of 8.96 Bcf/d, while power and industrial demand increased 2.63 Bcf/d and 1.13 Bcf/d, respectively. Additionally on the demand side, LNG exports increased 0.59 Bcf/d while Mexican exports decreased by 0.02 Bcf/d. Overall, these events resulted in the market gaining 0.70 Bcf/d in total supply while total demand increased by 13.62 Bcf/d.
- The storage report last week showed a withdrawal of 92 Bcf. Total inventories are now 554 Bcf higher than at this time last year and 251 Bcf above the five-year average for this time of year.
- The current weather forecasts from the National Oceanic and Atmosphere Administration’s Climate Prediction Center are bearish for the coming week, with above-average temperatures throughout the US except the Pacific Northwest, which should see normal or below-normal temperatures. The eight- to 14-day forecast shows most of the US with above-average temperatures with a band of normal or below normal temperatures along the West Coast and extending into the Northern Plains.
- The CFTC report released Friday with positions as of Jan. 21 showed Managed Money short positions increasing by 41,089 contracts, while Managed Money long positions increased by 14,674 contracts. The 467,299 short-position contracts represent the highest level of short interest from the speculative sector since the CFTC report was modified in 2009 to more accurately reflect the speculative positions of traders. The market internals developed a bearish bias as prices fell to $1.83, but could not expand below that area as volume was lower and total open interest was down on the week.
- Natural gas has a history of expanding beyond defined support and resistance areas. Currently, the market is oversold and setting up for some sort of counter-trend rally. The gap from last week between $1.980 and $1.994 is the first target for prices to seek. The short position from the speculative element may well bring significant volatility to the trade should prices garner any strength. Further declines will run into buying at the 2016 lows of $1.61-$1.87.
NATURAL GAS LIQUIDS
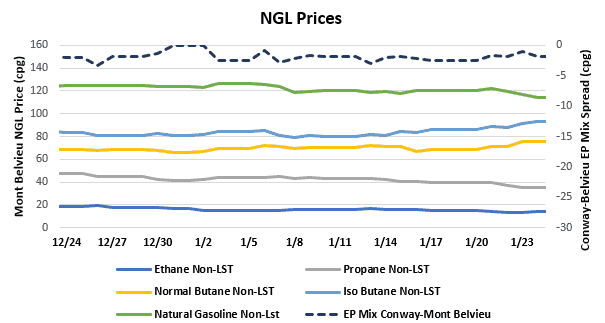
- Purity product prices moved both up and down this week. Ethane was down by $0.017 to average $0.141/gallon on the week. Propane also fell, decreasing $0.039 to $0.371/gallon, and natural gasoline fell $0.007 to $1.187/gallon. Gains were seen in normal butane, up $0.024 to an average $0.724/gallon, and isobutane, up $0.060 to $0.894/gallon.
- Ethane prices declined last week on market oversupply, exacerbated by the continuing fall of natural gas prices. As new petchem facilities come online around the Gulf Coast throughout 2020, ethane will be the primary feedstock and demand will increase, helping to balance the ethane market. Propane continued to decline last week on weak heating demand and ample supply in the market. Butane saw gains last week, mainly attributable to rebounds in exports after the Gulf Coast fog lifted.
- The EIA reported a draw in propane/propylene stocks for week that ended Jan. 17, with inventories falling 1.43 MMbbl. Stocks now stand at 86.51 MMbbl, which is 22.73 MMbbl higher than the same week in 2019 and 32.52 MMbbl higher than the same week in 2018.
SHIPPING
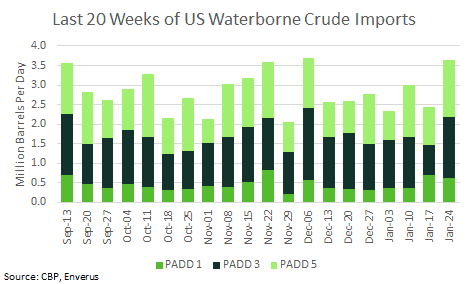
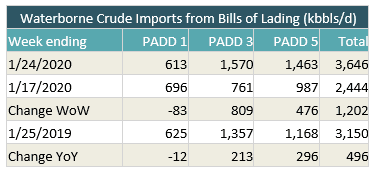
- US waterborne imports of crude oil rose last week according to Enverus’ analysis of manifests from US Customs and Border Patrol. As of today, aggregated data from customs manifests suggested that overall waterborne imports rose by more than 1.2 MMbbl/d from the prior week. The increase was driven by PADDs 3 and 5: PADD 3 imports rose by 809,000 bbl/d to 1.57 MMbbl/d while PADD 5 imports rose by 476,000 bbl/d and PADD 1 imports fell by 83,000 bbl/d.
- The numbers for the previous week were significantly impacted by fog, and we’ve seen a surge of imports this week as the backlog cleared. Overall waterborne crude imports were at their highest level since the week of Dec. 6. Imports from Saudi Arabia hit their highest level since June.