[contextly_auto_sidebar]
CRUDE OIL
- Crude oil futures trended higher over much of last week but lost ground on Friday amid renewed concerns over the spread of the COVID-19 virus. April WTI settled Friday at $53.38/bbl, a $0.50 drop from the day before, and is down more than 4% this morning. Outbreaks in South Korea, Italy and Iran have taken the market’s focus off of China, where the number of new cases continues to slow and economic activity has been on the mend. Meanwhile, negotiations in Geneva between Libya’s two warring factions appear to be making progress, raising the possibility that close to 1 MMbbl/d of production may be restored in the coming weeks. Talks resumed late last week after being briefly suspended when one of the parties, the UN-backed Government of Accord, withdrew after the port of Tripoli was shelled by the Libyan National Army. A draft ceasefire agreement is currently under review by both factions’ leadership.
- The Energy Information Administration posted a lukewarm inventory report last week. Commercial crude oil inventories increased marginally by 0.4 MMbbl for the week that ended Feb. 14, while total gasoline stocks drew by 2.0 MMbbl. Distillate inventories also posted a modest draw of 0.6 MMbbl, but kerosene-type jet fuel stocks built by 0.7 MMbbl. Total petroleum inventories were down by 1.0 MMbbl versus the previous week.
- The Commodities Futures Trading Commission reported that managed-money long positions in WTI futures dropped another 12,887 contracts to stand at 223,429 contracts the week that ended Feb. 18. Managed-money short dropped by 5,817 contracts to reach 118,106. The ratio of managed-money longs to shorts remains just under 2:1.
NATURAL GAS
- US Lower 48 dry natural gas production decreased 0.40 Bcf/d last week, based on modeled flow data analyzed by Enverus, largely due to production decreases of 0.25 Bcf/d in the East and 0.17 Bcf/d in the South Central region, while Canadian imports decreased by 0.13 Bcf/d. Res/Com demand saw a drop of 0.48 Bcf/d on the week, while power and industrial demand decreased by 0.65 Bcf/d and 0.12 Bcf/d, respectively. LNG export demand was flat on the week, while Mexican exports gained 0.11 Bcf/d. Weekly average totals show the market dropping 0.52 Bcf/d in total supply while total demand fell by 1.20 Bcf/d last week.
- The storage report for week that ended Feb. 14 showed a draw of 151 Bcf. Total inventories now sit at 2.343 Tcf, which is 613 Bcf higher than a year ago and 200 Bcf above the five-year average for this time of year. With the decrease in demand outpacing the decrease in supply, expect the EIA to report a similar to slightly weaker draw next week.
- Current weather forecasts for the 6- to 10-day period from the National Oceanic and Atmospheric Administration’s Climate Prediction Center show below-average temperatures along the East Coast into Florida, while temperatures are expected to be above average from the Midwest to the West Coast. In the 8- to 14-day period, the above-average temperatures extend to the East Coast, resulting in the entire Lower 48 showing normal to above-average temperatures.
- Price strength was seen last week as weather forecasts changed to show below-average temperatures in high-demand areas. After the storage report on Thursday, prices briefly broke above the $2.00/MMbtu mark, but they could not hold and ultimately closed the day at $1.92. Weather forecasts over the weekend turned dramatically warmer, causing prices to fall this morning to $1.854 as of this writing, down from the Friday close of $1.905.
- As we near the end of the winter season and head into March, temperatures start to warm, causing less heating demand, and an extended cold shot will likely not show as much price volatility as it would in January and February. Despite the bearish market sentiment, a rally may appear with the expiration of the March contract. History shows that price rallies typically happen with contract expiration. Although weather forecast changes likely won’t have the same volatility impact they would have earlier in 2020, continue to monitor these changes for explanations to price changes.
NATURAL GAS LIQUIDS
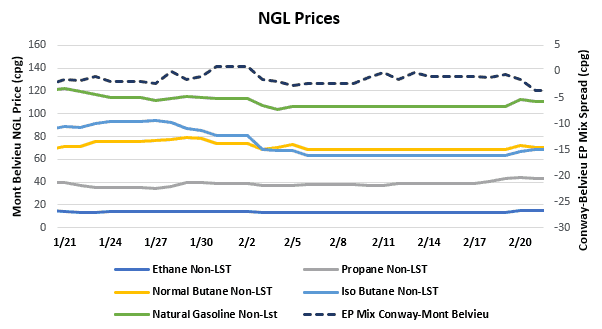
- Purity product prices were up across the board last week. Ethane gained $0.004/gallon to $0.136, propane jumped $0.033/gallon to $0.411, normal butane gained $0.007/gallon to $0.694, isobutane inched up $0.007/gallon to $0.644, and natural gasoline increased $0.013/gallon to $1.078.
- The EIA reported a draw of propane/propylene stocks for week that ended Feb. 14, resulting in a 3.01 MMbbl inventory decrease. Stocks now stand at 74.26 MMbbl, which is 19.66 MMbbl higher than the same week in 2019 and 18.37 MMbbl higher than the five-year average. The five-year average draw for next week’s report is 1.61 MMbbl, while the same week last year saw a draw of 1.19 MMbbl.
SHIPPING
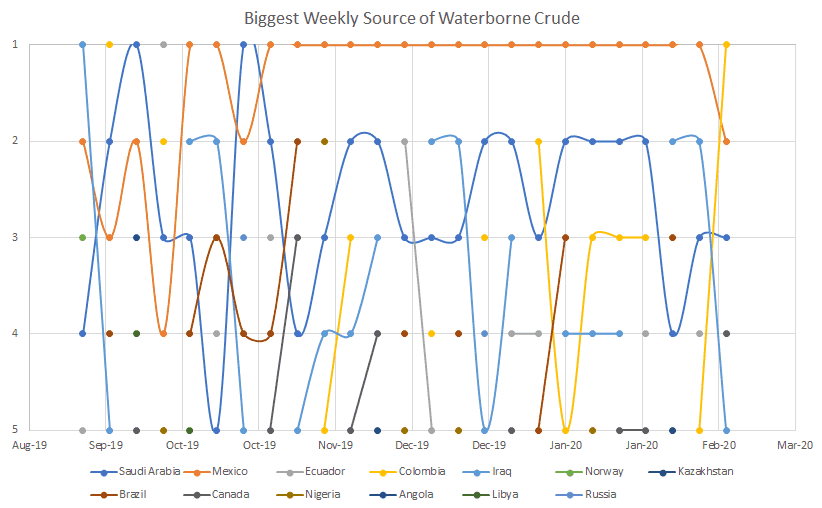
- US waterborne imports of crude oil rose last week according to Enverus’ analysis of manifests from US Customs and Border Patrol. As of this morning, aggregated data from customs manifests suggested that overall waterborne imports rose by 34,000 bbl/d from the prior week. The increase was driven primarily by PADD 5, which saw a 166,000 bbl/d in shipments, partially offset by a 137,000 bbl/d drop at PADD 3. PADD 1 imports increased by 5,000 bbl/d.
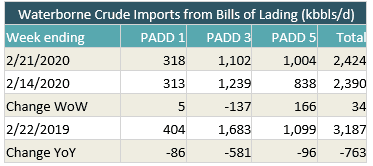
- Colombia was the largest source of waterborne crude imports for the week, the third time this happened since 2017. The largest importer of these barrels was Chevron’s El Segundo refinery in California, which took a million barrels of Vasconia. Coming in second was Phillips 66’s Sweeny refinery in Texas, which imported more than 525,000 bbl of Castilla Blend, and in third was Citgo’s Lake Charles refinery in Louisiana with a similar amount of Vasconia.