[contextly_auto_sidebar]
CRUDE OIL
- Front-month WTI futures ended last week on a high note, settling at $28.34/bbl on renewed talk of a globally coordinated production cut. However, renewed bullish sentiment was dealt a blow over the weekend due to a spat between Saudi Arabia and Russia over whom is to blame for last month’s failed OPEC+ meeting. Initial talks were planned to begin today, but have been moved to Thursday, April 9. The goal of the negotiations is to reduce oil production by 10%, which is going to require broader participation of non-OPEC countries than under the existing OPEC+ framework. However, time is running out and it remains to be seen how the United States, the world’s largest oil producing country, is going to participate. Without swift action, the US could end up bearing the brunt of the forced shut-ins. Recognizing the urgency of the situation, President Donald Trump sought to raise the stakes for Saudi Arabia and Russia by threatening to impose “very substantial tariffs” on imported oil.
- The Energy Information Administration last Wednesday reported a 13.8 MMbbl increase in nationwide commercial crude inventories for the week that ended March 27. Cushing inventories moved up by 3.5 MMbbl and stocks in PADD 3 surged by 6.5 MMbbl. Despite the 0.9 MMbbl/d drop in crude runs, nationwide gasoline stocks still ramped up by 7.5 MMbbl as demand for the fuel dropped by 2.2 MMbbl/d versus the prior week. Distillate inventories, in contrast, drew by 2.2 MMbbl. Total petroleum inventories were up by 21 MMbbl.
- The Commodity Futures Trading Commission last week reported a net increase in managed-money NYMEX light sweet crude futures. Long positions increased by 23,108 contracts to stand at 166,671. Similarly, managed-money short positions added 21,966 contracts to end at 100,469.
NATURAL GAS
- US Lower 48 dry natural gas production increased 0.28 Bcf/d last week, based on modeled flow data analyzed by Enverus, mainly due to a 0.15 Bcf/d increase in the East region. Canadian net imports decreased 0.77 Bcf/d largely due to decreased imports in the northern Midcontinent and the Pacific Northwest. Demand decreased across the Res/Com, power and industrial sectors last week, falling 4.47 Bcf/d, 2.66 Bcf/d and 0.41 Bcf/d, respectively. LNG export demand increased 0.04 Bcf/d, while Mexican exports fell 0.14 Bcf/d. Weekly average totals show the market dropping 0.50 Bcf/d in total supply while total demand fell by 7.87 Bcf/d.
- The EIA storage report for the week that ended March 27 showed a draw of 19 Bcf. Total inventories now sit at 1.986 Tcf, which is 863 Bcf higher than at this time last year and 292 Bcf above the five-year average for this time of year. With the decrease in demand outpacing the decrease in supply, expect the EIA to report the first injection of the year this week. The ICE Financial Weekly Index report currently predicts an injection of 27 Bcf for the week that ended April 3.
- Current weather forecasts for the six- to 14-day period from the National Oceanic and Atmospheric Administration’s Climate Prediction Center show below-normal temperatures across the US, besides in Florida and California. However, these below-average temperatures are not likely to significantly prop up heating demand, as below-average temperatures this time of year do not cause nearly the demand impact as in January.
- Rigs continue to fall off the map as operators are slowing their drilling plans amid a lack of demand due to COVID-19 and the vast oversupply in the market. From March 5 to April 5, the US has fallen from 809 rigs to 632 rigs, based on Enverus’ Daily Rig Count. On a percentage basis, the biggest drop has been in the DJ Basin which dropped 9 rigs, or 35%. The Permian has been the main driver of the 177-rig drop, falling 75 rigs (-19%) over the past month.
- As liquids storage fills up—which might very well happen in the near future—shut-ins are likely to take place. These shut-ins will be heavily reliant on variable operational expenses among individual wells. The more expensive wells to operate have a higher likelihood of being shut in during the current low-price environment. Looking at opex by basin can provide an understanding of where associated gas is likely to fall off first due to shut-ins. In Enverus’ latest FundamentalEdge series, “The Dark Side of the Boom,” opex was analyzed regionally to understand what these costs look like across major US basins.
- Natural gas storage inventories are currently expected to end the injection season well above average levels. However, should operators start shutting in production, this will take away additional associated gas supply, and the end of injection season inventories will be revised down from current expectations.
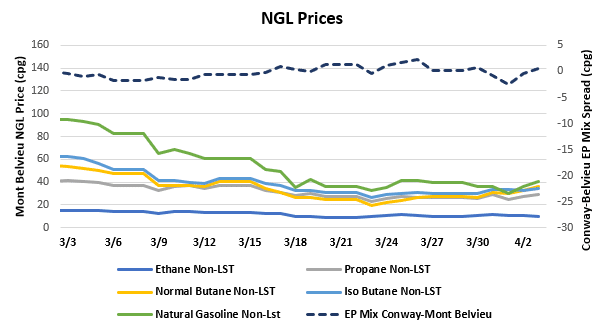
NATURAL GAS LIQUIDS
- For the most part, NGL prices saw an uptick last week as oil prices surged more than 30% and gas prices held relatively steady. Ethane gained $0.004/gallon to $0.106, propane increased $0.013/gallon to $0.272, normal butane gained $0.074/gallon to $0.312, and isobutane gained $0.036/gallon to $0.328. Natural gasoline was the only product to fall on the week, dropping $0.022/gallon to $0.357.
- Natural gasoline (C5) has taken a big hit in pricing alongside gasoline and naphtha due to the lack of demand resulting from COVID-19. Gasoline is regulated by the Environmental Protection Agency, and the winter-grade gasoline was scheduled to stop being sold on May 1, after which only summer-grade supplies could be sold. The EPA has pushed back this date to May 20 to help the storage tanks deplete some of the winter-grade supply. The EPA will continue to monitor this situation and will extend the date past May 20 if needed.
- The EIA reported a draw of propane/propylene stocks for week that ended March 27, with inventories decreasing 251,000 bbl. Stocks now stand at 64.67 MMbbl, which is 11.47 MMbbl higher than the same week in 2019 and 14.43 MMbbl higher than the five-year average. The five-year average for next week’s report is a build of 433,000 bbl, while the same week last year saw a build of 1.17 MMbbl.