
Inventory scarcity is no longer a distant concern; it’s here, and it’s reshaping upstream strategies. As Tier 1 inventory dwindles and energy demand rises, operators face mounting pressure to discover, extend and optimize resources in increasingly complex environments. The subsurface lies beneath it all, waiting to be solved and optimized as the key to delivering energy resources. Energy professionals and geology teams aim to navigate these challenges, deliver smarter decisions, and find new ways to produce oil and gas.
The Inventory Challenge Across the Energy Industry
The struggle is real. Across the value chain, inventory scarcity is creating ripple effects:
- Operators: Paying more for less, exploring riskier zones, and pushing into Tier 2 and 3 plays.
- Finance teams: Struggling to value assets confidently and reduce technical risk.
- Mineral owners: Facing uncertainty around future drilling and royalty income.
- Oilfield services (OFS): Forecasting demand in an ever-shifting landscape.
The common thread? Everyone needs accurate, integrated subsurface data to make informed decisions.
Why Subsurface Data Quality Matters More Than Ever
The only way to make smarter decisions from the ground up means good data and quality foundational building blocks for smarter subsurface decisions. Every geologist knows it is critical to have:
- QC’d, interpretation-ready well logs and formation tops for consistent geological comparisons.
- Structure and property maps to optimize well placement and identify refract candidates.
- Benchmarking tools to compare reservoir quality versus production potential.
These features are the non-negotiables in Enverus Geoscience Analytics, the only solution that gives you the full energy landscape in one place to unearth hidden patterns, make confident decisions and optimize your exploration and evaluation workflows with Enverus analyst-interpretations, advanced analytics and machine learning.
As one geoscientist put it:

I’ve been using Enverus PRISM® to compare the quality of rock that competitors are in and see how we compare to that in similar rock and the productivity of those wells compared to others. It’s really helpful for the benchmarking we need to do.

Expanding Horizons
Inventory expansion isn’t just about drilling deeper, it’s about thinking broader:
- Stratigraphic expansion: Screen Tier 2 and 3 zones using interpretive formation tops and geogrids.
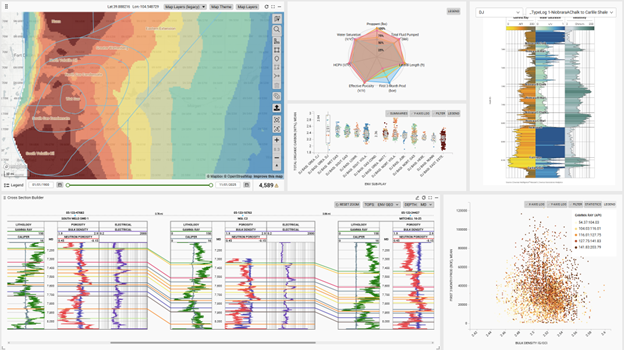
- Geographic expansion: Push into fringes and emerging plays with Essentials Plus logs and the new cross-section builder in PRISM.
A VP of Geosciences summed it up:
“I like how clean the logs are within Essentials Plus. The QA/QC done saves me a lot of time by not having to do the work as well as not needing to use state-reported logs.”
Advanced Interpretation Tools and Faster Research Insights
Having the right interpretation products that work quickly makes for actionable intelligence:
- PRISM Instant Analyst™: Quickly summarize reservoir characteristics and correlate variables for smarter decisions.
- Cross Section Builder: Visualize subsurface changes across acreage, accessible even for non-geologists.
See how one geology team uses these tools to accelerate modeling:
“It was a crutch for me to bring in your reservoir characterization table into my model, which allowed me to turn on data alongside our own mapping. It’s nice to have a third-party reference point.”

Global Perspective vs U.S. Shale?
International operators are leveraging U.S. shale analogs to reduce risk and optimize strategy. The push towards global resource expansion is gaining momentum and attention from operators and investors alike.
An international operator shared:
“Even after four years of play development, PRISM remains essential. We rely heavily on analogs like the Haynesville and Marcellus to guide our approach.”

What’s New and What’s Next
Enverus Geoscience Analytics had a big year:
- Cross Section Builder in PRISM was launched for you to create quick subsurface visualization, exactly where you need it.
- Continuously expanding our well log library; we have added LAS to over 35,000 wells so far this year!
- Formation tops across CCUS plays, the San Juan Basin, Barnett and Woodford formations in the Permian, the Central Basin Platform, the Midland Eastern Shelf, the Uinta, and the Cherokee play in the Western Anadarko Basin.
- More Cross Section Images and Type Logs in Tier 2–3 areas for a rapid basin overview and quick understanding.
- New Geo Grids in the Central Basin Platform and Uinta provide insights on how the subsurface could influence the future of the plays and understand historical production.
- Standardized reported formation tops from state data, for easier use of reported data, consolidating thousands of nomenclature terms to a simplified structure.
Coming soon:
- Even more logs will be available to use in the Cross Section Builder as wells as continued development for even more customization.
- Canadian and Western Haynesville formation tops will be added, based on customer interest and feedback.
- New and updated Geo Grids in the Permian and Uinta, as we continue to add more data and refine our expert interpretations.
Why Deep Geoscience Knowledge Matters to Operators
Enverus Geoscience Analytics is more than a dataset, it’s Enverus’ strategic lens on the subsurface. By delivering fast, integrated geological insights, Geoscience Analytics helps extend inventory life, reduce risk and improve capital efficiency in a market where every decision counts.
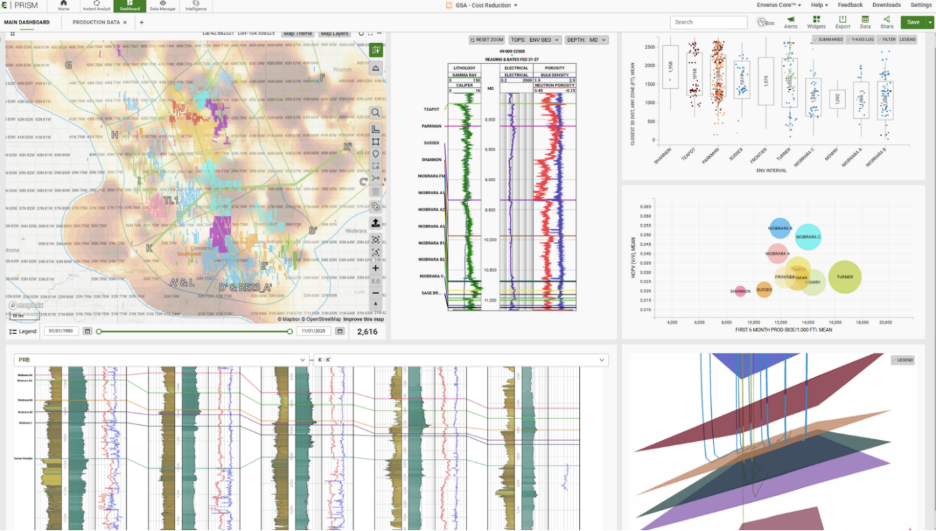
Ready to see how GSA can help you tackle inventory scarcity?
Explore the latest features in PRISM or contact us for a demo today.