Where are these Texas wind turbines everyone is talking about that keep the ERCOT power grid going? Who owns these wind farms in Texas? How much power is generated by these assets in the state of Texas today?
We can answer all these questions and more in Enverus Power & Renewables’ latest tool for renewable energy developers, investors and market analysts — Project Tracking Analytics.
Before we delve into Texas and the market dynamics at play, let’s start by clarifying how our new platform works. With Enverus’ Prism™ platform, it is now possible to view traditional energies data sets such as well data, permits and activity analytics, alongside the various Foundations | Power & Renewables data.
With the correct Power & Renewables permissions, users can filter power plants, power production data, substation and transmission data.
The wind power boom in Texas and growing solar capacity add-ons
To start our use case of Texas wind power plants and renewable project tracking analytics, we will begin by showing project capacity by the mix of the different energy sources that have come online.
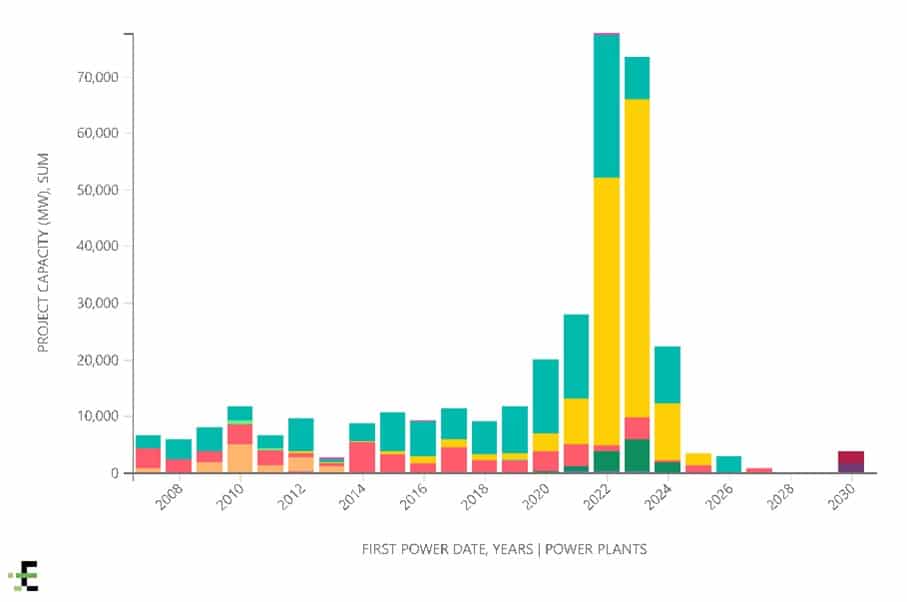
Figure 1 | Texas power plants and the changing mix of generation fuels powering ERCOT’s grid.
Historically, coal and natural gas made up the majority of generation fuels for power plants. However, over the past five years there has been a huge push towards wind. Wind (turquoise bars) has become a much larger part of the mix of new power plant capacity coming online. And what is interesting is how much solar (yellow bars) is projected to possibly come online in the future. Solar is projected to take a large part of the future energy mix.
Taking a closer look at the actual volume or the actual capacity projected to come online, it’s apparent that there’s an abundance of megawatt capacity planned in the next several years.
We don’t need that much capacity. So, what this means is that there are a lot of projects out there that are at risk of never making it past the planning or subsequent stages.
Picking the winners and losers in wind energy project development and investment
Because there is so much capital and so much interest in this space, project developers and investors must be able to pick the winners to be successful. Most developers only make it to the finish line on one of every five projects in their portfolio.
As the renewable energy market continues to boom in Texas, there is an abundance of new project developers rushing into the space. This makes it so much more important to have the data to be able to understand what these projects are, where they are in their lifecycle, who is building them, and with what economics will be key not just for the project developers, but also the investment community.
Filtering for operating power plants and the biggest players in wind power in Texas
Our next step in analyzing the Texas wind power market leads to a widget displaying operating wind assets in Texas (view the video above to see the full workflow).
Within seconds, Project Tracking Analytics shows us that NextEra is the largest owner of operating wind capacity in Texas today. Using the power plant card function, we can view all the important details that project developers, investors and analysts need to know when scoping out a plant:
- Construction start date.
- Plant operating start date.
- Plant operating capacity.
- Owner(s) of the power plant.
- Project developer.
- Power purchaser details.
- Power contract price and length.
- Power contract volumes.
With these details, users can begin to analyze and forecast whether a power plant will get the rate of return its investors are targeting.
Additionally, users can identify wind turbine suppliers for various projects and who the engineering, procurement and construction (EPC) partners are on projects. These tools help users understand who the big players are and which companies provide services to larger projects.
So much of the information that Enverus provides in its Power & Renewables platform is incredibly difficult to gather. This data does not exist in sources that are easy to scrape. That means our analysts are synthesizing those disparate, disorganized data sets to produce this tabular format. Also, every project is tagged with any of the documents that they collect, along with notes regarding where the project information’s coming from, what the anticipated operating data is, etc.
This is invaluable information for project developers, renewable energy investors and EPCs. We hope we can show you more ways that the tools will benefit your workflows. You can book a preview of our solution with us here.