
A substation may appear viable, but it can delay energization long after a site looks viable. Ensure the MW in your site screen matches the MW in your investment case by validating power availability, power economics, interconnection risk, and energization timelines before committing capital.

20-YR
Hourly nodal power pricing
modeled through 2046
25+
Years saved
in engineering time spent on developer client siting and sizing studies in 2025
60K
Buses
for system-wide large load prospecting in MISO, SPP, PJM, WECC and ERCOT
Power, development and investment teams all need confidence that a site can be energized on time, at the required MW and at a cost the project can support. Enverus provides the data to validate capacity, costs, energization timing, and interconnection risk before capital is committed.

Avoid tying up technical resources on sites that cannot support the target load. Audit substation headroom, queue depth, and interconnection risk to safeguard energization schedules.

A parcel can clear every land criterion and still fail on deliverable MW. Screen site pipelines faster and eliminate unviable parcels before committing engineering hours.

De-risk capital allocations and validate developer market timelines against stakeholders with objective, audit-ready grid data.

Bring pre-qualified, target-MW sites to market backed by hard infrastructure evidence.
Know whether the grid can support your target load, and when it can be delivered.
The MW available on paper is rarely the MW available in practice. Evaluate withdrawal capacity, transmission constraints, competing load growth, and interconnection feasibility to understand both how much power is available and when it can realistically be delivered.
Dual-methodology withdrawal capacity
Competing load and queue visibility
Constraint exposure
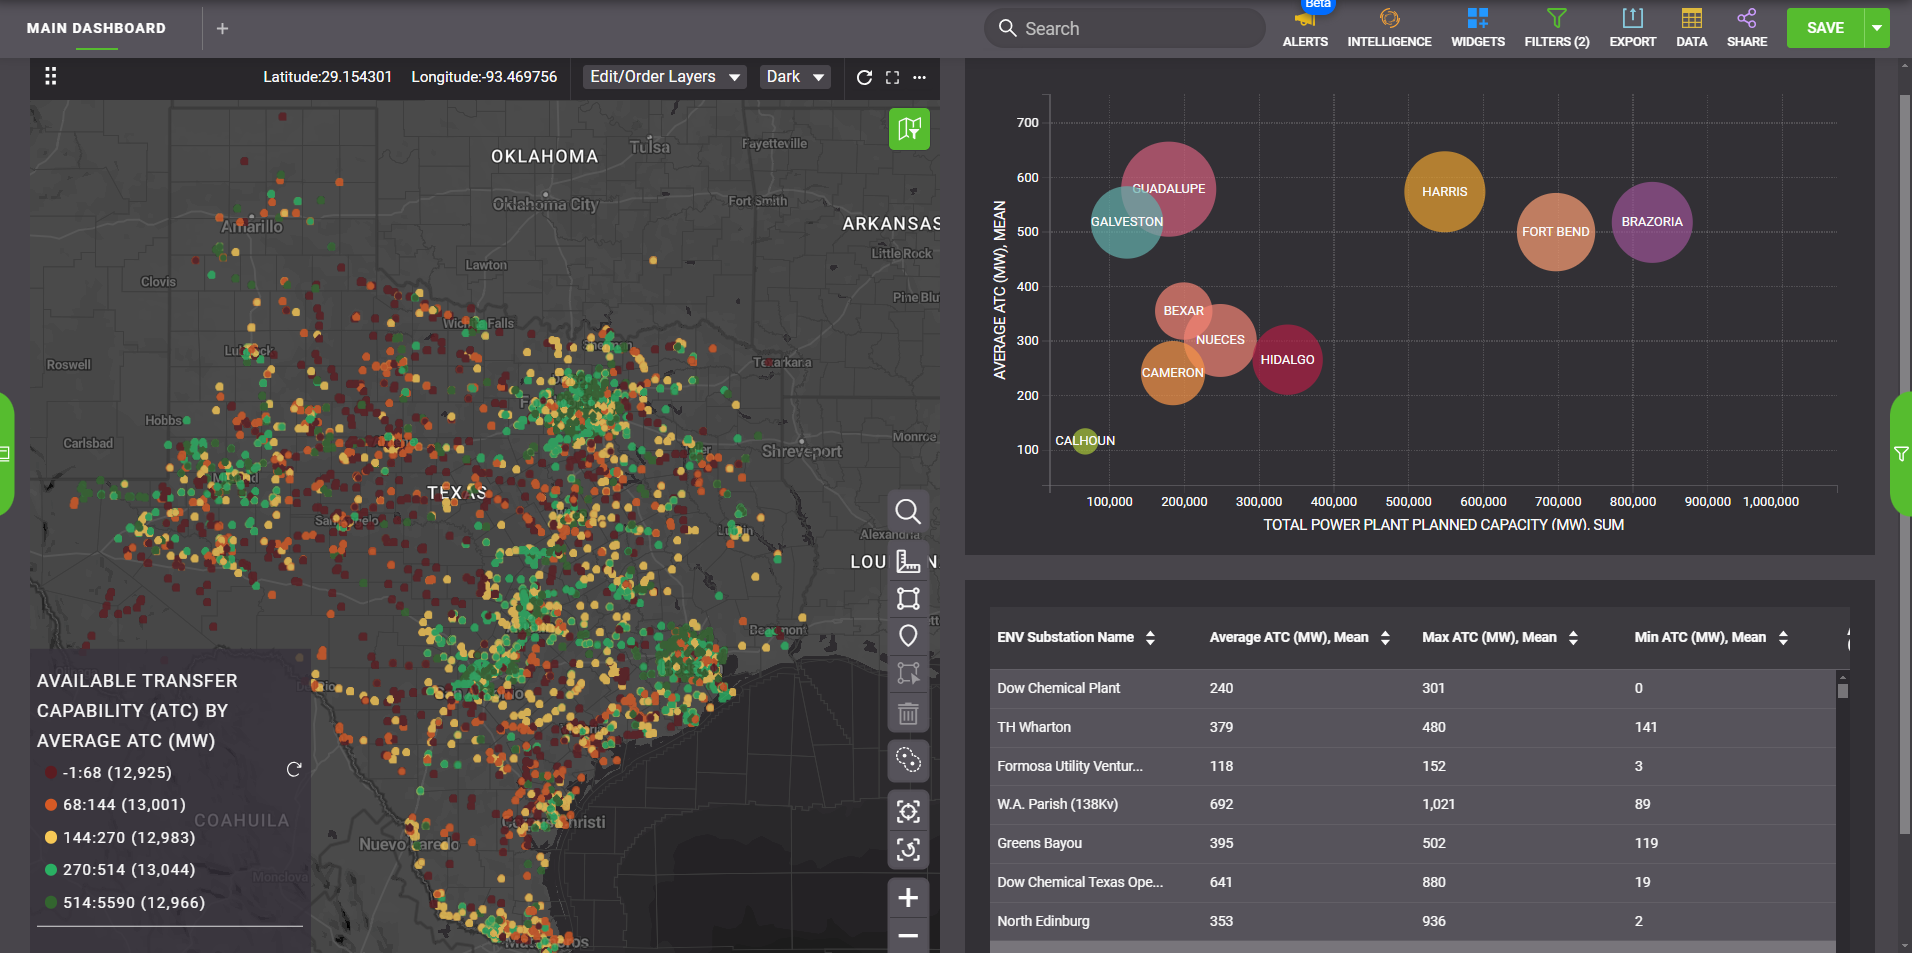
Model delivered power costs before they’re locked into the project.
By quantifying network upgrade costs, available grid capacity, and infrastructure requirements, you get the full picture before committing to a site.
Compare Grid vs. BYOG Costs
Constraint and upgrade cost detail before filing
Defensible capacity ranges using ISO-trusted technology
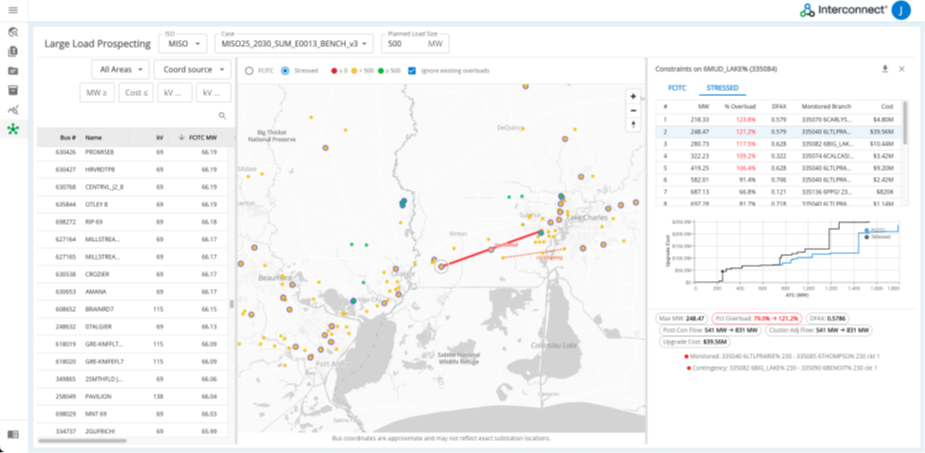
Compare power strategies before they impact cost, schedule, and reliability.
Grid power is only one path to energization. Compare utility service, upgrade costs, and behind-the-meter alternatives to identify the most timely, reliable and capital efficient way to meet your project’s power requirements.
See what's already moving in your market
Fuel availability checked at the same site
20-year price trends included in the comparison
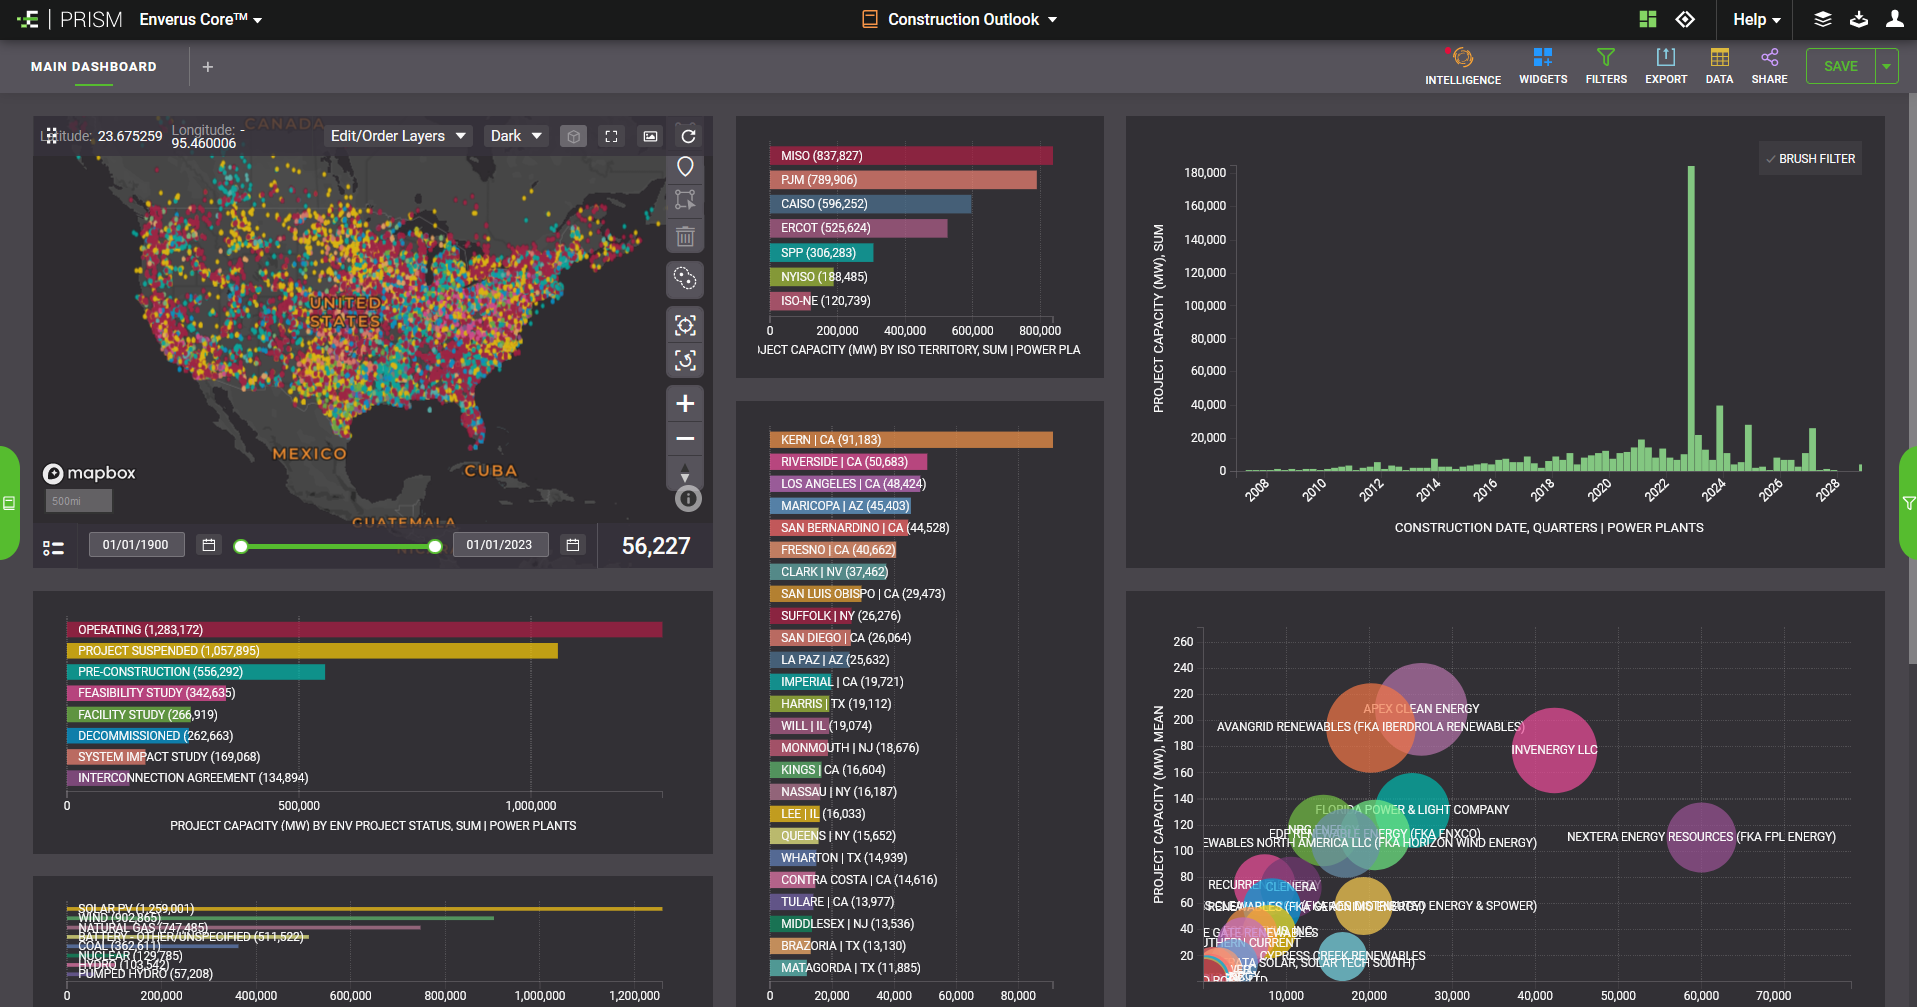
Connect with an Enverus grid specialist to see how capacity, costs, and energization timelines change your filing strategy before the deposit goes in.

Aggregated land ownership data across 156M+ parcels, filterable by acreage, vacancy, and proximity to power and gas infrastructure.
Interconnection queue depth and constraint exposure at the point of interconnection under evaluation.
Node-level locational marginal pricing to ground site economics in the actual cost of power at that node.
20-year price and load forecasts to ground a site recommendation beyond current spot conditions.
Customizable buildable acreage scoring across slope, wetlands, canopy, and flood plain constraints.
Tracks operating and planned load centers to show where competing large load is already active in a market.
Daily utilization and remaining capacity across ~30,000 interstate gas meters, tied to behind-the-meter demand.
Analyst-curated data on 100K+ projects, RFPs, and power delivery infrastructure in one foundational layer.
Historical and forward-looking withdrawal capacity at every substation under evaluation.
Live and historical visibility into 100K+ generation, transmission, and large load projects across every major ISO.
Generation and site-level valuation models and economic inputs for ranking candidate sites.
Independent, analyst-backed research and market intelligence your team can cite in a leadership or IC review.

See how Enverus called ERCOT's August 2026 coincident peak a day early and pinpointed the exact peak hour, beating ERCOT's own load forecast accuracy.
Learn how utilities, hyperscalers, and developers can score assets, align stakeholders, and structure power agreements that close faster and withstand scrutiny.

Learn how utilities, hyperscalers, and developers can score assets, align stakeholders, and structure power agreements that close faster and withstand scrutiny.

MISO hit its $10,000/MWh cap on Sept. 2 as evening load surged, solar output collapsed, and imports weakened, triggering an EEA2 alert.

A $1 million-per-MW gap separates buying gas capacity from building it. See why utilities rarely run that comparison, and what it takes to defend the answer.

Most FTR losses come from sound analysis with incomplete visibility. Learn the five pitfalls that separate winning desks from ones that explain away the losses.

Enverus identified the ERCOT July 2026 coincident peak one day in advance. See how our day-ahead forecasts outperformed ERCOT during a critical summer heat wave.

PJM's August 2026 base case sits above market on heat rate, with RGGI costs and capacity risk keeping the stack tight even as transmission relief arrives.

MISO's August 2026 outlook: softer peaks vs. July, forecast converging with the market, and new Gulf Coast gas capacity reshaping South flows.
How are you preparing for the heightened weather volatility and its impact on the energy markets? Our Power Market Analysts provide you with our yearly in-depth analysis to navigate the season upon us.
How are you preparing for the heightened weather volatility and its impact on the energy markets? Our Power Market Analysts provide you with our yearly in-depth analysis to navigate the season upon us.
With political, economic, investment and consumer sentiments in constant flux, understand how recent market shifts are influencing both U.S. and international growth in renewables.
Grid volatility caught you off guard? Discover strategies to balance load, manage congestion, and optimize assets in an unpredictable energy landscape driven by renewables, rising demand, and real-time market volatility.
U.S. power demand is expected to grow by 42% by 2050, driven by data centers, electric vehicles and industrial expansion. Explore how these changes will shape the energy landscape and influence power markets.
Get a first look at the cutting-edge technologies and strategies that are transforming the energy sector and learn how to harness this innovation in your business at Enverus EVOLVE Conference in May 2025.
Let’s get started!
Let’s get started!
We’ll follow up right away to show you a quick product tour.
Ready to Subscribe?
Ready to Get Started?