
Available land does not always translate into a viable data center site. Evaluate power availability, infrastructure, development constraints, and long-term economics in one view to identify sites that can be powered, developed, and brought online faster.

156M+
Parcels
Available to screen for buildability, infrastructure proximity, and grid access
60K+
LMP nodes
With 20-year hourly nodal price forecasts through 2046
75%
Faster
Land screening than manual GIS workflows and cheaper than the consultant study you're running today
Before land is acquired or capital is committed, multiple teams must align on the viability of a market and site. Enverus provides the information needed to evaluate opportunities from technical, commercial, and investment perspectives.
Data Center Site Selection & Land Acquisition
1
Power Procurement & Grid Strategy
2
Capital & Investment Strategy
3
Candidate sites are easy to find. Sites that can support target capacity, required infrastructure, and future expansion are harder to validate. Enverus brings market conditions, infrastructure, and parcel feasibility into one view, creating a stronger foundation for the site shortlist and subsequent technical review.

Understand not just where power exists, but how quickly it can be delivered. Enverus surfaces withdrawal capacity and load-serving ceilings at the substations already under evaluation, and pairs that with interconnection queue and constraint visibility at the point of interconnection, so grid validation starts from the same evidence the site screen produced.

A site that fails late on power or permitting can create sunk costs, schedule delays, and credibility risk with investors. Enverus provides a consistent evidence base for comparing markets, prioritizing sites, and supporting defensible go or no-go decisions.

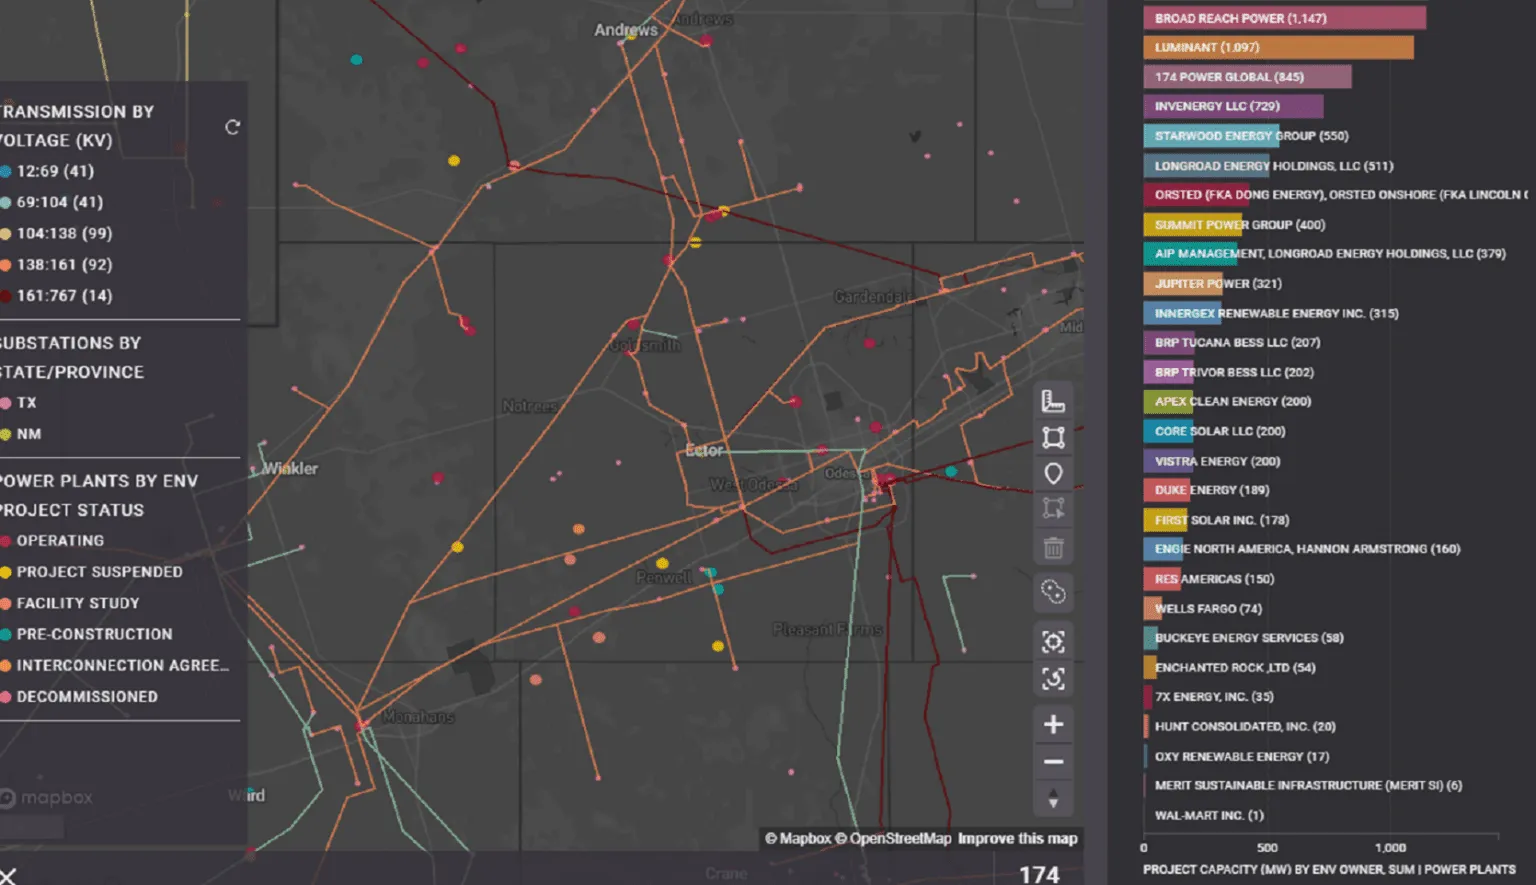
Power, infrastructure, and generation signals across every market.
Identify the markets most likely to support data center development before time and resources are committed. Track generation, transmission, load growth, utility investment, and gas infrastructure to understand where capacity is expanding, where it is constrained, and where a backup power strategy remains viable.
100K+ power plants and projects tracked by market
Utility capex and substation investment visibility
Gas infrastructure and inventory signals for BYOG
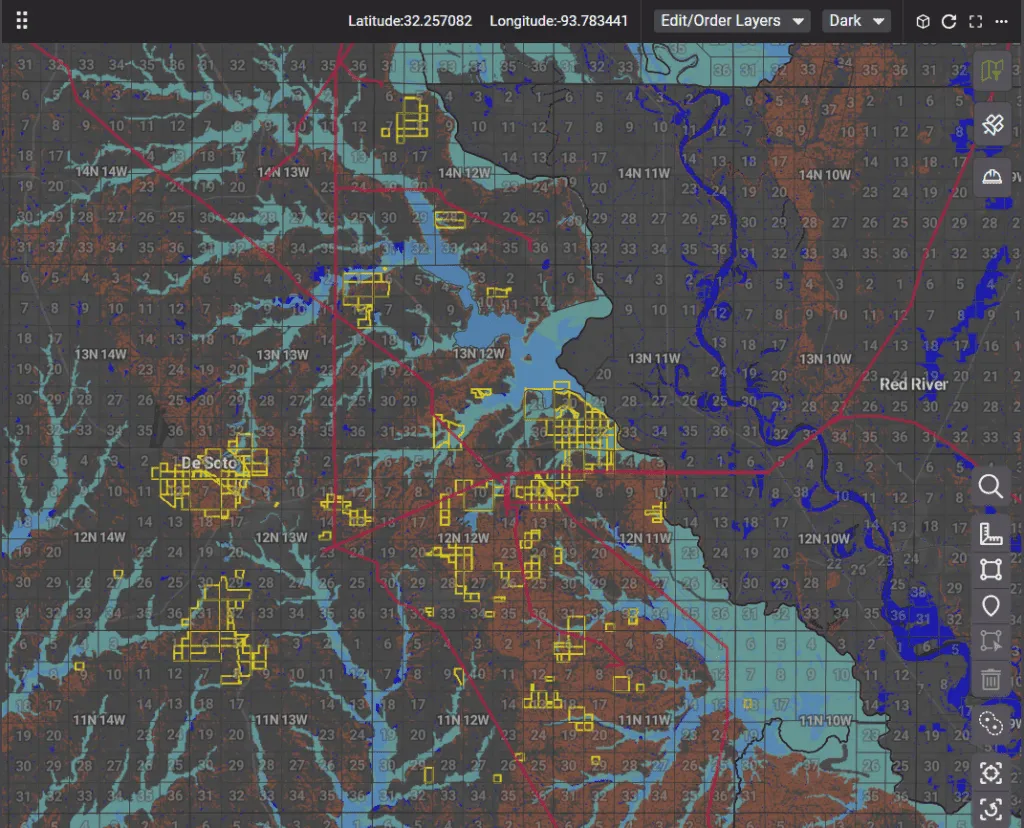
Assess development constraints and buildable acreage in one pass.
A large parcel can lose much of its usable footprint once environmental restrictions, zoning requirements and other development exclusions are applied. Screen these conditions early to remove constrained sites from consideration, compare the developable acreage that remains and enter permitting with fewer unknowns.
Understand the specific conditions limiting site development
Uncover environmental and zoning constraints early
Candidate sites ranked against consistent siting criteria
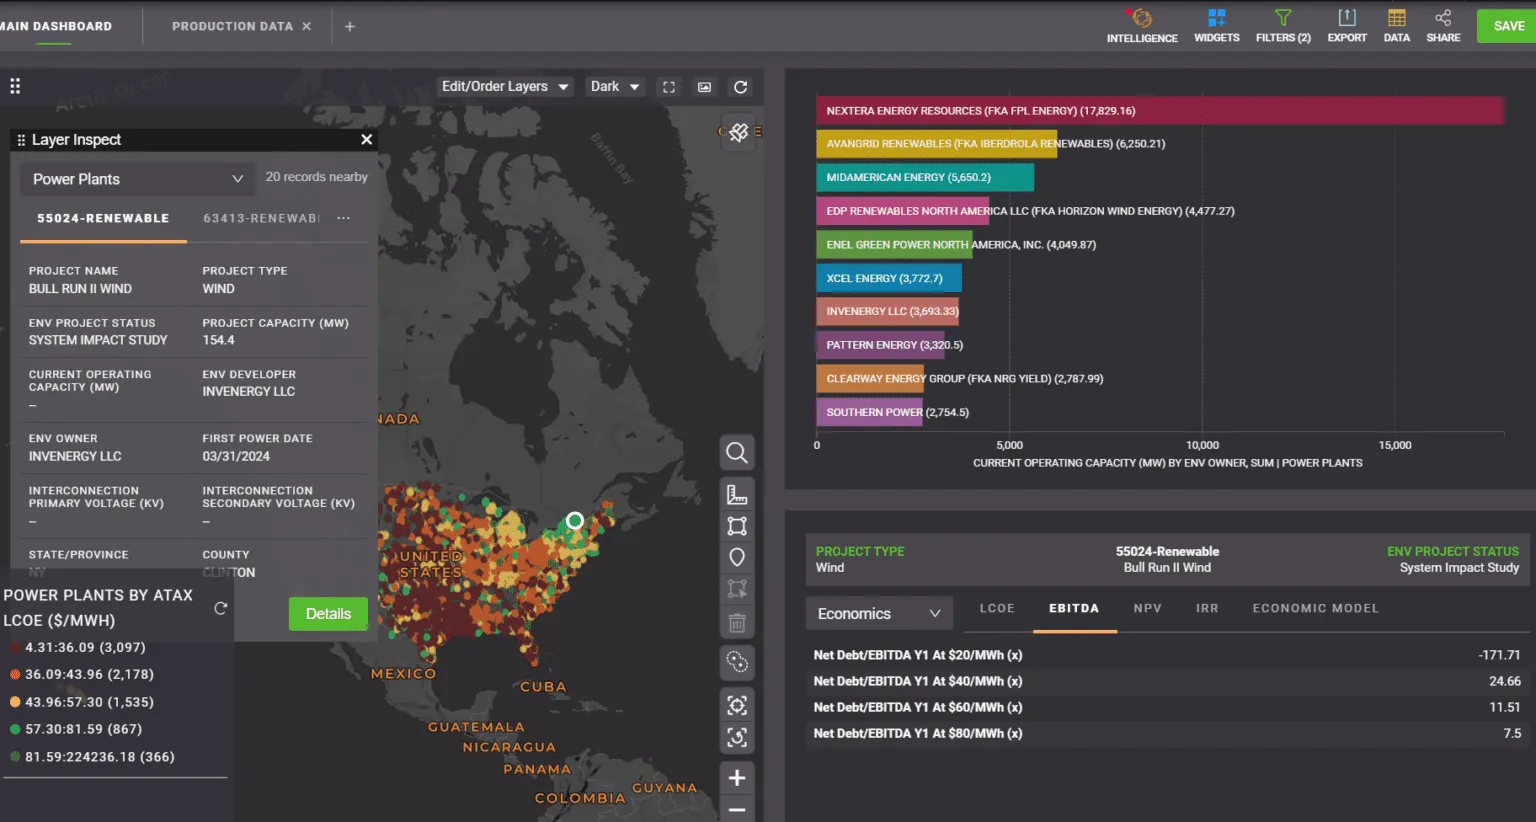
Understand the long-term cost profile of every site.
Compare candidate data center sites based on both current and future power economics. Analyze historical pricing, congestion exposure, planned infrastructure, and competing load growth to understand the long-term cost profile of each location.
Historical nodal pricing benchmarked, not point-in-time
Congestion-driven price spikes surfaced separately
Forward-looking pricing tied to planned infrastructure and load growth
Connect with an Enverus siting specialist to see how independent parcel, grid, and project tracking data change which markets and sites make your short list.
Aggregated land ownership data across 156M+ parcels, filterable by acreage, vacancy, and proximity to power and gas infrastructure.
Interconnection queue depth and constraint exposure at the point of interconnection under evaluation.
Node-level locational marginal pricing to ground site economics in the actual cost of power at that node.
20-year price and load forecasts to ground a site recommendation beyond current spot conditions.
Customizable buildable acreage scoring across slope, wetlands, canopy, and flood plain constraints.
Tracks operating and planned load centers to show where competing large load is already active in a market.
Daily utilization and remaining capacity across ~30,000 interstate gas meters, tied to behind-the-meter demand.
Analyst-curated data on 100K+ projects, RFPs, and power delivery infrastructure in one foundational layer.
Historical and forward-looking withdrawal capacity at every substation under evaluation.
Live and historical visibility into 100K+ generation, transmission, and large load projects across every major ISO.
Generation and site-level valuation models and economic inputs for ranking candidate sites.
Independent, analyst-backed research and market intelligence your team can cite in a leadership or IC review.

See how Enverus called ERCOT's August 2026 coincident peak a day early and pinpointed the exact peak hour, beating ERCOT's own load forecast accuracy.
Learn how utilities, hyperscalers, and developers can score assets, align stakeholders, and structure power agreements that close faster and withstand scrutiny.

Learn how utilities, hyperscalers, and developers can score assets, align stakeholders, and structure power agreements that close faster and withstand scrutiny.

MISO hit its $10,000/MWh cap on Sept. 2 as evening load surged, solar output collapsed, and imports weakened, triggering an EEA2 alert.

A $1 million-per-MW gap separates buying gas capacity from building it. See why utilities rarely run that comparison, and what it takes to defend the answer.

Most FTR losses come from sound analysis with incomplete visibility. Learn the five pitfalls that separate winning desks from ones that explain away the losses.

Enverus identified the ERCOT July 2026 coincident peak one day in advance. See how our day-ahead forecasts outperformed ERCOT during a critical summer heat wave.

PJM's August 2026 base case sits above market on heat rate, with RGGI costs and capacity risk keeping the stack tight even as transmission relief arrives.

MISO's August 2026 outlook: softer peaks vs. July, forecast converging with the market, and new Gulf Coast gas capacity reshaping South flows.
How are you preparing for the heightened weather volatility and its impact on the energy markets? Our Power Market Analysts provide you with our yearly in-depth analysis to navigate the season upon us.
How are you preparing for the heightened weather volatility and its impact on the energy markets? Our Power Market Analysts provide you with our yearly in-depth analysis to navigate the season upon us.
With political, economic, investment and consumer sentiments in constant flux, understand how recent market shifts are influencing both U.S. and international growth in renewables.
Grid volatility caught you off guard? Discover strategies to balance load, manage congestion, and optimize assets in an unpredictable energy landscape driven by renewables, rising demand, and real-time market volatility.
U.S. power demand is expected to grow by 42% by 2050, driven by data centers, electric vehicles and industrial expansion. Explore how these changes will shape the energy landscape and influence power markets.
Get a first look at the cutting-edge technologies and strategies that are transforming the energy sector and learn how to harness this innovation in your business at Enverus EVOLVE Conference in May 2025.
Let’s get started!
Let’s get started!
We’ll follow up right away to show you a quick product tour.
Ready to Subscribe?
Ready to Get Started?