In recent years, the oil and gas industry has witnessed a remarkable shift in focus towards environmental performance, driven by the growing importance of environmental, social and governance (ESG) considerations. Among the various environmental concerns, reducing flaring has emerged as a key priority for both oil and gas investors and operators in North America.
Why do you need to track gas flaring?
Investors: By monitoring flared volumes, investors can make informed decisions about which companies align with their environmental, social and governance criteria, thereby incorporating sustainability and responsible practices into their investment strategies.
Operators: Operators need to understand and benchmark flaring rates to help attract capital, meet regulatory requirements, improve operational efficiency and meet emission reduction initiatives.
Measuring flared gas is not easy
Flaring information is challenging to assess and aggregate, especially across sectors including production, gathering and processing. This makes it challenging to identify what is driving regional flaring rates.
While some level of flaring is unavoidable for safety reasons, avoidable flaring is viewed negatively by stakeholders. In these instances, operators have not planned their development appropriately, or the capture economics are not favorable, so instead they choose to flare the gas. Sometimes it is out of the hands of the operator, such as when a gas processing plant downstream is unable to accept volumes because of maintenance or capacity constraints, forcing the operator to flare their gas. It is almost impossible for an investor or stakeholder to understand which scenario is driving the operator to flare without satellite data.
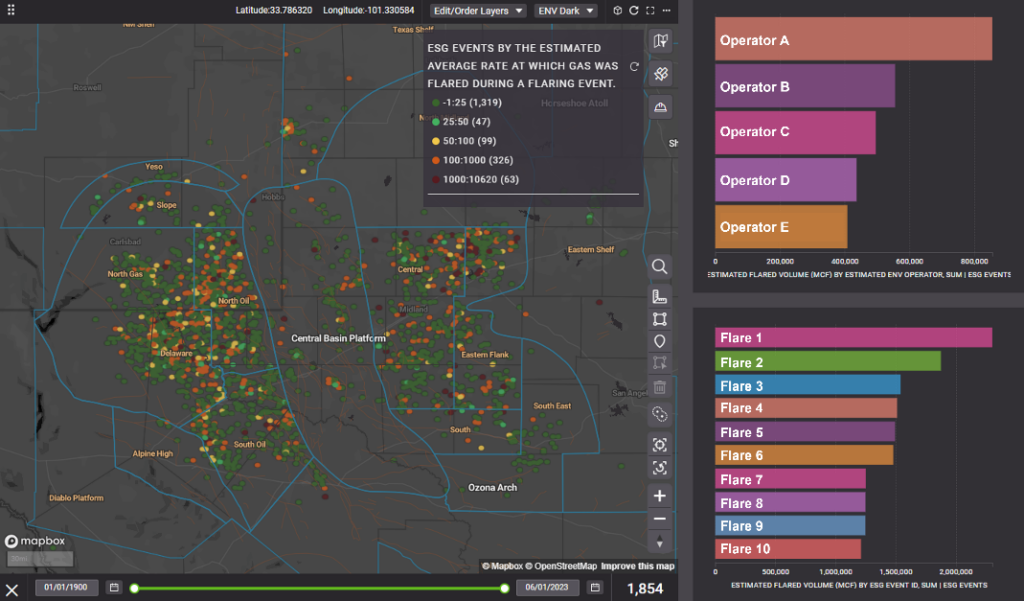
Figure 1: Estimated gas flaring events by volume in the Permian Basin. Data obtained from satellite detected flares through Enverus ESG Analytics sourced through the Colorado School of Mines.
The solution: Satellite-measured flared gas
Fortunately, satellite technology has revolutionized the way we monitor flaring activities by providing objective, third-party data across the global oil and gas industry in near-real time. With satellite detected flaring on hand, it is becoming faster to pinpoint the source, cause and volume of flared gas. This means investors can gain greater confidence in how operators are performing, and operators can more quickly benchmark and identify internal and external operational issues.
Operator vs facility ownership of flared gas example
Figure 2 shows monthly satellite detected flaring volumes in a U.S. county by estimated source. As shown in the chart, flared volumes from facilities (in pink) increased substantially from April 2022 before peaking in November 2022 and moderating in February 2023. Meanwhile, well-level flaring saw a steady increase from March through October of 2022 before peaking in January 2023 and moderating in March 2023. These trends imply that at least part of the increased well-level flaring can be attributed to third party facility capacity constraints rather than poorly managed production. This take away is important because it is less damaging to the sustainability reputations of the operators in the area.
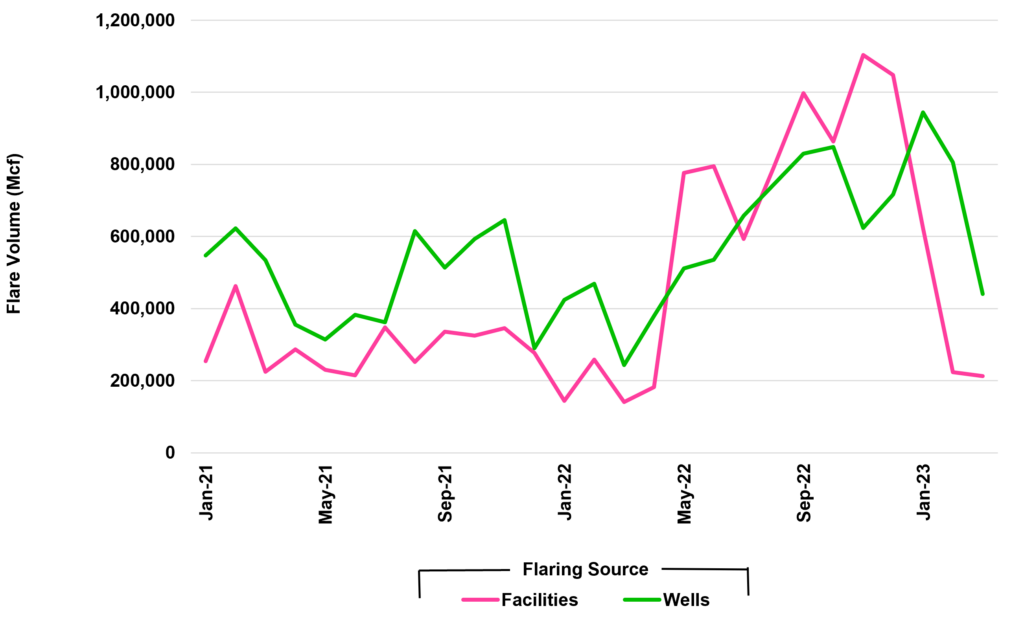
Figure 2: Flared volumes by source through time, January 2021-March 2023. Data obtained from satellite detected flares through Enverus ESG Analytics sourced through the Colorado School of Mines.
Conclusion
Satellite detected flaring is a crucial part of a complete ESG solution. Whether you are looking to make more informed investment decisions or drive sustainable business practices, Enverus ESG Analytics is a single solution for a faster, more reliable ESG analysis.
To discuss this example or learn more about Enverus ESG Analytics and satellite detected flaring workflows, download our Solution Overview, or experience firsthand as our experts analyze the environmental performance of operators in a webinar replay by filling out the form below.
ESG Analytics provides the most comprehensive, transparent view of emissions and ESG data across North America, allowing operators and investors to make more informed strategic decisions in minutes and stay ahead in carbon management strategies.