So, what really happened last year? Our title really begs the question: Why do we need a survivor’s guide to 2020 if it’s over? It is important to review last year and analyze how we can adjust moving forward. We want to demonstrate that last year was tumultuous and we are still experiencing its consequences.
In early March 2020, two major events generated significant volatility in the industry: the COVID-19 pandemic and the price war between Russia and Saudi Arabia. These events demonstrated how volatile a place the oilfield is and reinforced the idea that the industry needs to be in a healthier state to handle these situations, as it will not be the last time we experience this type of volatility.
Enverus, as well as others, have covered extensively the reasons for the drastic volatility swings, so we won’t go over all these pieces individually. The graphic below provides a timeline of last year’s volatility. You see it begin in January, ramp up in February, and then we saw that the rest of 2020 had the steepest completion activity in two years as companies looked to unload capex.
A year in review
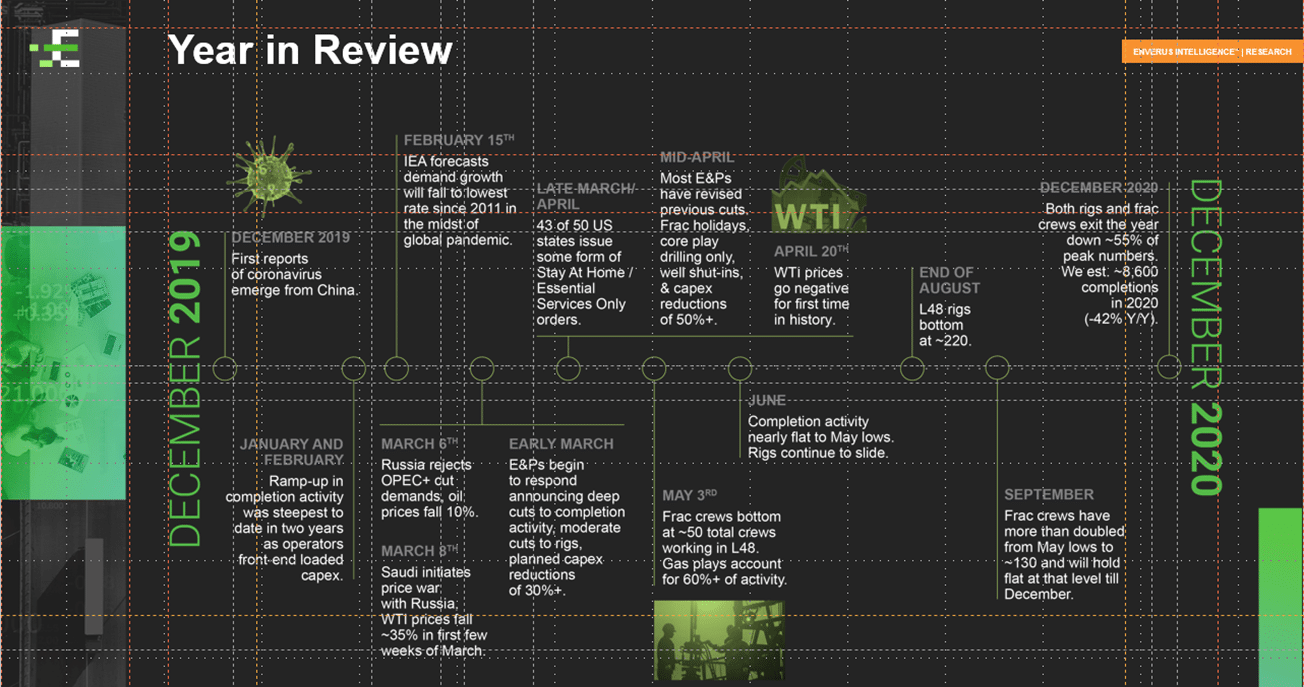
What’s not in the timeline above, but added to the volatility, is a tumultuous administration change that led to a lot of questions regarding the future of federal lands. Adding it all together, it was really a lot to take in!
First, let’s look at how the industry responded and what’s going to happen next. Then we can find out how we, as an industry, can be in a healthier place moving forward.
We’ll also discuss some of Enverus’ tools that can help you make faster and smarter decisions. The first piece comes from a general index for the oilfield service sector that the Dallas Fed puts together.
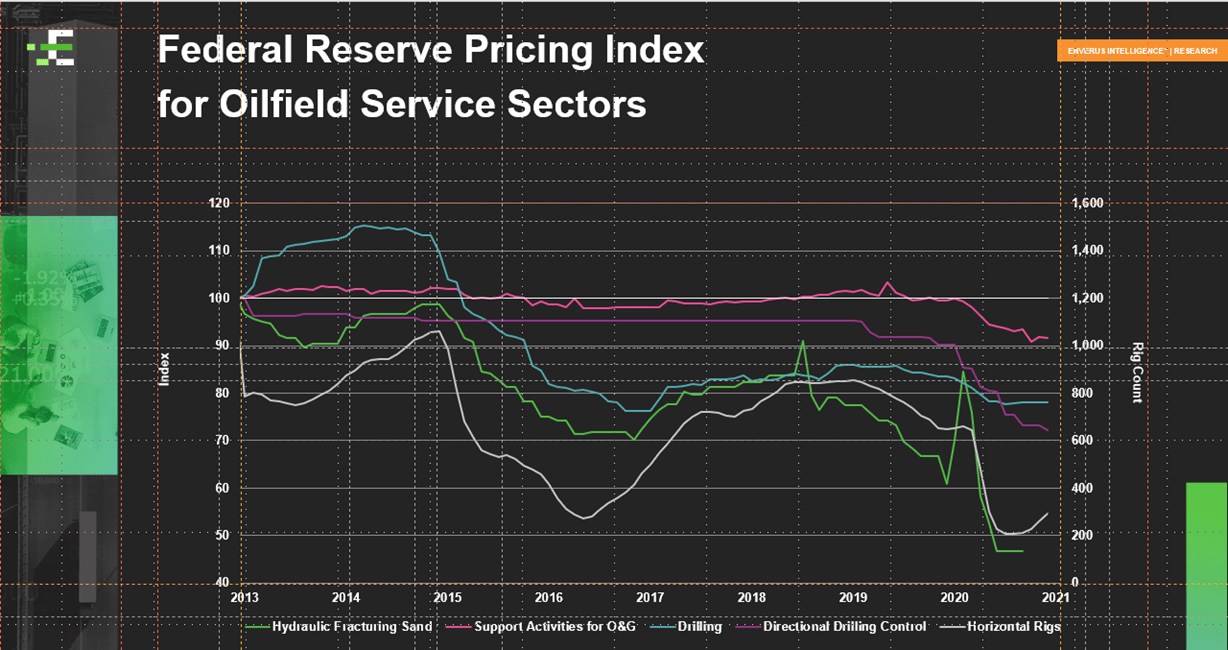
This is realized pricing throughout the sector based on survey responses throughout the year. We saw pricing and pricing support for oilfield services continue to fall throughout the year. To follow up on the general index, see below for an overview of a report written in April by Enverus’ analysts Mark Chapman and Jonathan Godwin.
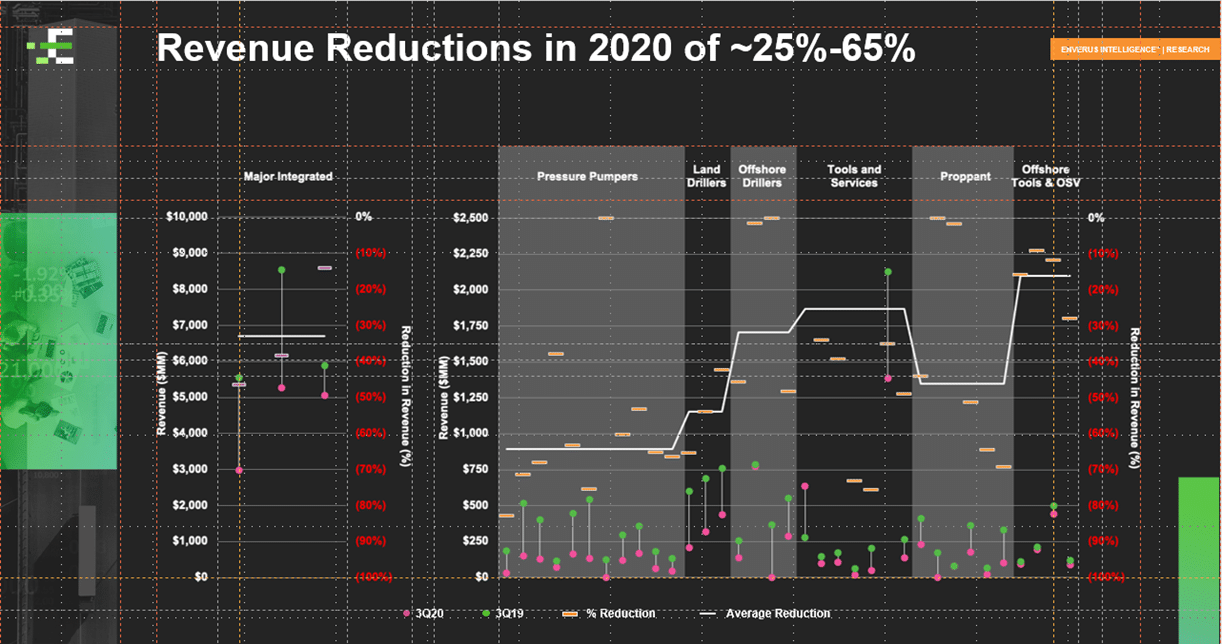
Above compares data compiled in April — where we projected and predicted revenue reductions of about 50%, based on how much capex was going to be cut and where we saw activity levels headed — versus what actually happened in the industry and how the industry responded to those different pieces. It compares 3Q19 to 3Q20, with the green and pink dots representing revenue, tied to the left axis, and the bars representing revenue reductions, tied to the right axis.
What our analysis revealed was that revenue reductions in 2020 ranged between 25-65%, leading to a 50% overall reduction. Certainly, pressure pumpers saw, on average, a 65% reduction in revenue across the board due to frac holidays and other unforeseen events. The land drillers did a little better with about a 50% reduction in revenue, as we brought rigs down throughout the year; this drop tailed the frac activity drop. Other sectors varied between that same 25-65% range.
So, as we looked at a scenario where if nothing was done and the industry lost 50% of revenue, what was going to happen to Selling, General, and Administrative (SG&A) expenses? What was going to happen to Cost of Goods Sold (COGS)? And then what was going to happen to EBITDA margins?
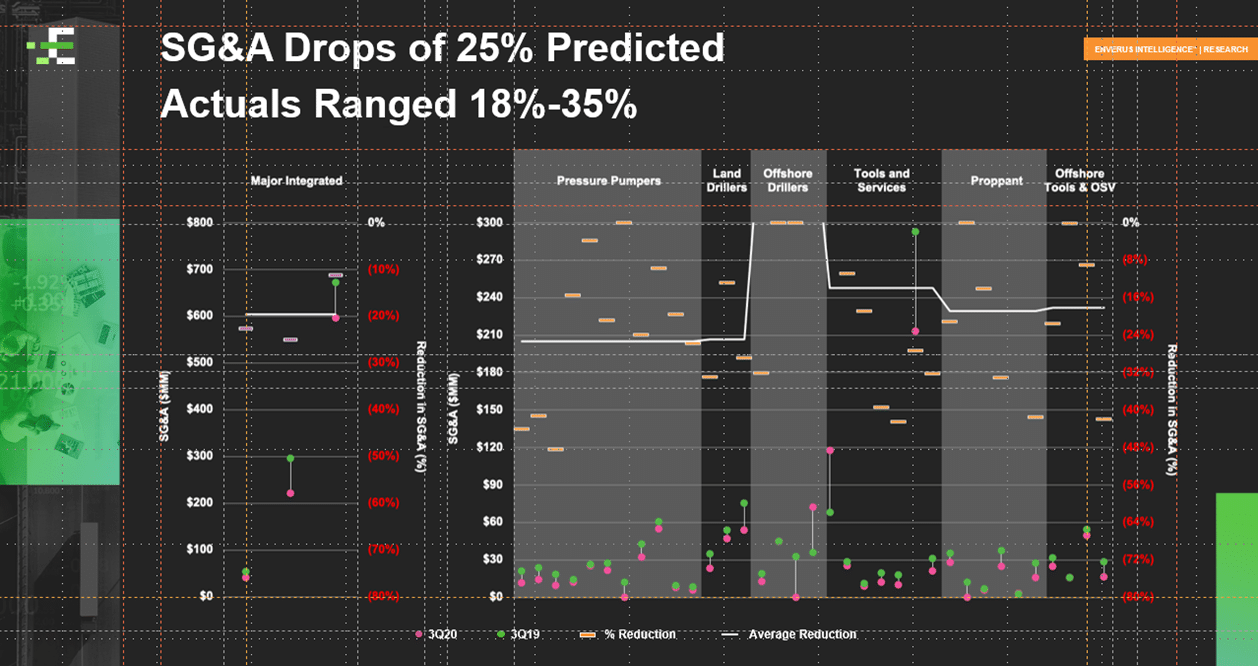
We predicted that OFS companies would have to drop about 25% to stay profitable. What we saw was a range between 18 to 35%, in line with our prediction. A great example of the OFS industry’s uniqueness is its ability to flex up and down to survive. This comes from quick responses to downturns and upturns. However, this “quickness” can be costly as over or underestimating can lead to layoffs when activity decreases versus the need to hire back when activity increases.
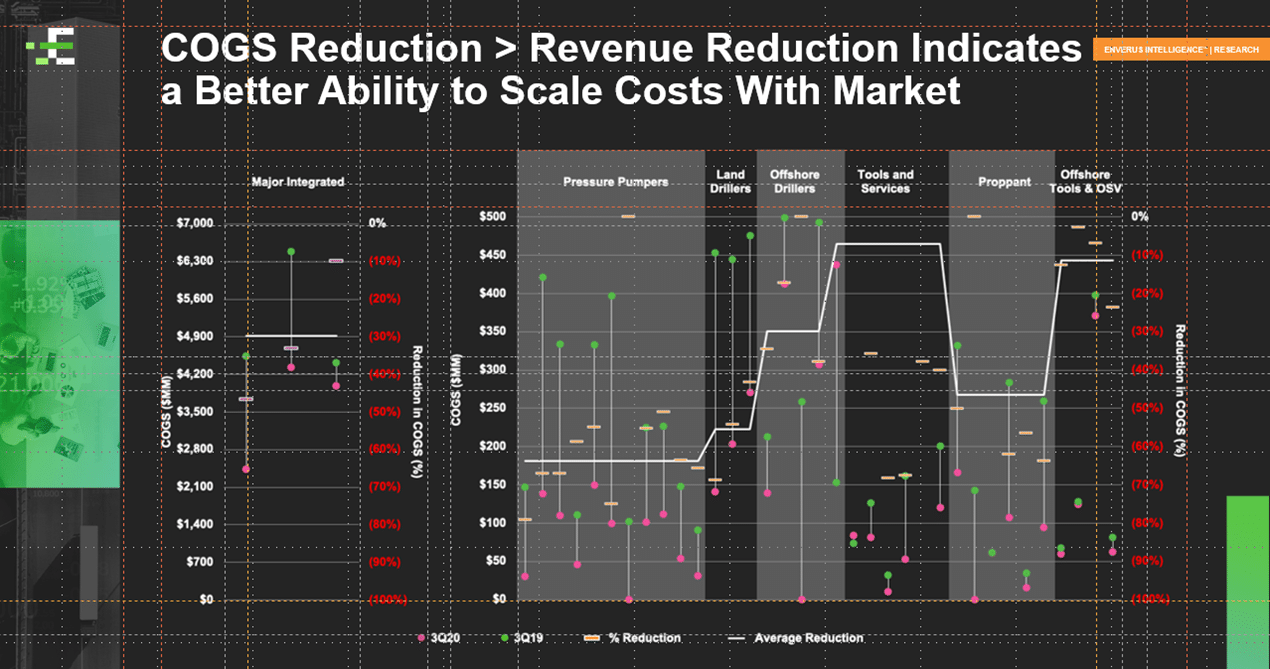
We projected COGS would be relatively in line with the revenue reductions. If we were to overlay the chart above with the revenue reductions for pressure pumpers, we see that a 65% revenue reduction mapped in line with the 65% COGS reduction. Now, if companies can have COGS reduction greater than revenue reduction, they will have a better ability to scale costs with the market. In this case, digital technologies have helped the industry be more efficient with time, people and money spent on location.
We will now evaluate EBITDA. We use it as a measure of earnings in order to level all debt and to look at what is pure profitability from how these companies operate from an SG&A and COGS standpoint.
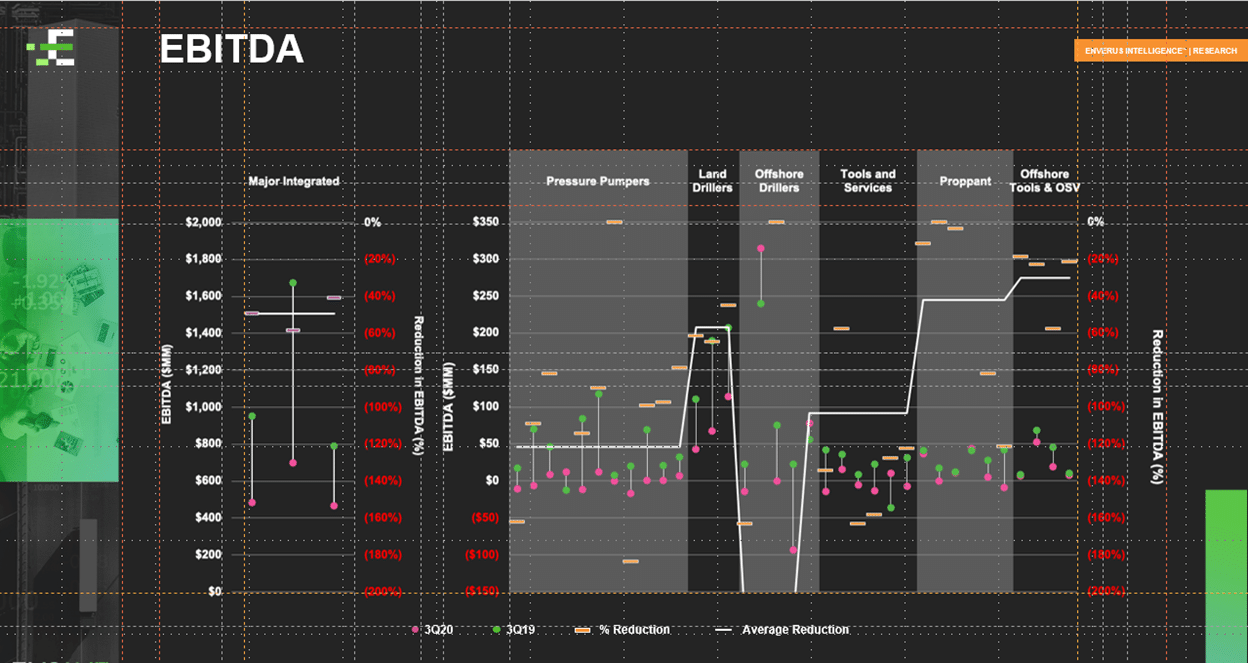
Here we see that many companies experienced an astounding EBITDA drop — greater than 100%. As an industry, we were already on the cusp of profitability considering price reductions. EBITDA was impacted when price reductions combined with the SG&A level.
Similarly, EBITDA margins show a lot of the same characteristics. We see margins remaining relatively flat for some of the major integrators; but pressure pumpers struggled through that time, while land drillers were able to maintain a fair amount of profitability. The biggest difference being the punitive clauses that land drillers included in their contracts to maintain a rig on standby, versus a frac crew being fully dropped. This shows there is a lot more volatility in that pressure pumper space, and an extra supply in that space that needs to be consolidated and rationalized. This creates the volatility we currently see in the OFS community.
Now, to answer our questions: What has happened? And how has the industry responded?
We need to understand what’s next in order to survive and thrive through another similar time period. So, let’s focus on capex and completion activity.
We expect 2021 capex and revenue to remain relatively flat year-over-year compared to 2020. We do, however, expect that capex spend will be more evenly distributed this year. In fact, we see an opportunity for capex spend to increase in the second half of 2021, a change from the past, especially in 2019, where capital expenditure efficiencies forced capex spend to be reduced in 2H2019 to the detriment of the OFS industry as activity fell off.
We are also expecting completion activity to be flat. Being one of the closest proxies to understand production, we expect companies will try to hold production flat. That means that 2021 completions will look similar to the 8,300 to 8,400 we had in 2020. This leads us to the idea that we are currently burning DUCs. From that standpoint, we are certainly outpacing the level of supply coming from rigs now, and with continued price support, rigs will continue to pick up throughout the year. Completion activity should respond quickly without a commensurate response, so we could be looking at a situation where we burn down our DUC inventory to the point where we will have to drop completion crews quickly in late 3Q and early 4Q. We should see drilling activity picking up as operators realize they will not be able to keep pace with the completions.
So, what could we have done differently and how can we now look at the market to help make decisions that would change the way businesses operate? The answer, it is essential to look at today’s market from different perspectives. A macro point of view with unique local markets and AOI perspective, that includes ESG, gives OFS companies a particular perspective to how they can partner with operators and be in the right place to find new business opportunities.
To learn more about how Enverus can help you get a unique perspective that can give you a competitive edge, fill out the form below or email us at businessdevelopment@enverus.com.