[contextly_auto_sidebar]
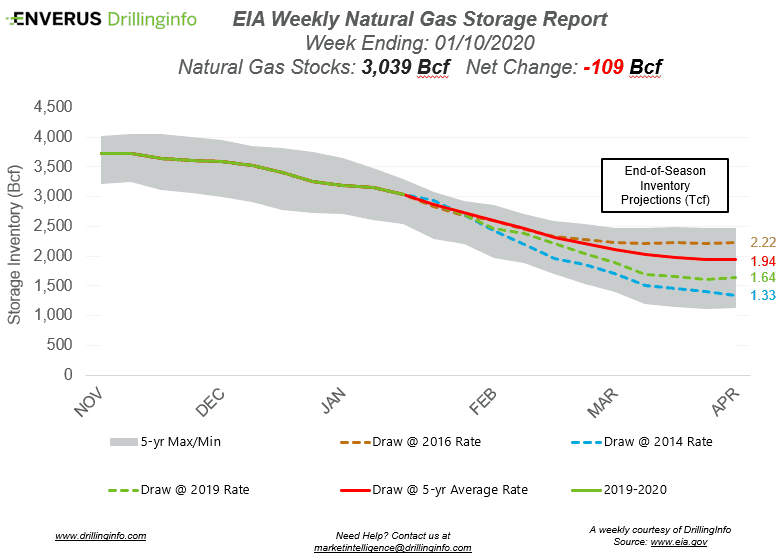
Natural gas storage inventories decreased 109 Bcf for the week ending January 10, according to the EIA’s weekly report. This was larger than expected, which was a draw of 94 Bcf.
Working gas storage inventories now sit at 3.039 Tcf, which is 494 Bcf above inventories from the same time last year and 149 Bcf above the five-year average.
Prior to the storage report release, the February 2020 contract was trading at $2.133/MMBtu, roughly $0.013 above yesterday’s close. After the release of the report, the February 2020 contract was trading at $2.152/MMBtu.
Based on five-year average draws/injections, two regions, the Mountain and Pacific, will end the withdrawal season below the five-year average inventory level. The other regions — the East, Midwest, and South Central — are currently expected to finish above the five-year average inventory level, based on five-year average injections/draws.
The first draw of January was very bearish compared to historical draws in January. Since 2010, the month of January produces between 3 to 4 draws of 100+ Bcf, while February typically produces 3 draws above that level. With increased production compared to the five-year average, colder temperatures will be needed for these draws to happen. A cold front is expected to run through the weekend before heading back to average or above-average temperatures. However, another cold front is expected to hit toward the end of January. February weather is currently expected to be colder than average. Keep an eye on the forecasts going into February. If the cold at the end of January extends into February, expect prices to strengthen.
See the chart below for projections of the end-of-season storage inventories as of April 1, 2020, the end of the withdrawal season.
This Week in Fundamentals
The summary below is based on Bloomberg’s flow data and DI analysis for the week ending January 16.
Supply:
- Dry production decreased 0.45 Bcf/d on the week. Most of the decrease came from the South Central (-0.23 Bcf/d) and the East (-0.17 Bcf/d), with an additional decrease coming from the Mountain region (-0.05 Bcf/d). The Midwest saw a relatively small decrease while the Pacific saw a relatively small increase.
- Canadian net imports decreased 94 Bcf/d, mainly due to decreased imports into the Northeast and decreased exports in the Midwest.
Demand:
- Domestic natural gas demand decreased 4.08 Bcf/d week over week. Res/Com demand accounted for the majority of the decrease, falling 2.89 Bcf/d on the week. Power and Industrial demand also decreased, falling 0.87 Bcf/d and 0.32 Bcf/d, respectively.
- LNG exports decreased 0.17 Bcf/d. Mexican exports increased 0.18 Bcf/d.
Total supply decreased by 1.40 Bcf/d, while total demand decreased 3.91 Bcf/d week over week. With the decrease in demand outpacing the decrease in supply, expect the EIA to report a weaker draw next week. The ICE Financial Weekly Index report is currently expecting a draw of 82 Bcf. Last year, the same week saw a draw of 163 Bcf; the five-year average is a draw of 175 Bcf.