[contextly_auto_sidebar]
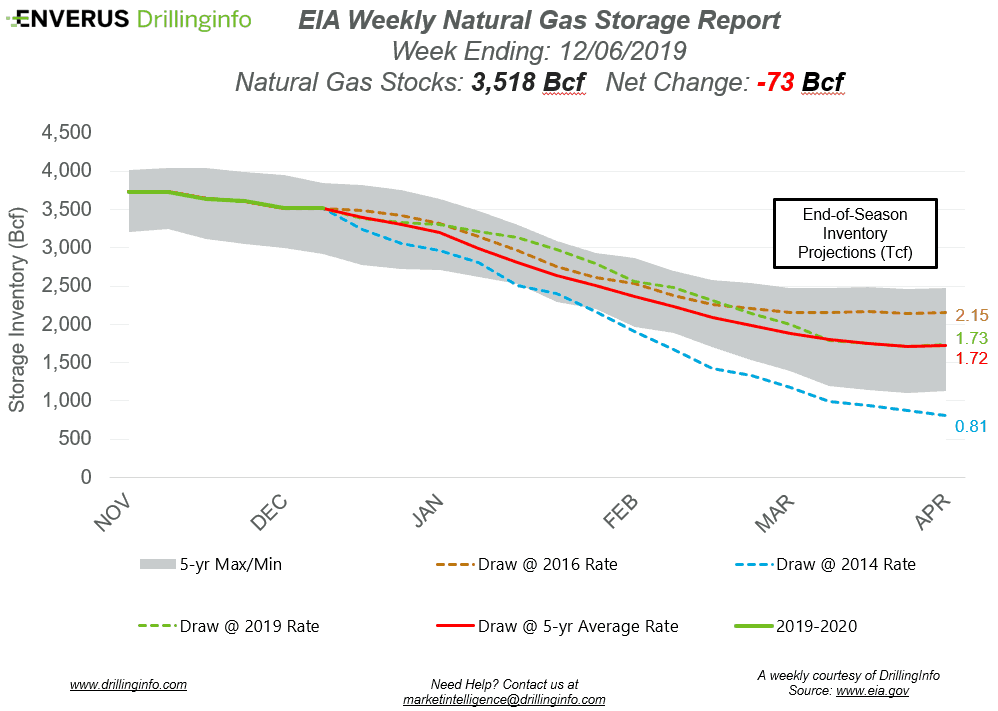
Natural gas storage inventories decreased 73 Bcf for the week ending December 6, according to the EIA’s weekly report. This was lower than the market expectation, which was a draw of 77 Bcf.
Working gas storage inventories now sit at 3.518 Tcf, which is 593 Bcf above inventories from the same time last year and 14 Bcf below the five-year average.
Prior to the storage report release, the January 2020 contract was trading at $2.298/MMBtu, roughly $0.055 higher than yesterday’s close. After the release of the report, the January 2020 contract was trading at $2.279/MMBtu.
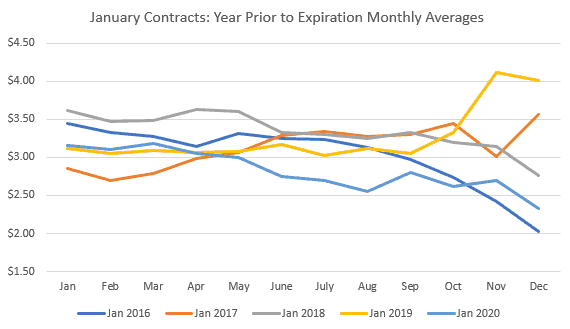
Another week has passed, and the January 2020 contract couldn’t garner any traction. Weather forecasts continue to show average to above-average temperatures in the long term (10–14 days), which leaves the market with a comfortable supply situation and wondering if an extended cold shot will show up to give natural gas prices a boost. The lack of cold has resulted in a January contract trading at its lowest point in December since 2016. Since 2016, January contracts have typically traded above $2.75/MMBtu throughout the year, and mostly above $3/MMBtu. However, the January 2020 contract has been trading under the $3/MMBtu mark since mid-May and has continued its decline through the remainder of the year.
Volatility in the market will continue to come from changes in weather forecasts. Forecasts will need to show below-average temperatures for an extended period of time to see any significant price gain. Should temperatures remain average to above-average, further declines can be expected.
See the chart below for projections of the end-of-season storage inventories as of April 1, 2020, the end of the withdrawal season.
This Week in Fundamentals
The summary below is based on Bloomberg’s flow data and DI analysis for the week ending December 12, 2019.
Supply:
- Dry production decreased 0.72 Bcf/d on the week. Most of the decrease came from the East (−0.37 Bcf/d) where Pennsylvania and Ohio decreased 0.23 Bcf/d and 0.10 Bcf/d, respectively. The South Central also saw a decrease of 0.27 Bcf/d.
- Canadian net imports increased 0.08 Bcf/d.
Demand:
- Domestic natural gas demand increased 1.82 Bcf/d week over week. Power demand increased 1.00 Bcf/d, while Res/Com and Industrial demand increased 0.51 Bcf/d and 0.31 Bcf/d, respectively.
- LNG exports increased 0.25 Bcf/d, while Mexican exports increased 0.10 Bcf/d week over week.
Total supply decreased 0.64 Bcf/d, while total demand increased 2.18 Bcf/d week over week. With an increase in demand and a decrease in supply, expect the EIA to report a stronger draw next week. The ICE Financial Weekly Index report is currently expecting a draw of 102 Bcf. Last year, the same week saw a draw of 141 Bcf; the five-year average is a draw of 123 Bcf.