Welcome to the Summer Power Market Outlook for 2025, your essential guide to navigating the complexities of the upcoming summer power markets across key U.S. regions. As the energy landscape continues to evolve, understanding the interplay of load growth, generation shifts, planned outages, new infrastructure, policy changes and market dynamics is critical for stakeholders aiming to optimize operations, manage risks, and seize opportunities. This e-book provides a detailed, region-by-region analysis, unpacking the factors that will shape summer operations—from rising demand driven by economic growth and electrification to the integration of renewable energy and storage, which are reshaping grid dynamics. We explore planned outages and their congestion implications, highlight new builds that will influence supply and examine policy developments that could redefine market rules. Additionally, our forward-looking heat rate and price forecasts offer actionable insights to help you anticipate market trends, prepare for volatility, and make informed decisions in an increasingly dynamic energy environment.
By reading this e-book, you will gain the following key takeaways:
Comprehensive regional insights: Understand the unique drivers of load, generation, and market dynamics in ERCOT, SPP, MISO, CAISO, Mid-Columbia, PJM, NYISO and ISO-NE for summer 2025.
Congestion and outage impacts: Identify critical outage-driven congestion patterns and their implications for trading and operational strategies.
Emerging infrastructure trends: Learn about new builds, retirements, and their effects on supply reliability and market pricing.
Policy and regulatory shifts: Stay informed on policy changes, such as real-time co-optimization and capacity market reforms, that will shape market operations.
Actionable market forecasts: Leverage detailed heat rate and price forecasts to anticipate volatility, manage risks and develop effective hedging strategies during heat waves and scarcity events.
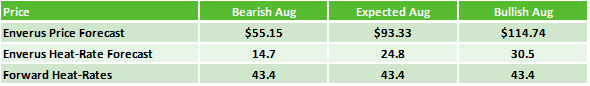
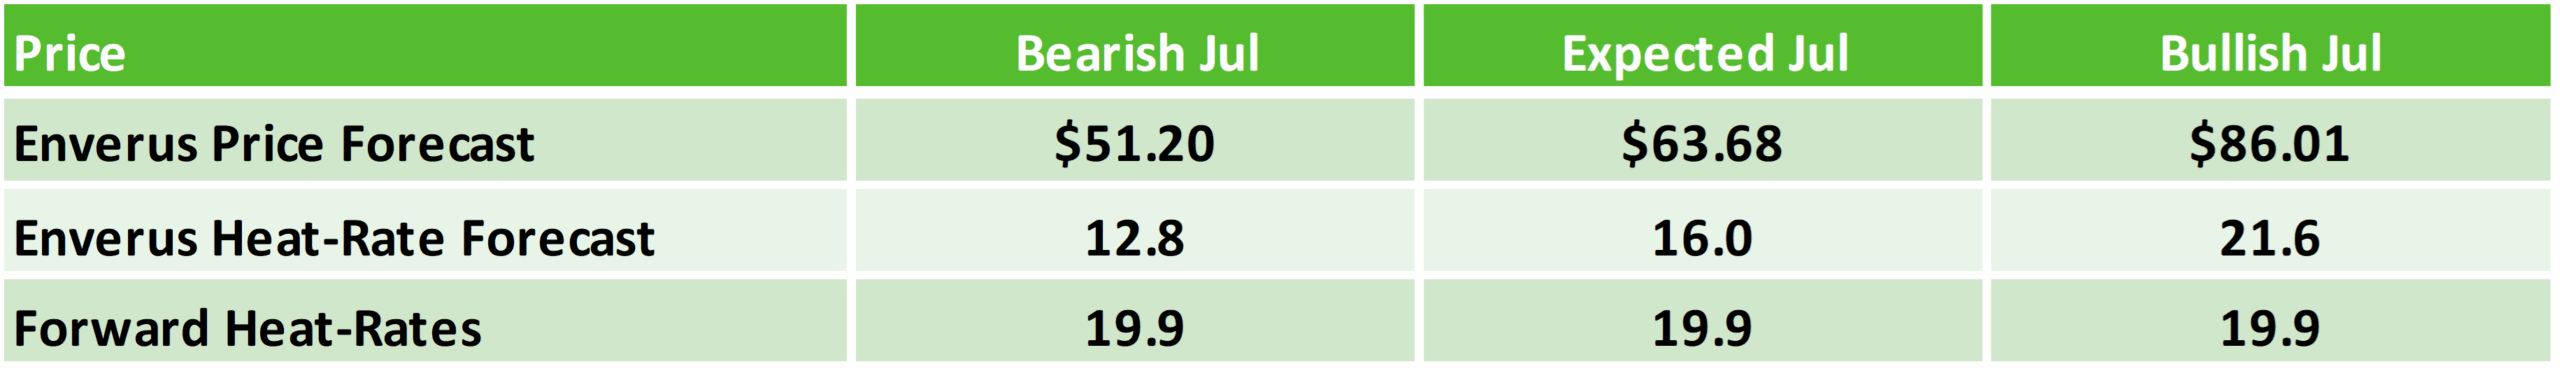
Note these price and heat rate forecasts were created April 30 along with the forward curves.
ERCOT
Load & Generation
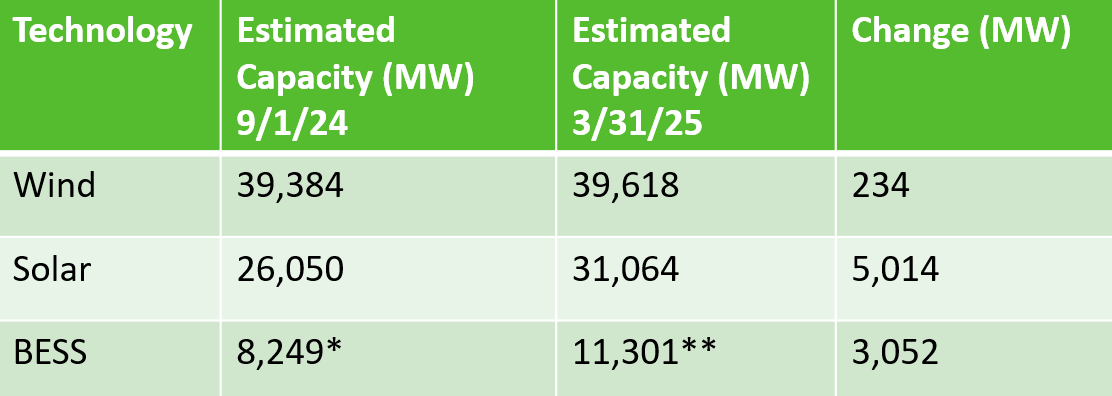
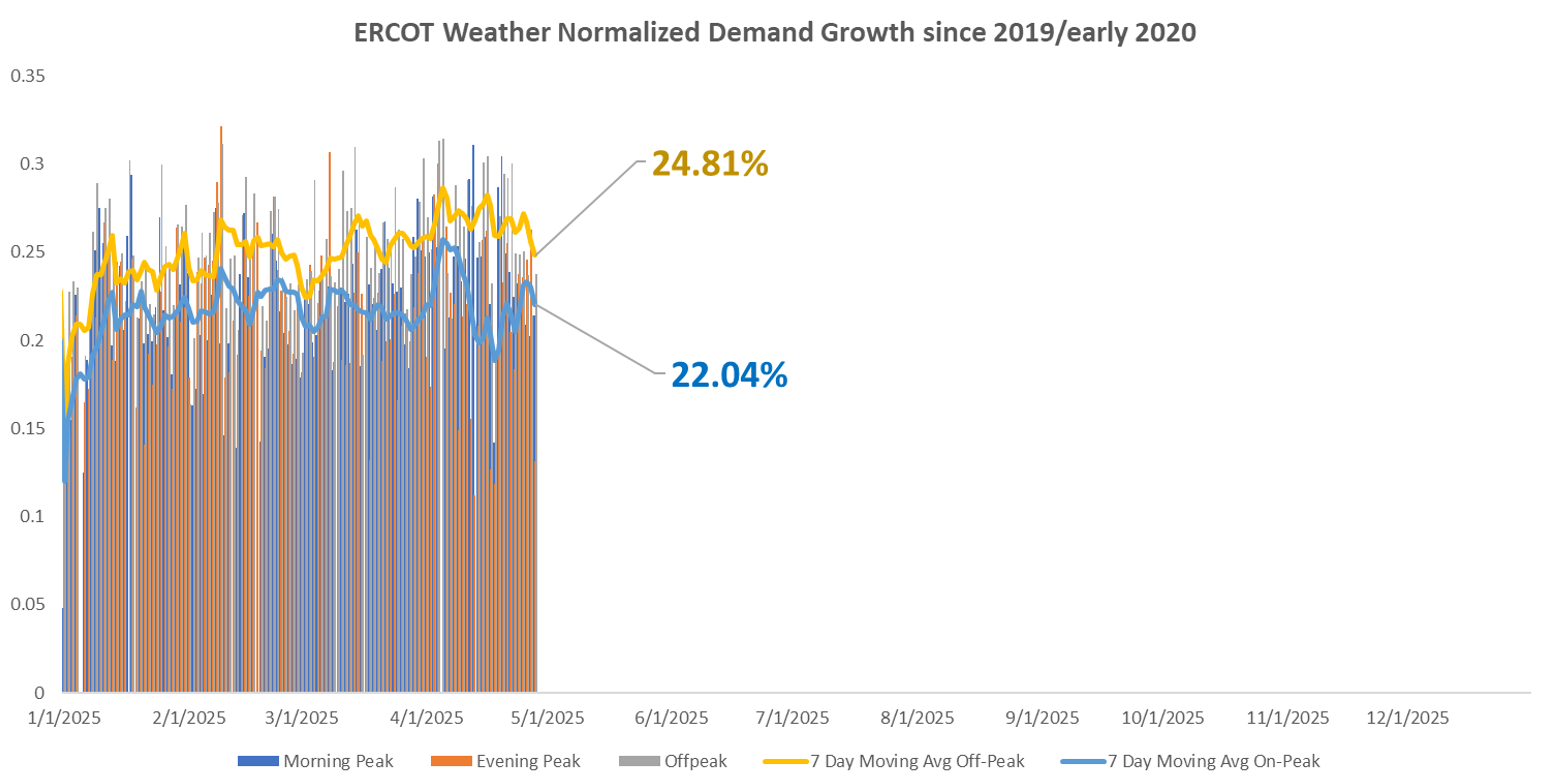
ERCOT anticipates 5–6% year-over-year weather normalized load growth, driven by continued demand increases and reduced behind-the-meter solar exports that deepen the “duck curve” ramp requirements. Since last summer, ERCOT added 234MW of wind, 5GW of solar and 3GW of battery capacity, amplifying morning and evening ramp needs. The summer in ERCOT is expected to be cooler than average with short duration heat waves possible.
Capacity changes in ERCOT
ERCOT Weather Normalized Demand Growth presented by Enverus Power and Renewables Power Market Publications. Backed by a team of power analysts with decades of hands-on power market experience, Power Market Publications helps users make higher quality decisions.
Outages
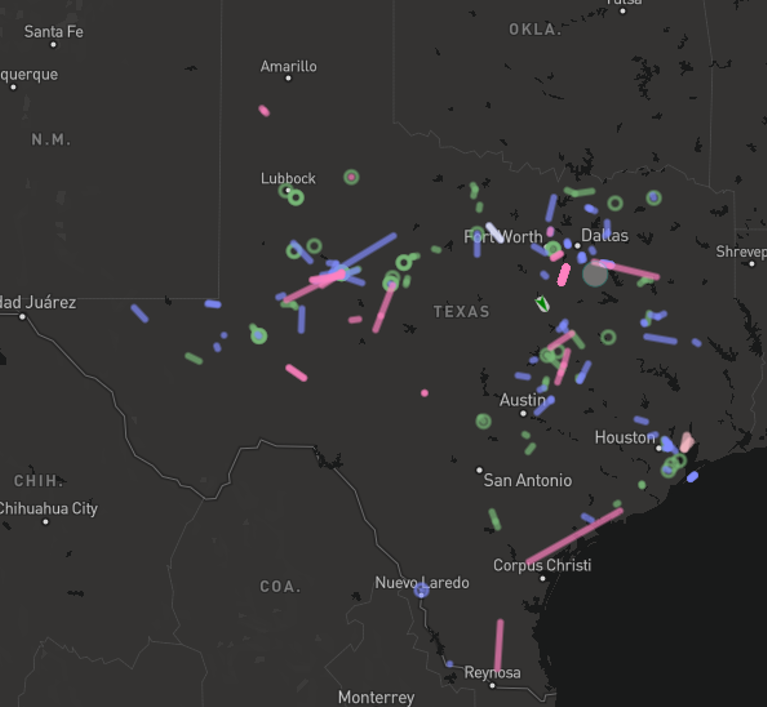
Summer outages concluded in May under jurisdiction restrictions. Key long-duration outages will shape steady congestion patterns through August.
TWINBU-HARGROVE (138KV) shows higher post-contingency flows with an outage at FLCNS-MGSES(345KV) between 04/09/25-01/30/26.
COAST
LOLITA-BLESSING (138KV) show higher post-contingency flows with an outage at STP-ANGSTROM(345KV) between 5/5-11/14.
SOUTH
LON_HILL-CALLICOA (138KV) show higher post-contingency flows with an outage at STP-ANGSTROM(345KV) between 5/5-11/14.
BRUNI (138/69KV) show higher post-contingency flows with an outage at STP-ANGSTROM(345KV) between 5/5-11/14.
ERCOT August congestion analysis presented in Enverus Power and Renewables Panorama. Panorama delivers in-depth analytics backed by advanced power flow models, shift factor calculations and expert market knowledge to give you the confidence to make the best decisions.
New Builds
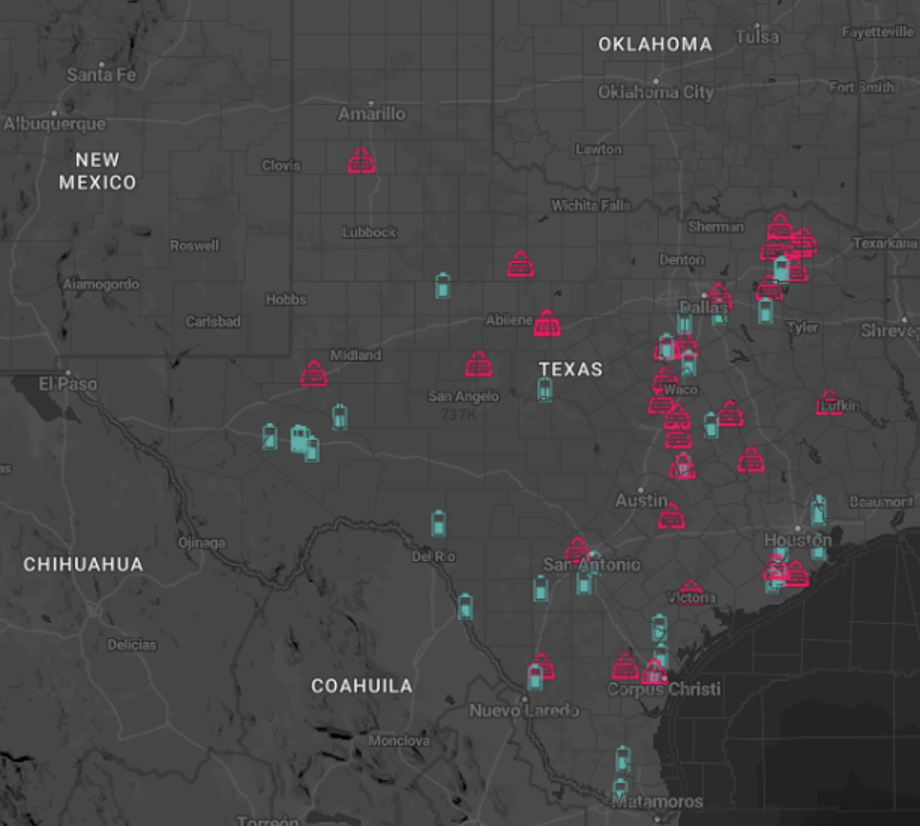
We are seeing fewer projects, particularly solar, but the size of the projects are growing. Battery projects look to be heading toward bigger projects with longer durations.
ERCOT Power Unit New Builds presented in Enverus Power and Renewables Power Market Publications. Power Market Publications is six publications in one, offering crucial market insights to help you stay ahead in the power markets.
Policy
Real-time co-optimization with batteries launches December 2025. Legislative debates around capacity funding and the Texas Energy Fund continue.
Heat Rates & Price Forecast
June
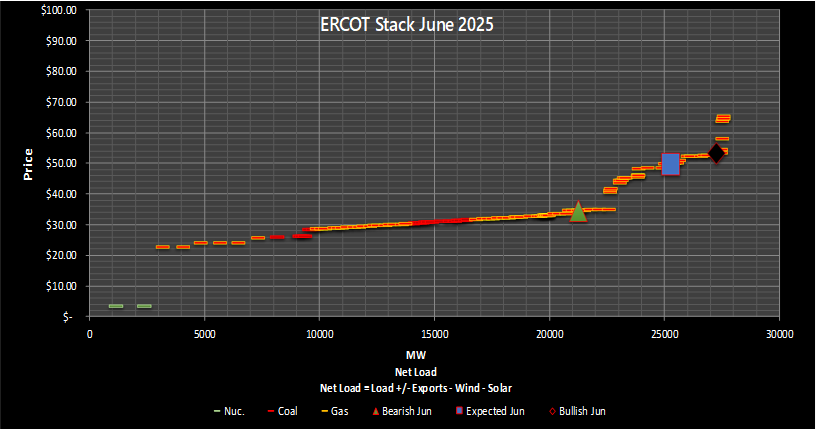
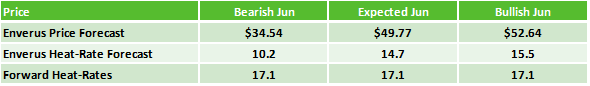
June is expected to be a timid start to the summer. Risk lies on the low side of the market HR. Risks for heat waves but they should be of short duration.
ERCOT Stack June 2025 presented by Enverus Power and Renewables Power Market Publications. Power Market Publications provides you with insights into price spreads, between trading hubs, informed by transmission congestion and renewable forecasts, helping you find more opportunities and risks faster.
July
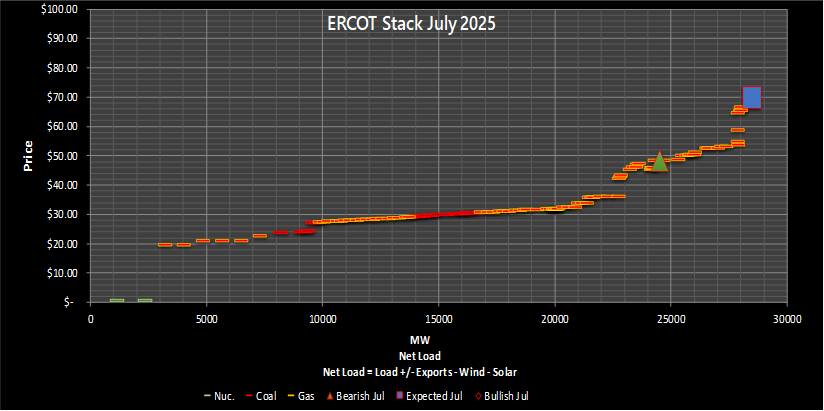
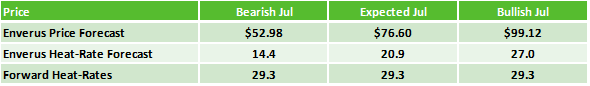
July ratchets up the risk of an impactful heatwave. The supply stack is highly sensitive to small changes in load. Hurricane risks increase. Risks lie below the market HR.
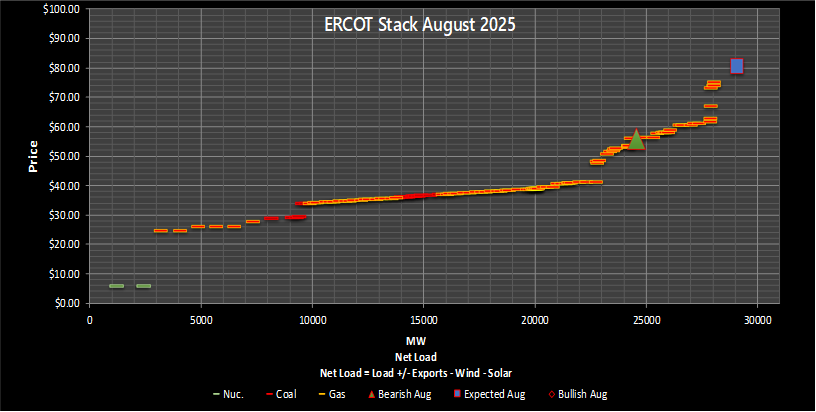
August
August is historically the strongest month for heat. Drought conditions will be increasingly important through the summer. Despite weather expectations, load growth could produce a new record peak (late July through early August).
ERCOT Stack August 2025 presented by Enverus Power and Renewables Power Market Publications. Gain detailed insights from our analysts on key trends in the power markets and use these insights as a foundation to identify trade adjustments.
SPP
Load & Generation
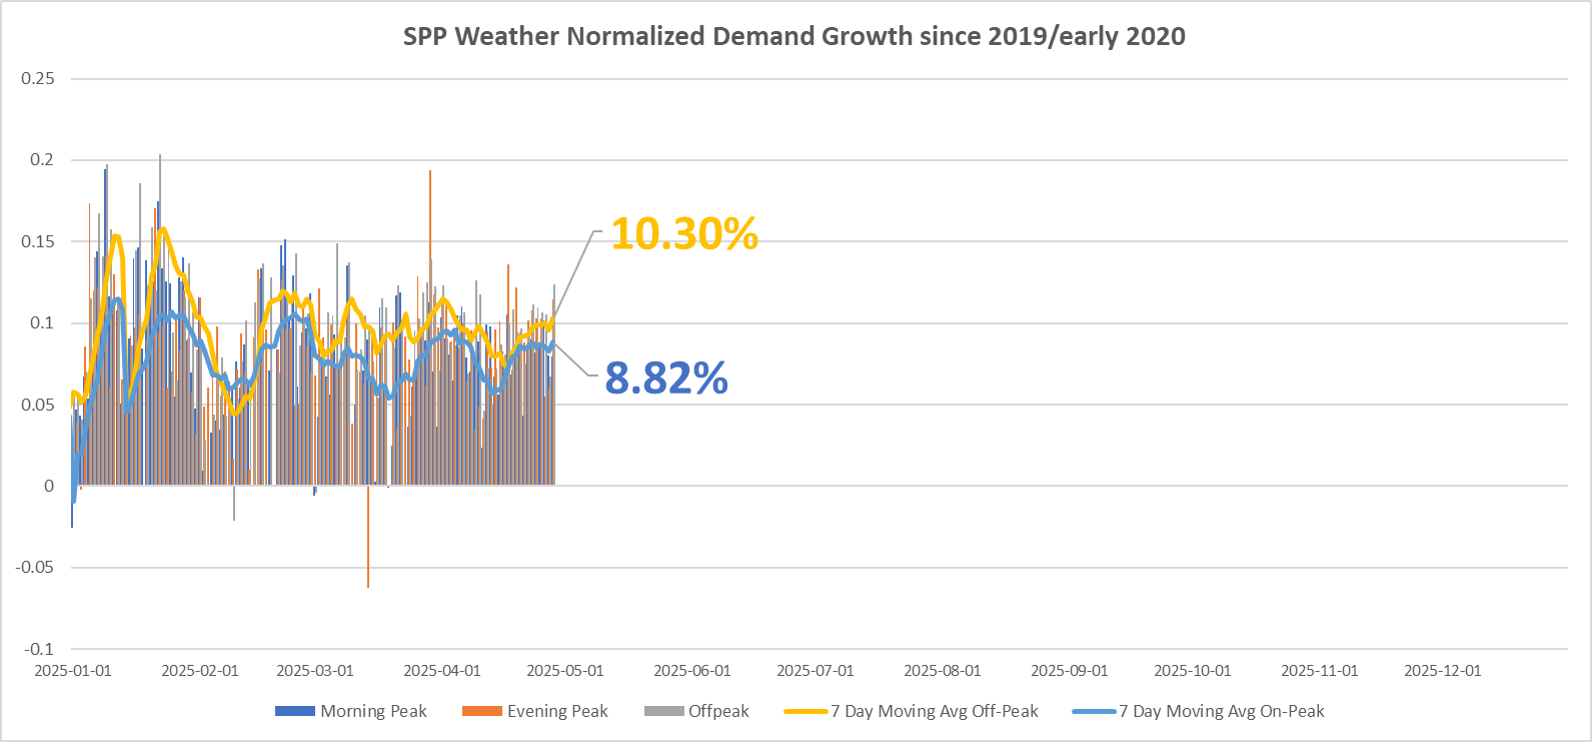
On-peak load growth is forecast at 2–3% YoY weather normalized load growth near 4–5%. Solar and batteries additions are modest, while larger wind projects are in the queue.The summer in SPP is expected to be cooler than average with short duration heat waves.
SPP Weather Normalized Demand Growth presented by Enverus Power and Renewables Power Market Publications. Backed by a team of power analysts with decades of hands-on power market experience, Power Market Publications helps users make higher quality decisions.
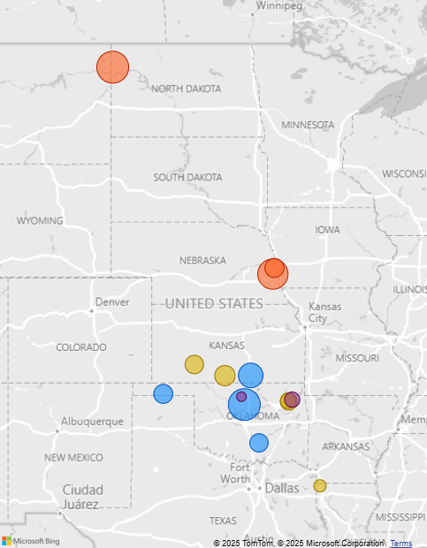
Outages
June constraints may come from Aurora–Reed Springs and Southern Plains line work.
July–August sees higher-voltage outages like Big Stone, Brownsville and Ellendale–Aberdeen Junction under low-wind conditions.
Expecting a fairly light summer for congestion in the South.
New Builds
New resources include Watt Bridge peakers, Turtle Creek and Pioneer for Eastern Nebraska flow support. Several local solar farms are in pre-construction.
SPP Power Unit New Builds presented in Enverus Power and Renewables Power Market Publications. Power Market Publications is six publications in one, offering crucial market insights to help you stay ahead in the power markets.
Policy
The Norman Hills substation upgrade near OKC has eliminated daily Cimarron congestion. No major market rule changes are anticipated this summer.
Heat Rates & Price Forecast
June
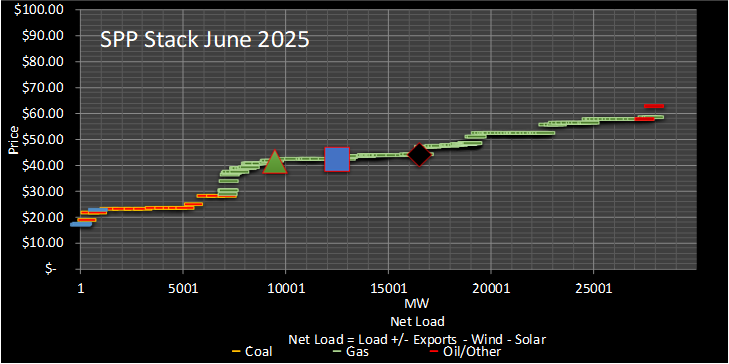
June is expected to be cooler than average. There is a risk for heat wave, but congestion impacts to South Hub are limited/bearish in direction.
SPP Stack June 2025 presented by Enverus Power and Renewables Power Market Publications. Power Market Publications provides you with insights into price spreads, between trading hubs, informed by transmission congestion and renewable forecasts, helping you find more opportunities and risks faster.
July
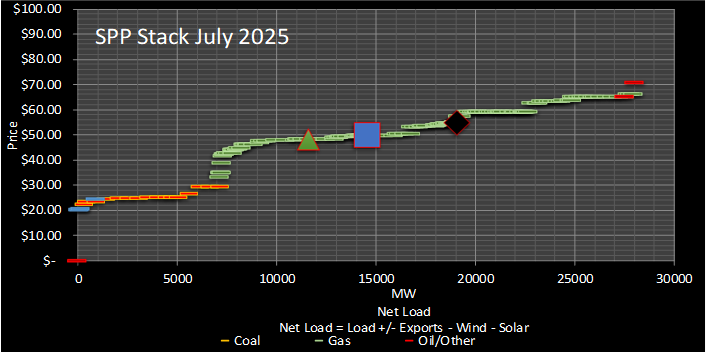
Isolated heat waves and variable wind will introduce day to day risks (that we can forecast). Congestion around South Hub is neutral in terms of impact.
SPP Stack July 2025 presented by Enverus Power and Renewables Power Market Publications. Gain detailed insights from our analysts on key trends in the power markets and use these insights as a foundation to identify trade adjustments.
August
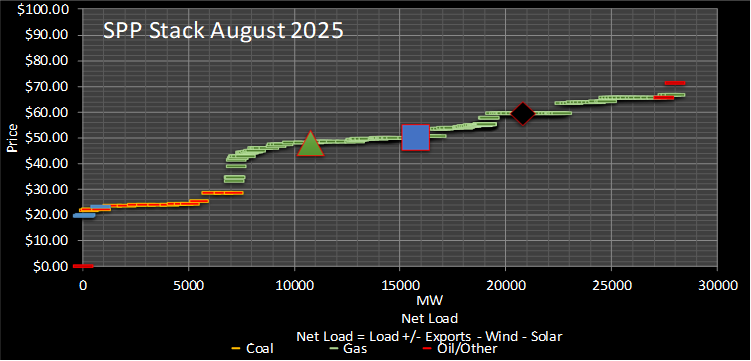
August will bring some of the hottest weather to the central plains. By the end of the month, heat starts to wane in northern latitudes. Most risk lies at the start of the month when heat waves are most likely.
SPP Stack August 2025 presented by Enverus Power and Renewables Power Market Publications. The seasoned analysts provide fresh perspectives on the power markets, offering insights and strategies that may not have been previously considered, elevating your team’s market analysis.
MISO
Load & Generation
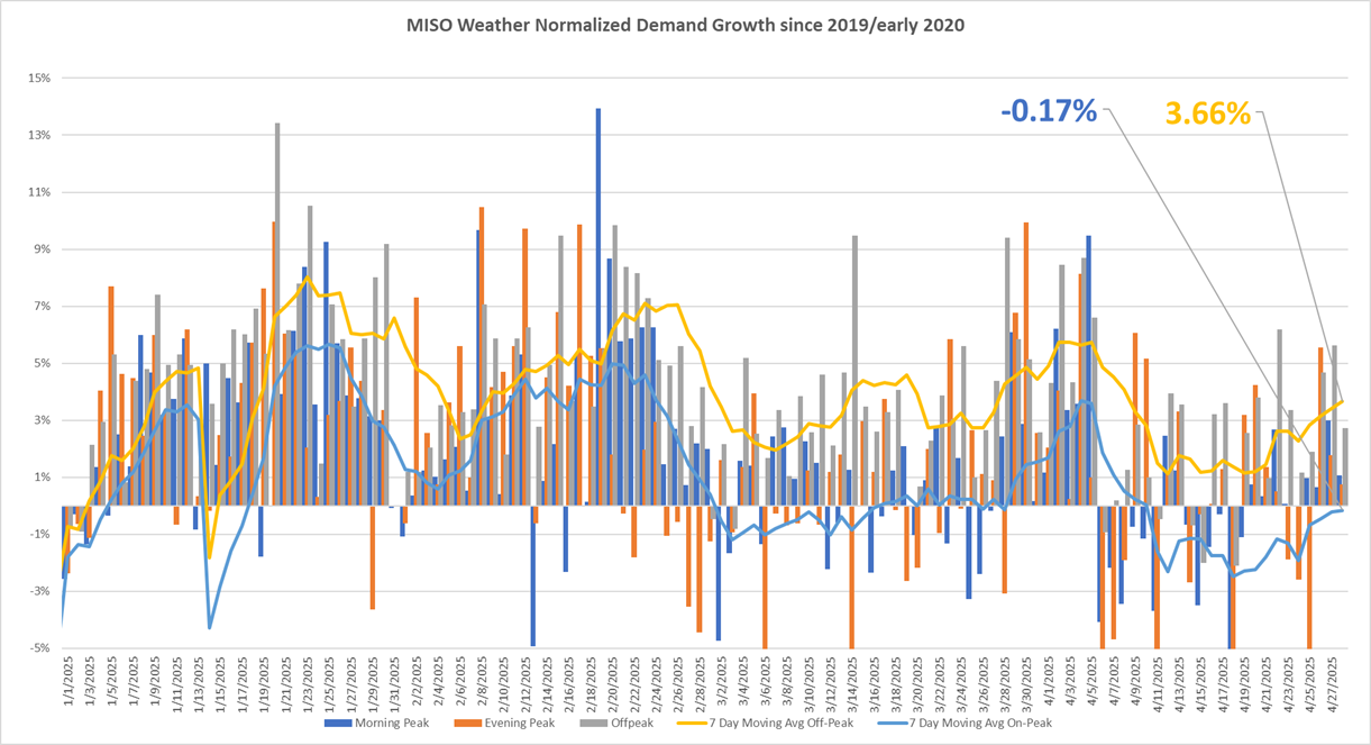
MISO projects 3–4% on-peak and 4–5% off-peak load growth under mild. The summer in MISO is expected to be cooler than average with short duration heat waves.
ENSO-neutral conditions.
MISO Weather Normalized Demand Growth presented by Enverus Power and Renewables Power Market Publications. Backed by a team of power analysts with decades of hands-on power market experience, Power Market Publications helps users make higher quality decisions.
Outages
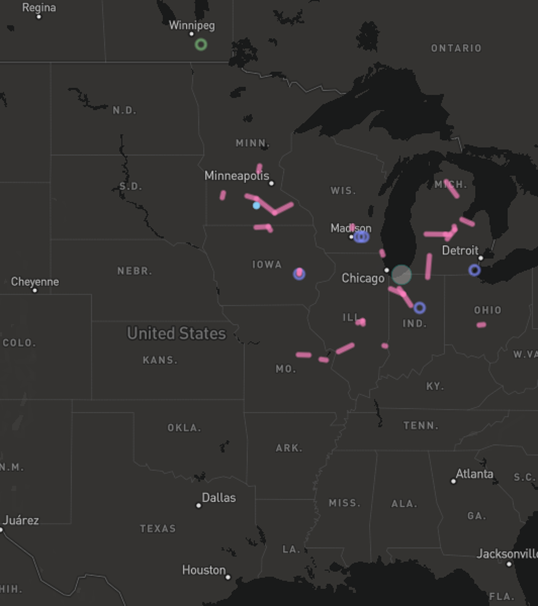
June: North–South flow risks via Overton transformer and Rhineland corridor under windy Plains scenarios.
July–August: Maple Chrysler congestion in Indy Hub driven by 345kV line work and gas-supply unit maintenance.
MISO congestion analysis presented in Enverus Power and Renewables Panorama. Panorama delivers in-depth analytics backed by advanced power flow models, shift factor calculations and expert market knowledge to give you the confidence to make the best decisions.
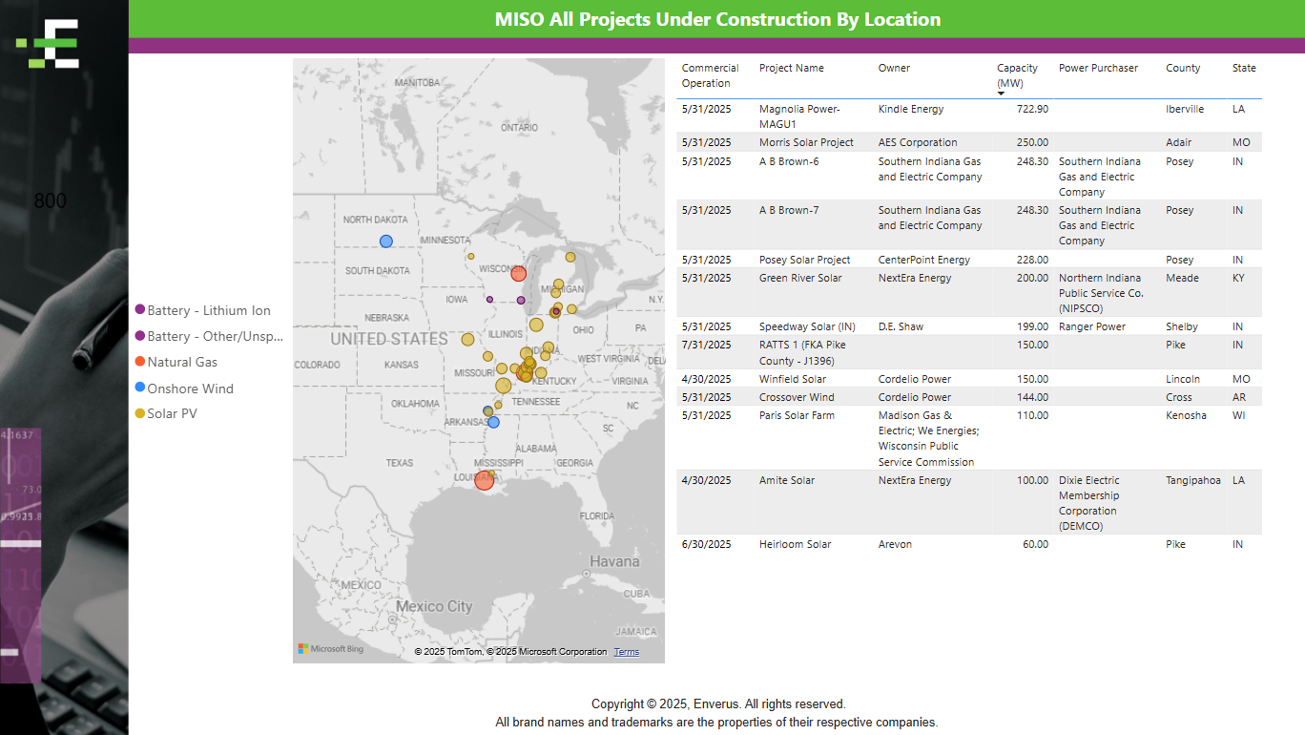
MISO Power Unit New Builds presented in Enverus Power and Renewables Power Market Publications. Power Market Publications is six publications in one, offering crucial market insights to help you stay ahead in the power markets.
Policy
FERC-approved $10,000/MWh VOLL cap with a one-day circuit breaker limits but does not eliminate extreme spikes during wind forecast misses.
Heat Rates & Price Forecast
June
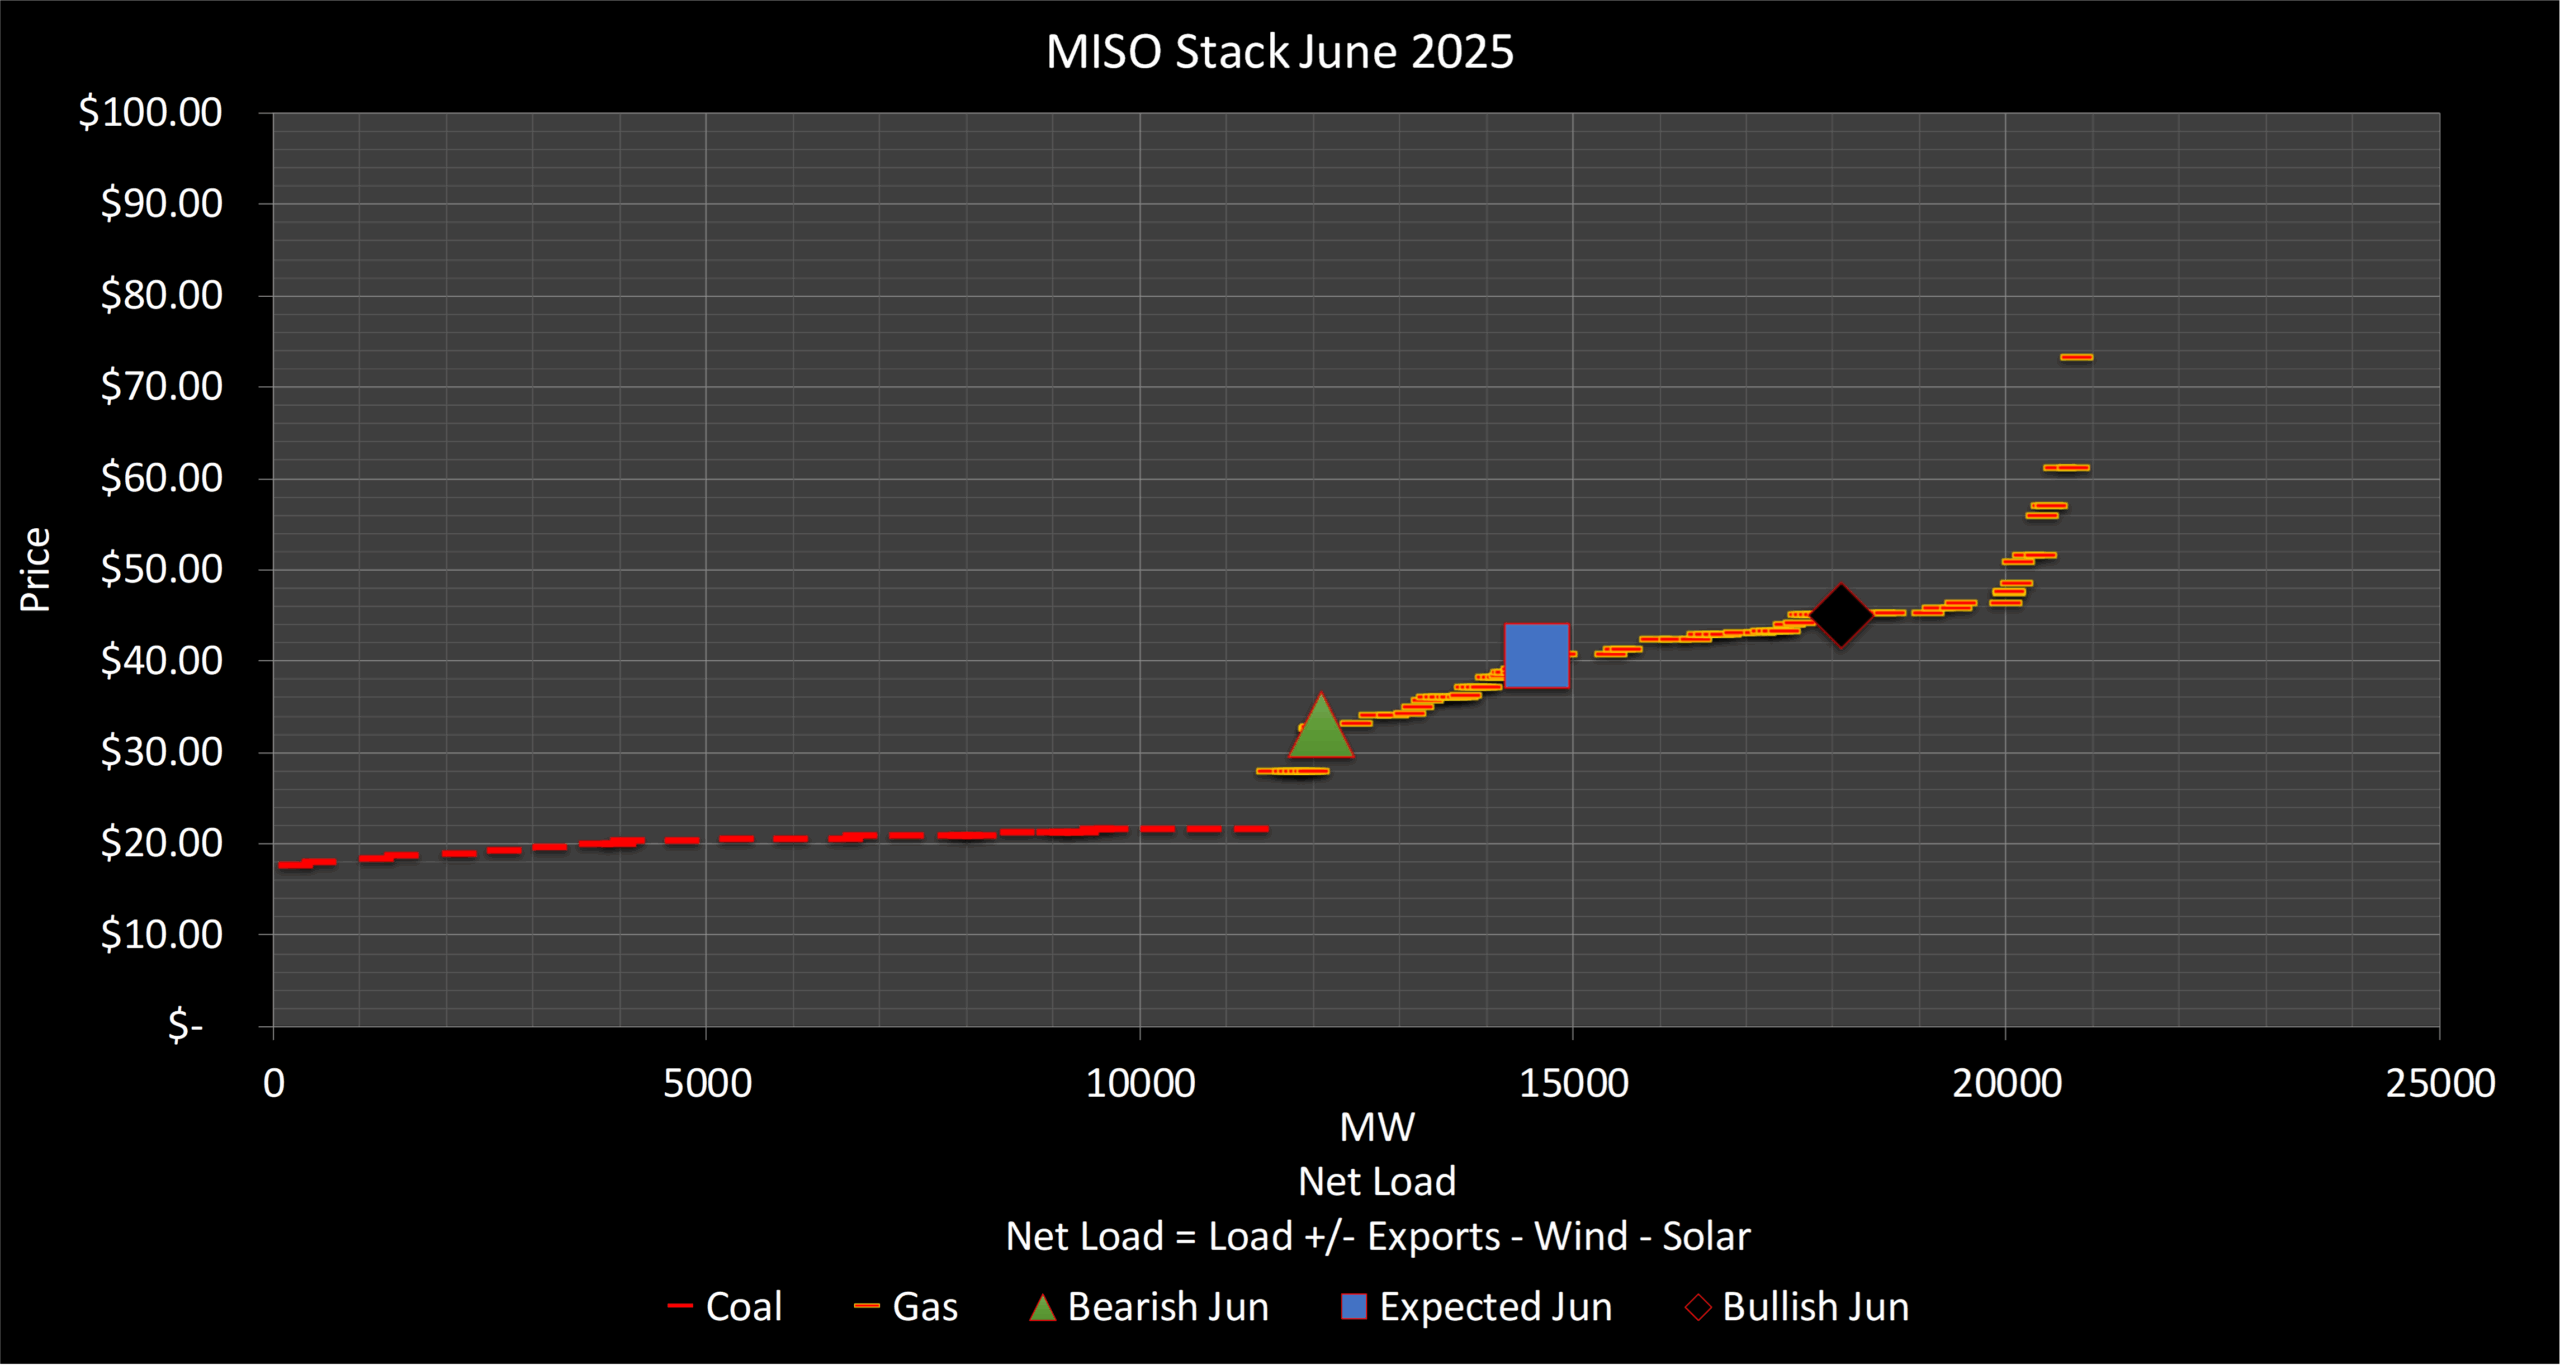
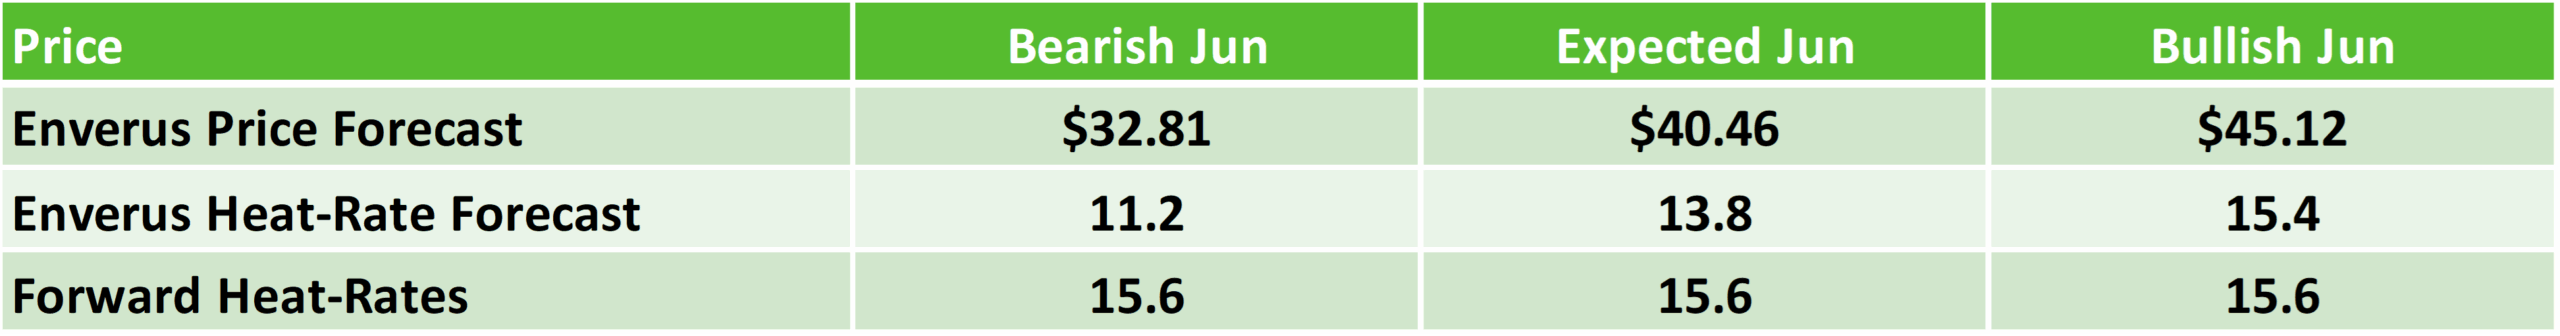
In June, our expected INDY HUB scenario remains on the flatter portion of the stack with our view for average demand. This means it’s going to take “heat wave” like events to move to our bullish scenario.
With that being said, our stack model shows any below average demand with strong renewables will quickly send heat rates sliding near our bearish scenario.
MISO Stack June 2025 presented by Enverus Power and Renewables Power Market Publications. Power Market Publications provides you with insights into price spreads, between trading hubs, informed by transmission congestion and renewable forecasts, helping you find more opportunities and risks faster.
July
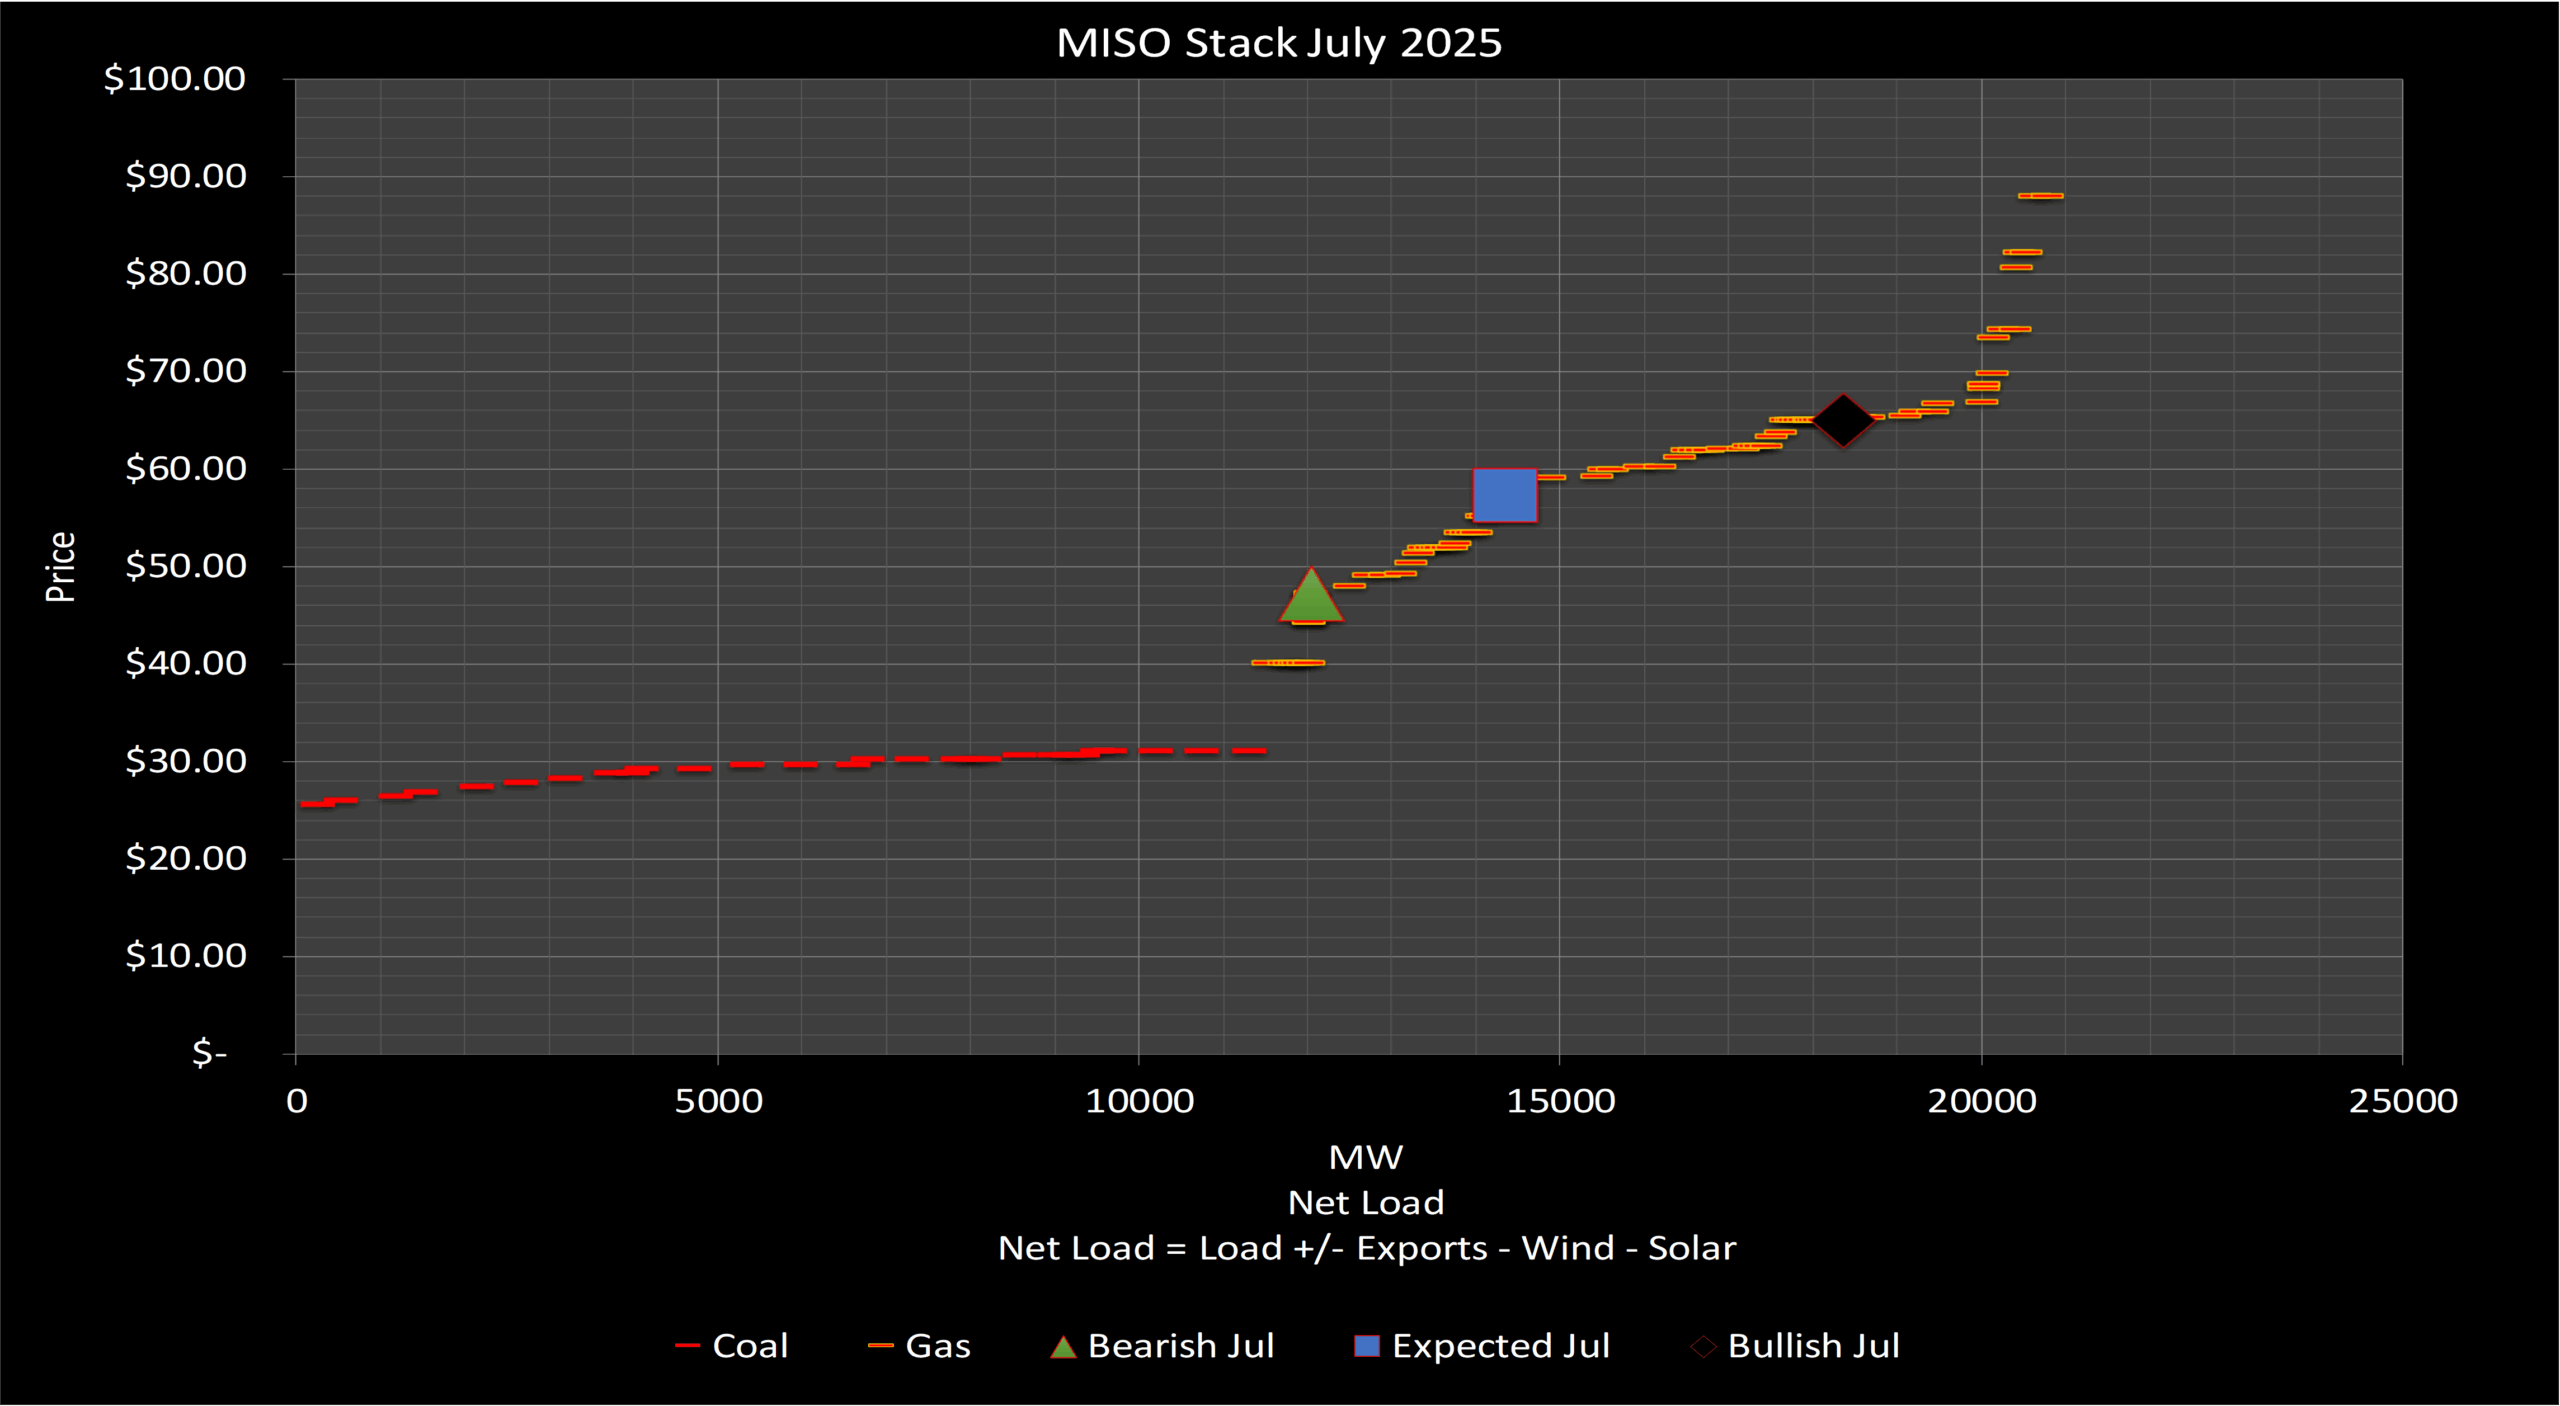
It appears the market heat rate for July may be too optimistic as it is above our bullish scenario which does capture “heat wave,” risk for the month.
The argument for the market view would likely need to measure an extended heat wave and account for bullish congestion in central Indiana like MAPL-CHRY, which our expected heat rate prices would reflect.
MISO Stack July 2025 presented by Enverus Power and Renewables Power Market Publications. Gain detailed insights from our analysts on key trends in the power markets and use these insights as a foundation to identify trade adjustments.
August
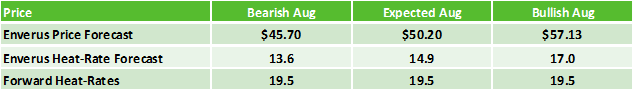
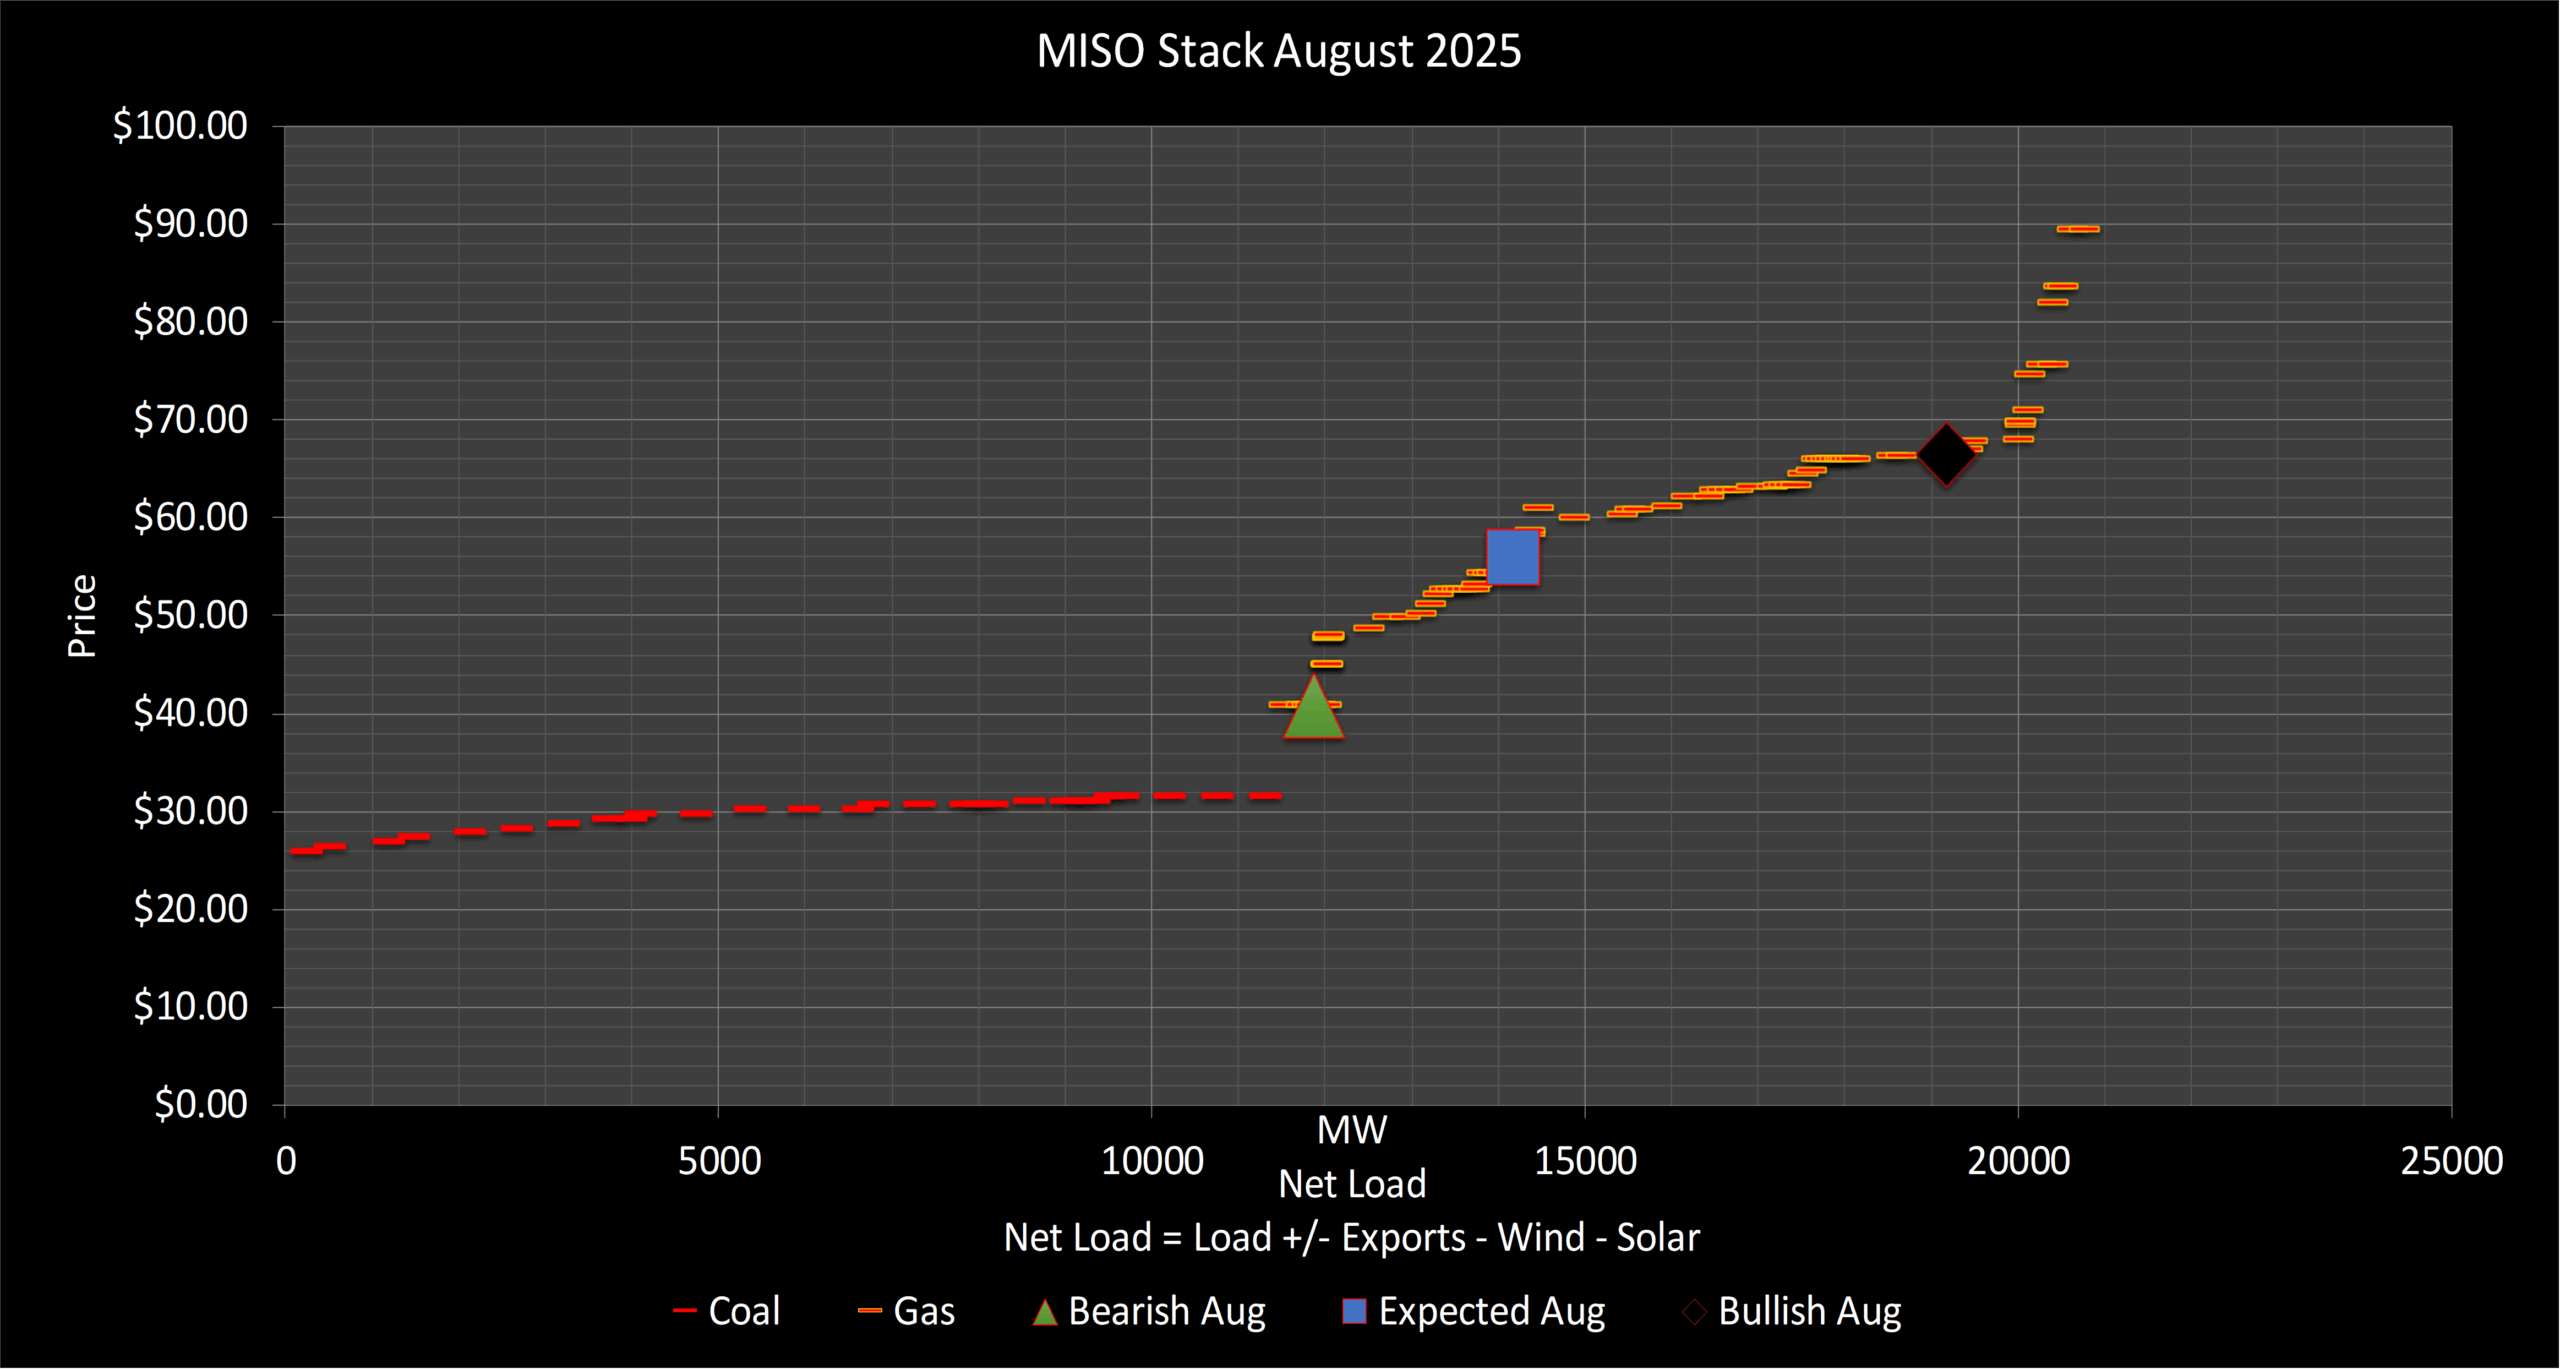
In August our expected scenario continues to price in offsetting fundamentals, i.e., MAPL-CHRY congestion risk countered with our view for below average demand. The stack model does show the risk reward is in favor of a short position at the current market sentiment.
MISO Stack August 2025 presented by Enverus Power and Renewables Power Market Publications. The seasoned analysts provide fresh perspectives on the power markets, offering insights and strategies that may not have been previously considered, elevating your team’s market analysis.
PJM
Load & Generation
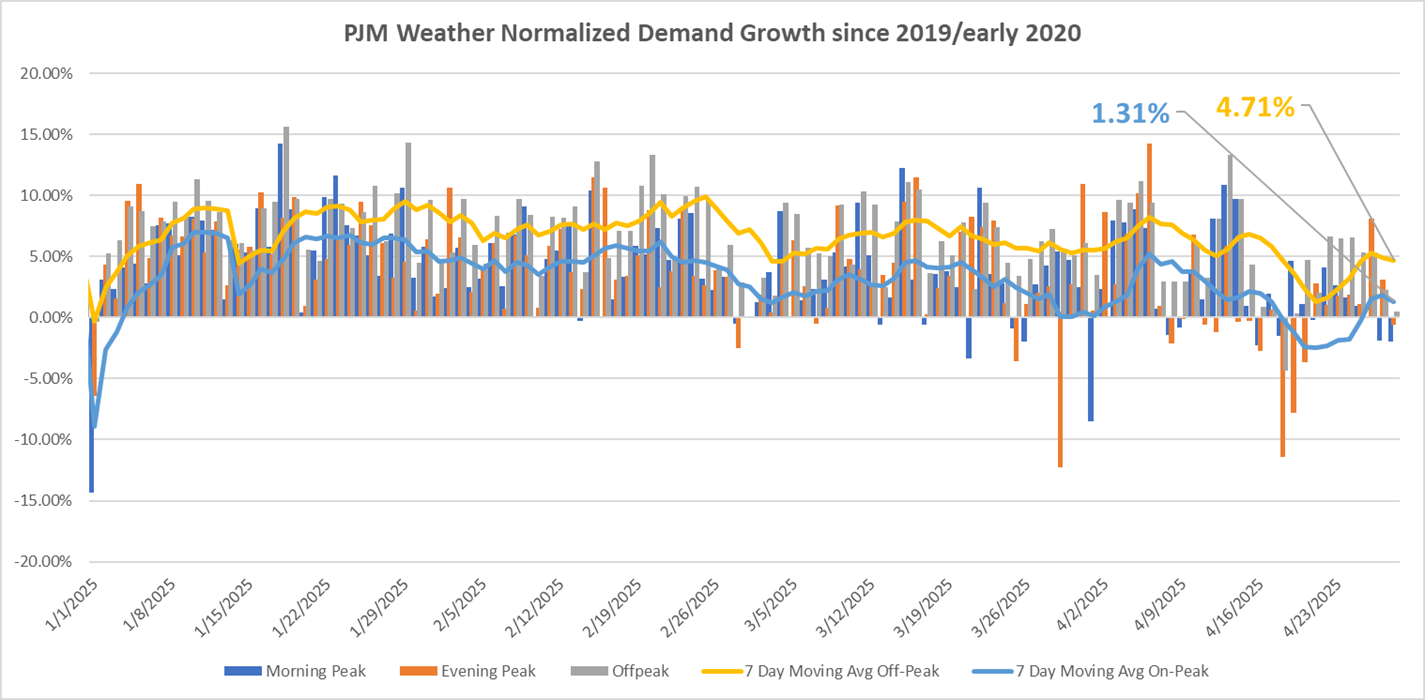
ENSO-neutral analog yearsindicate below-average temperatures. Weather normalized load growth is YOY 2–3%.The summer in PJM is expected to be cooler than average with short duration heat waves.
PJM Weather Normalized Demand Growth presented by Enverus Power and Renewables Power Market Publications. Backed by a team of power analysts with decades of hands-on power market experience, Power Market Publications helps users make higher quality decisions.
Outages
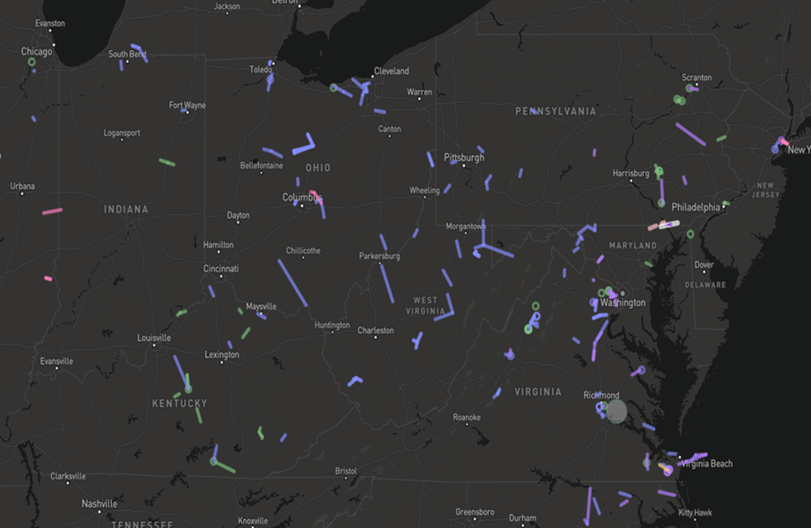
June: Limited mid-Atlantic constraints.
July–August: Nottingham (PA/MD) and Conastone (MD) congestion events alongside Western PA line work.
PJM congestion analysis presented in Enverus Power and Renewables Panorama. Panorama delivers in-depth analytics backed by advanced power flow models, shift factor calculations and expert market knowledge to give you the confidence to make the best decisions.
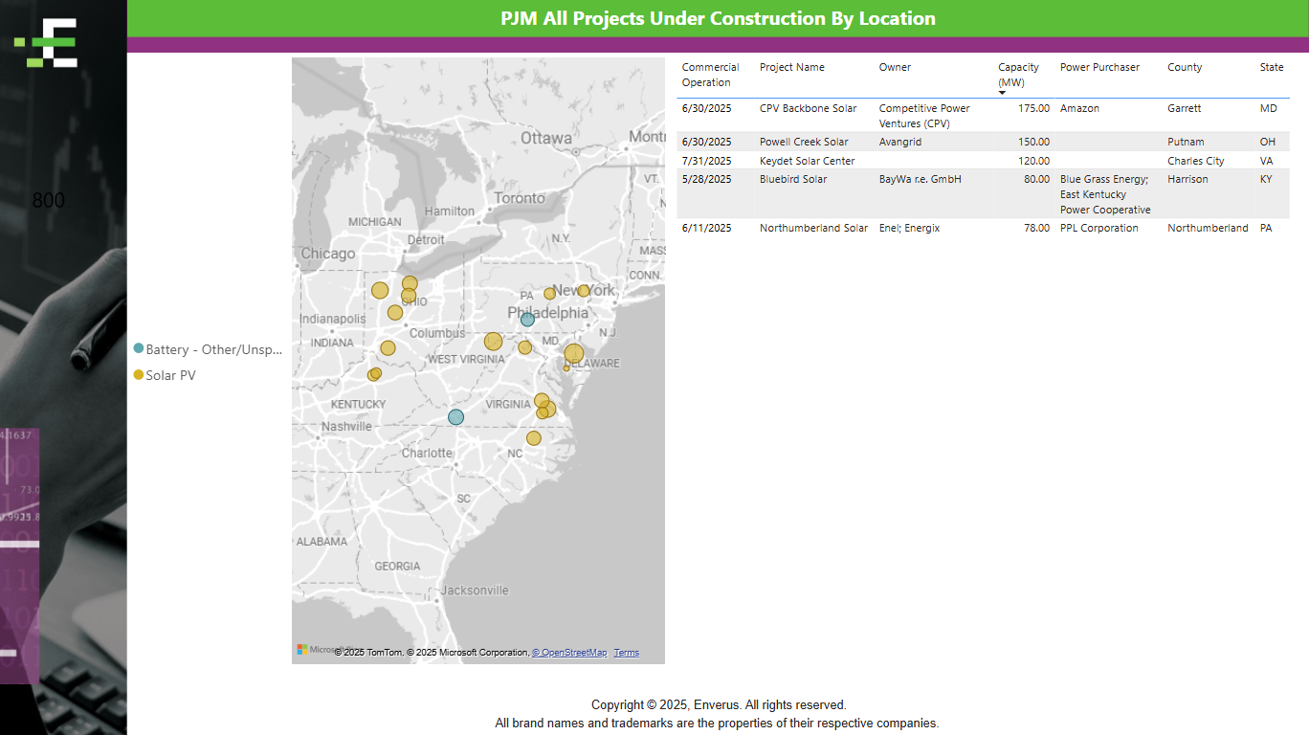
New Builds & Retirements
Elwood CT retirement moved to 2026; 120MW Richmond solar COD in July; retirements slowed significantly versus 2023.
PJM Power Unit New Builds presented in Enverus Power and Renewables Power Market Publications. Power Market Publications is six publications in one, offering crucial market insights to help you stay ahead in the power markets.
Policy
A FERC-approved capacity price collar ($175-325/MW-day) applies for upcoming auctions. RRI pushes to accelerate shovel-ready interconnection projects.
Heat Rates & Price Forecast
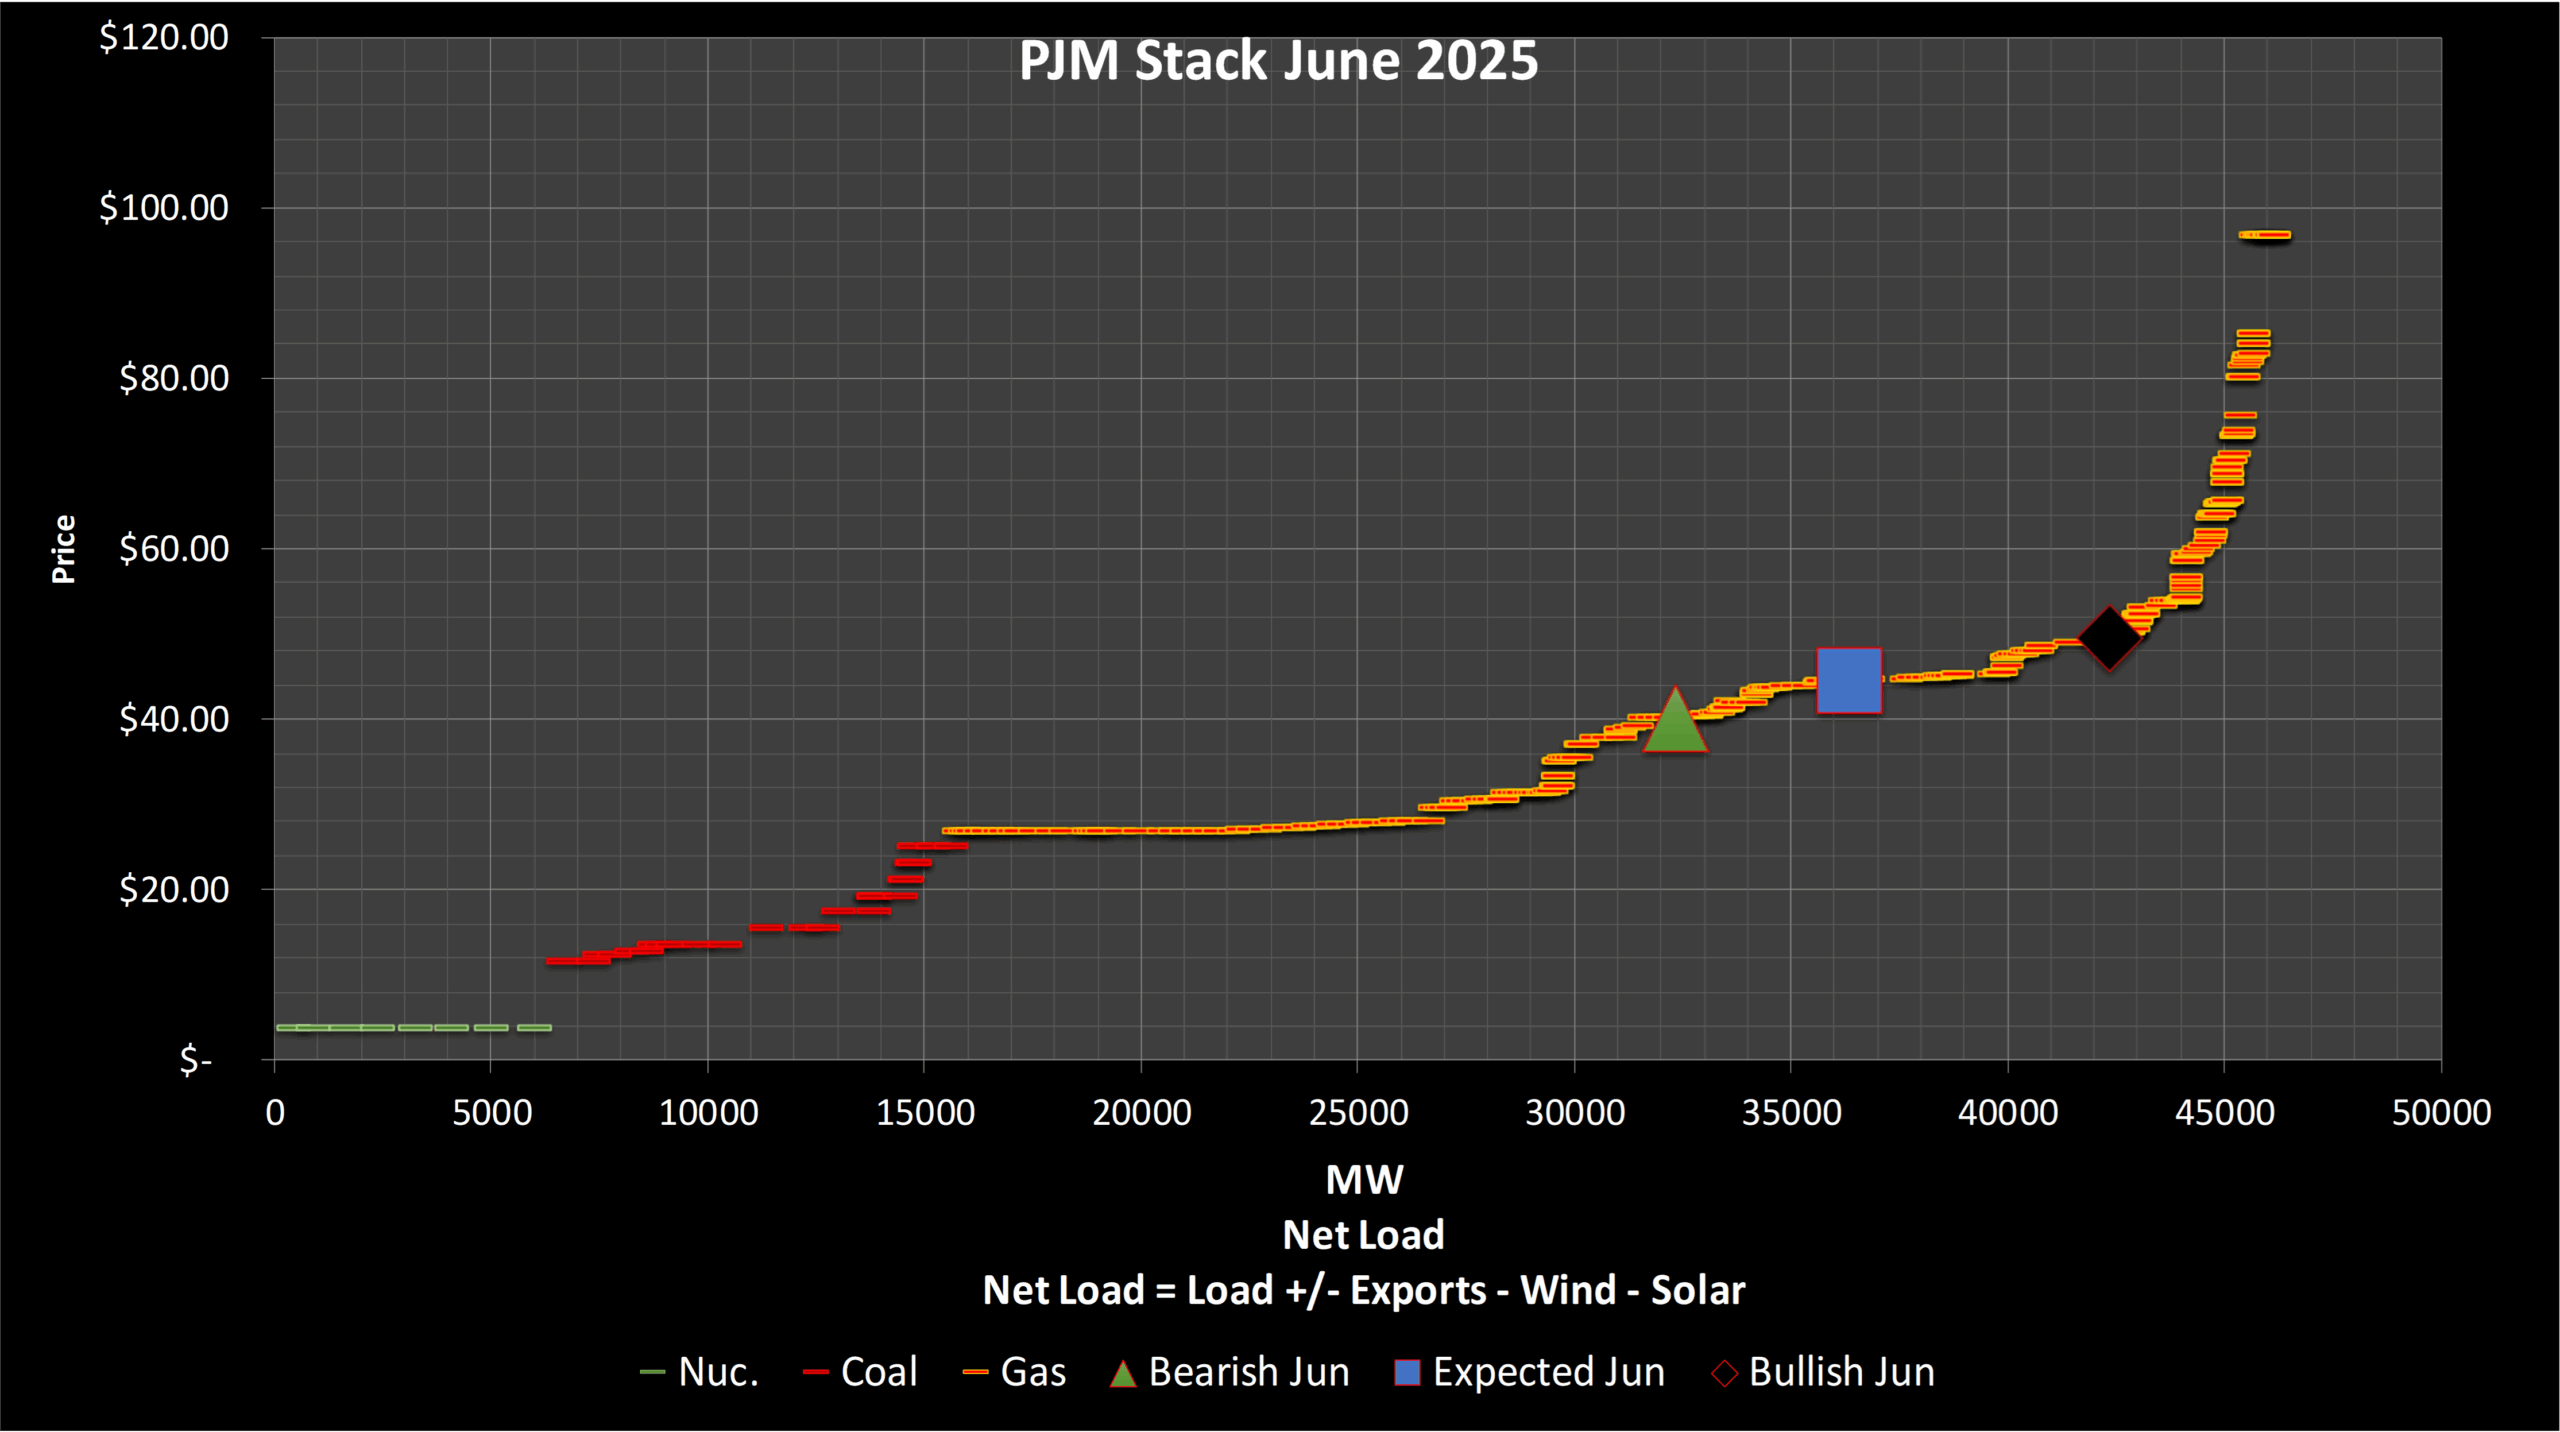
June
For the first month of summer our outlook is bearish to the market as we expect Brandon Shores to run 2 units more frequently as they begin their RMR contract. This should help to mute much of the NOTT/CONA-NRTH congestion. The risk to our view, we are modeling roughly 2-3% load growth which combined with a “heat wave,” could push WHUB heat rates near our bullish scenario.
PJM Stack June 2025 presented by Enverus Power and Renewables Power Market Publications. Power Market Publications provides you with insights into price spreads, between trading hubs, informed by transmission congestion and renewable forecasts, helping you find more opportunities and risks faster.
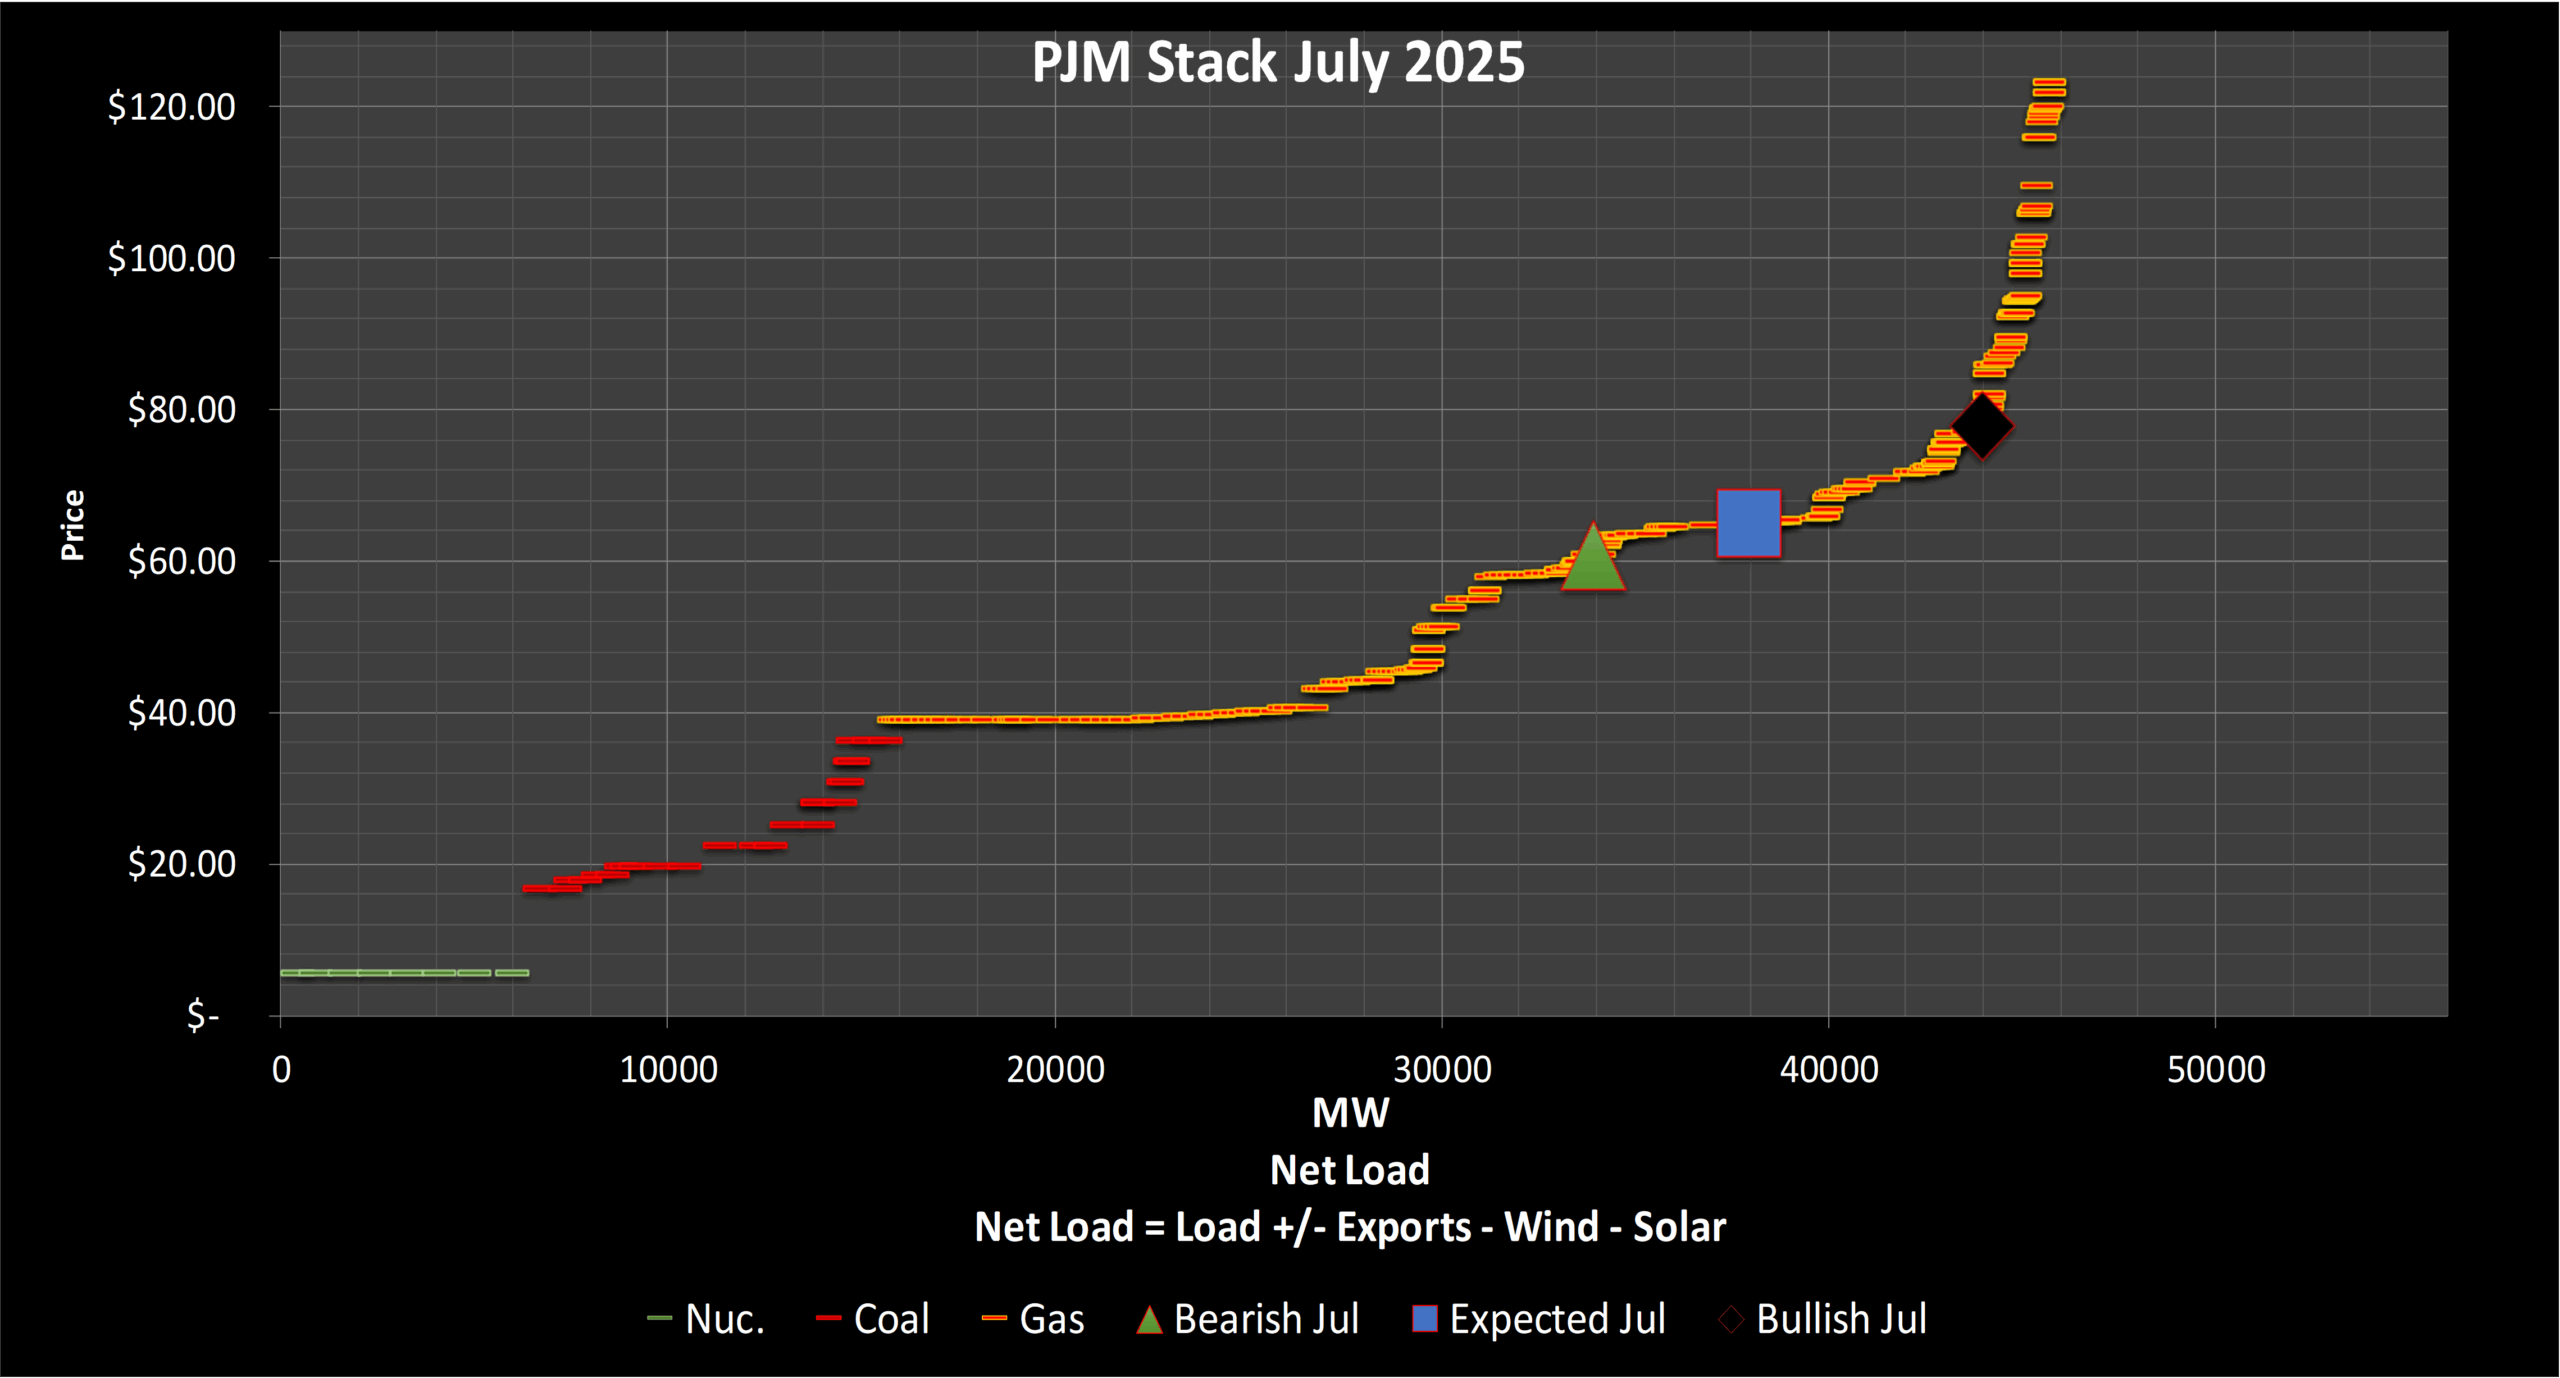
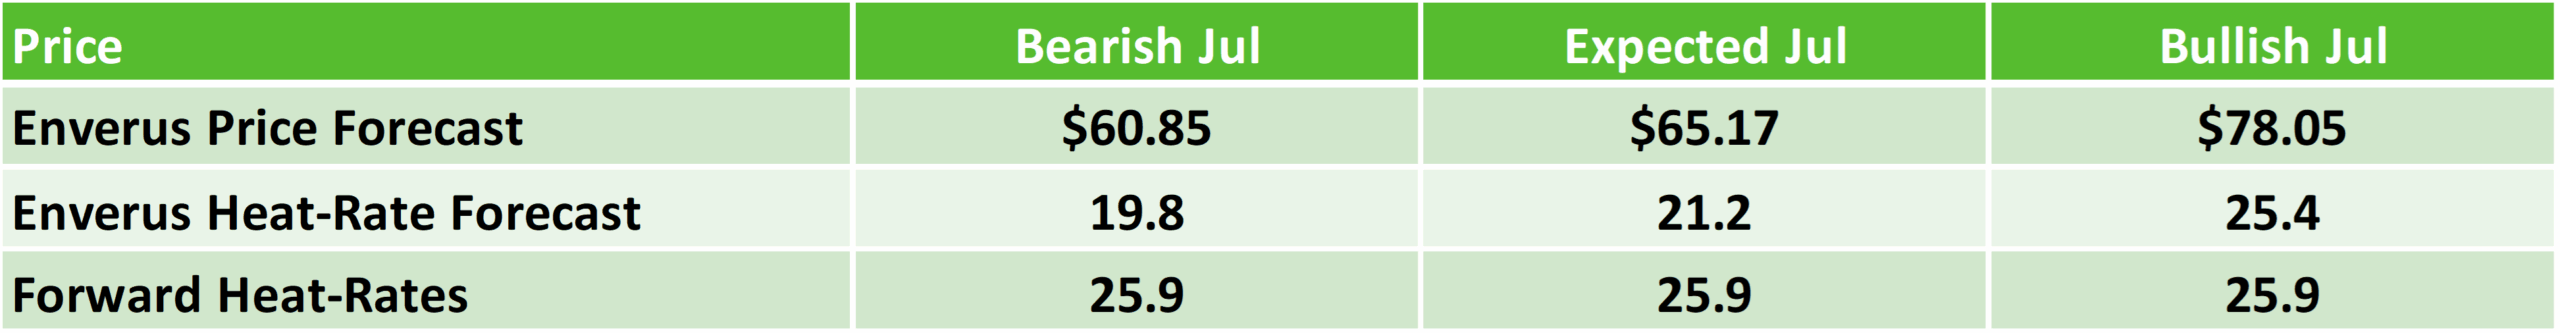
July
The market sentiment for July is more bullish than our view. To be fair July is generally the hottest month of the summer for the Mid-Atlantic & likely the reason for the market heat rate near our bullish scenario.
As we highlighted, our expected heat is pricing in below average demand & some NOTT risk during the month but would need some “heat wave,” like event to get to the market outlook.
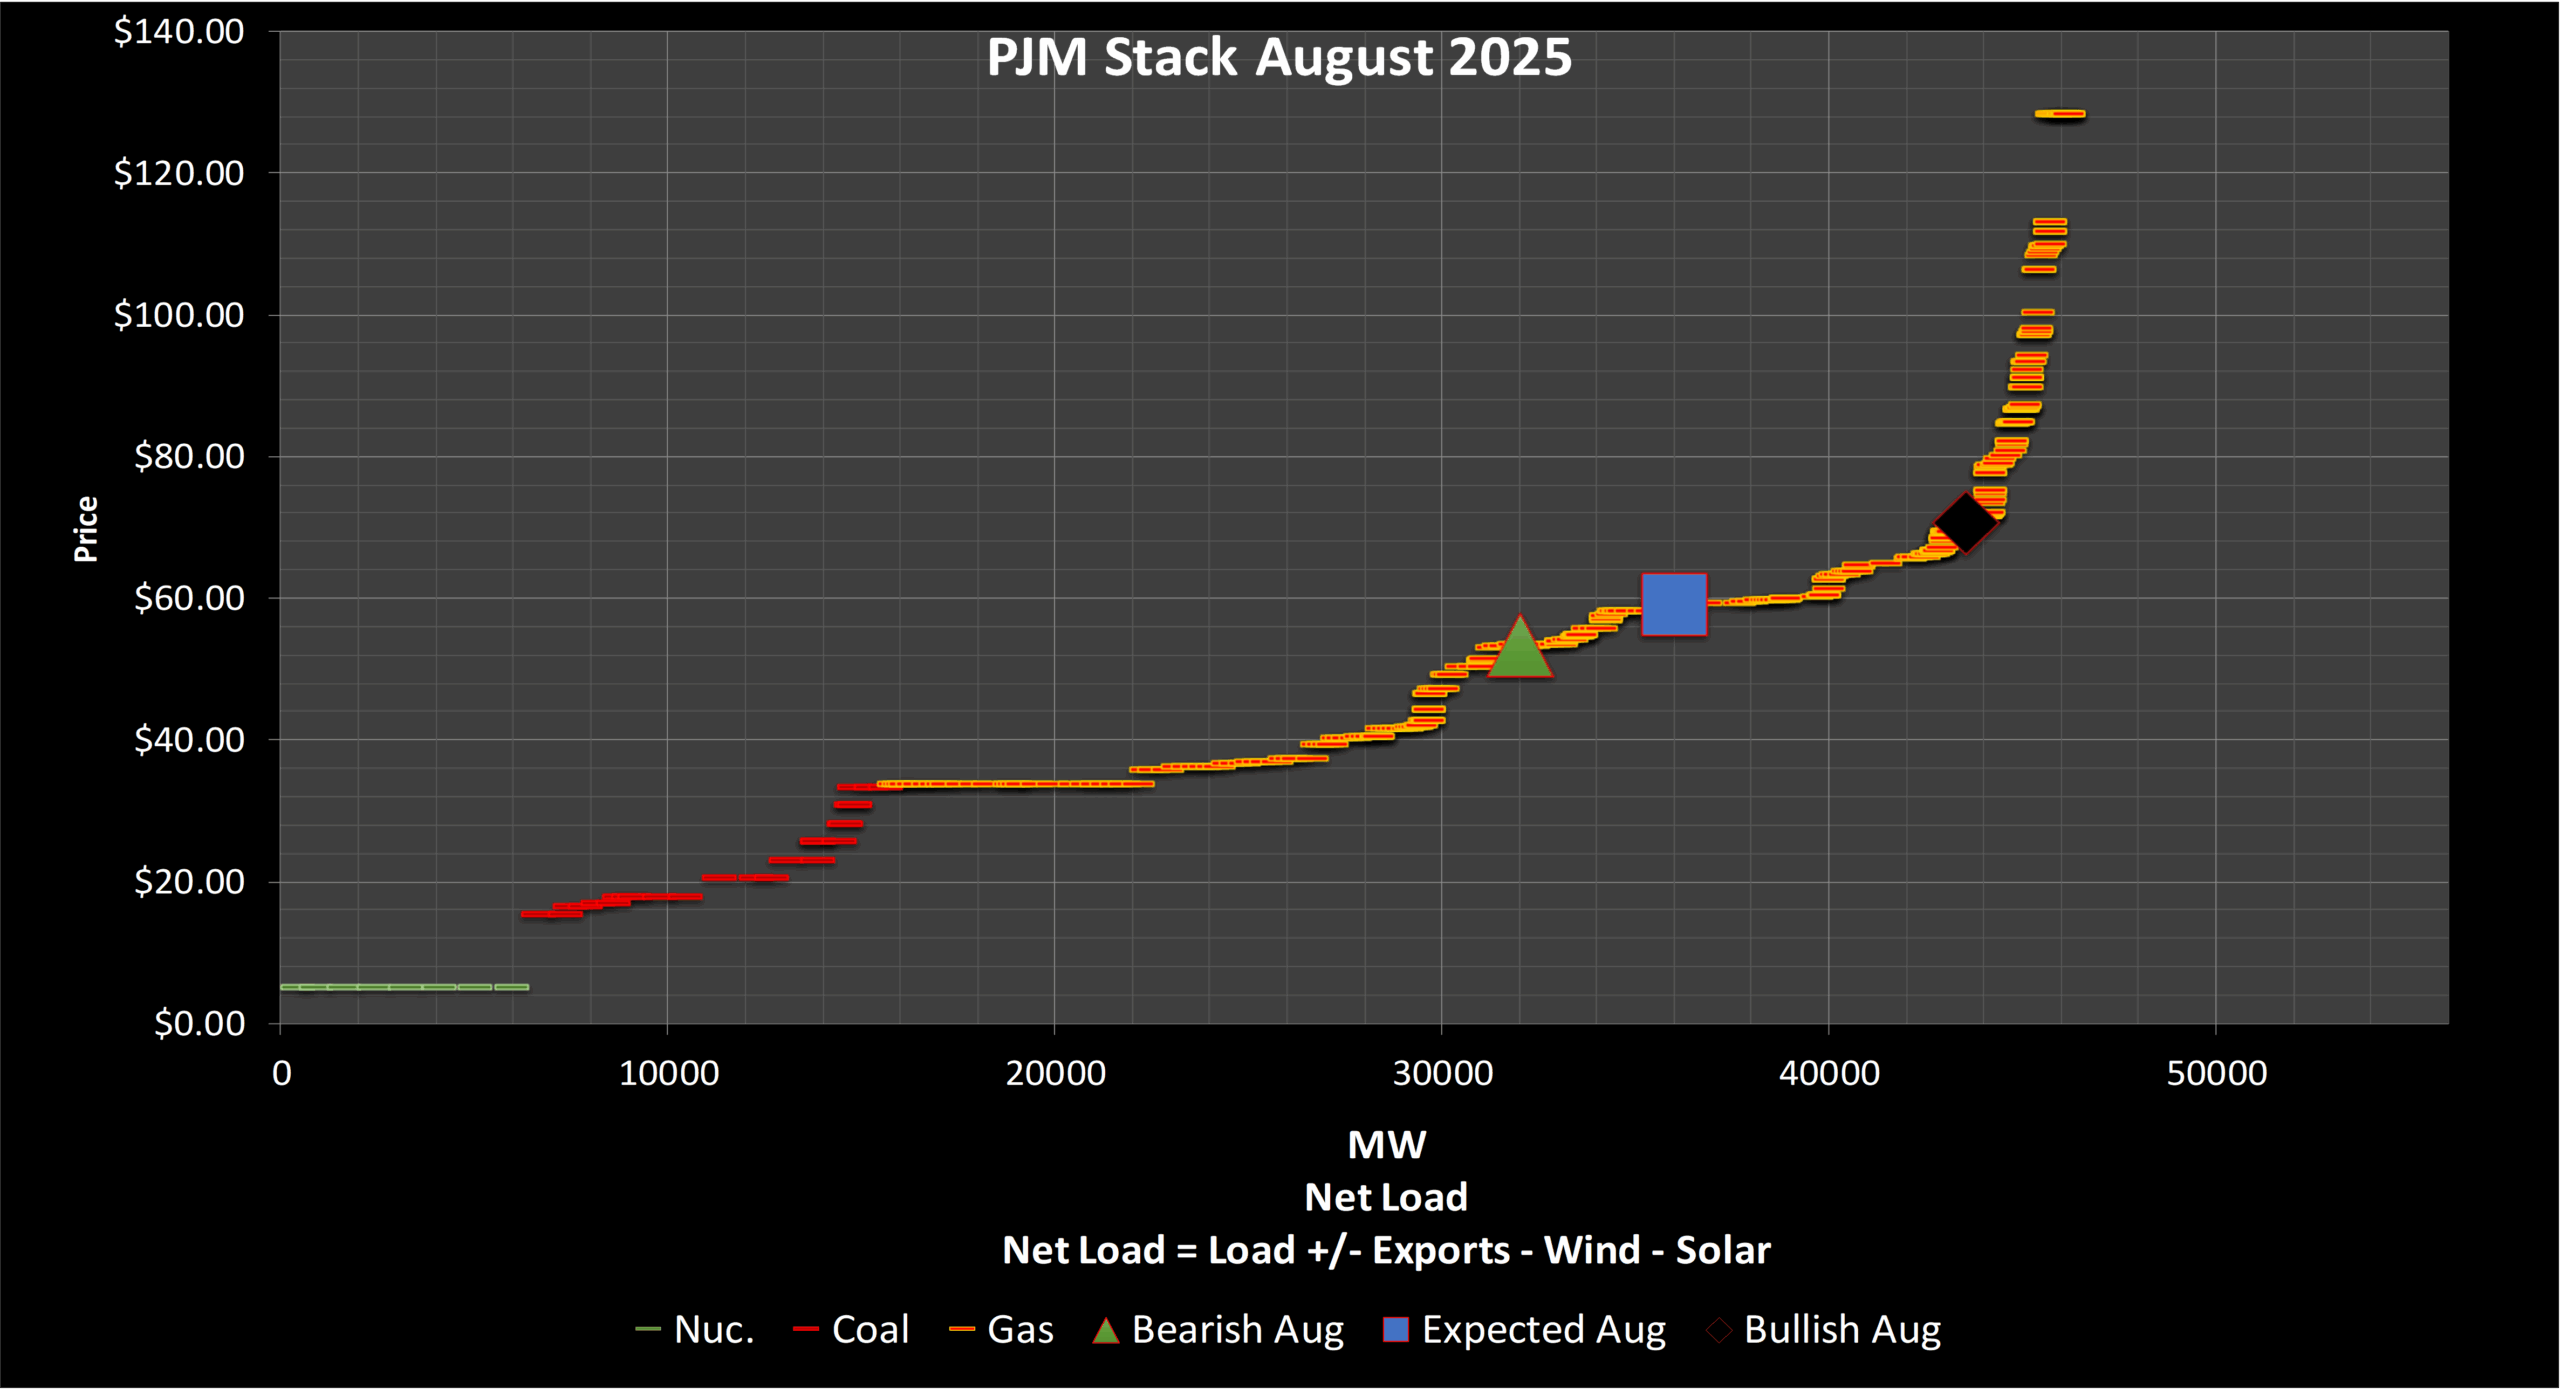
August
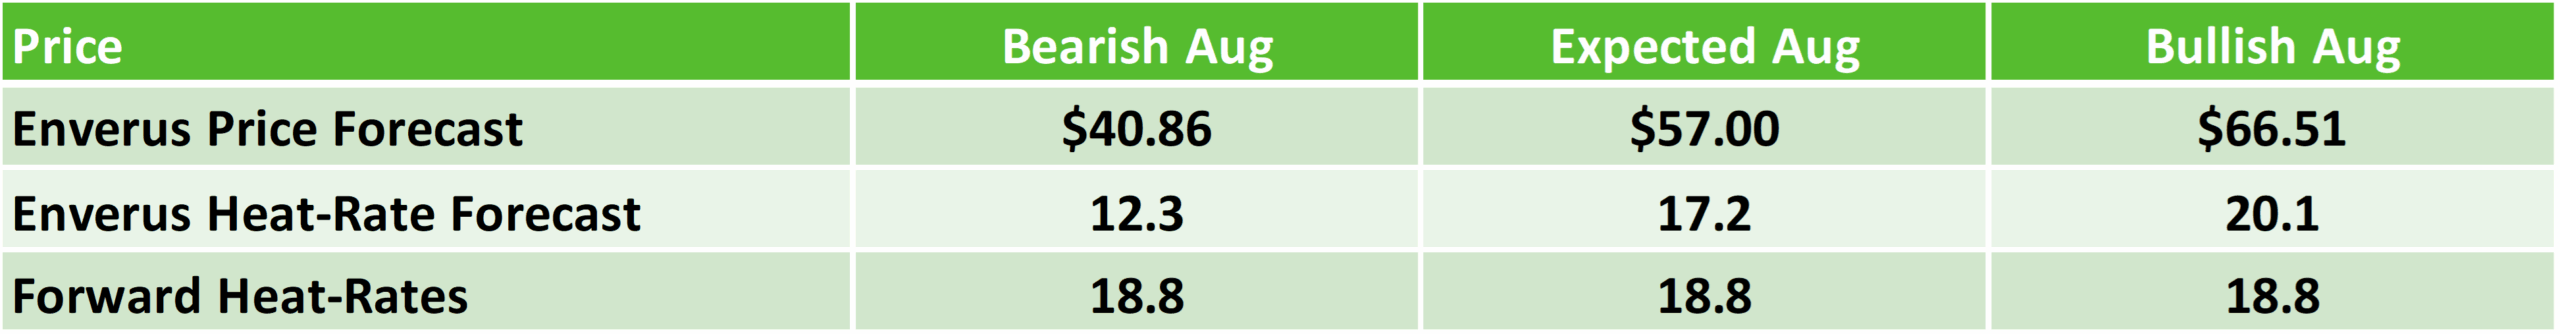
In August our view for below average demand pushes our WHUB On-Peak average heat rate further down the supply stack. Our stack model highlights that the risk premium built into the market heat rate may be overdone.
PJM Stack August 2025 presented by Enverus Power and Renewables Power Market Publications. Gain detailed insights from our analysts on key trends in the power markets and use these insights as a foundation to identify trade adjustments.
CAISO
Load & Generation
ENSO-neutral analog (2014/17) suggest hot summers with peaks above 110°F, while hydro reservoirs at ~120% of average provide resilience.The summer in CAISO is expected to be hotter than average with long duration heat waves.
Outages
Thermal outages are minimal; main risk is variability in behind-the-meter solar output during convective cloud events.
New Builds
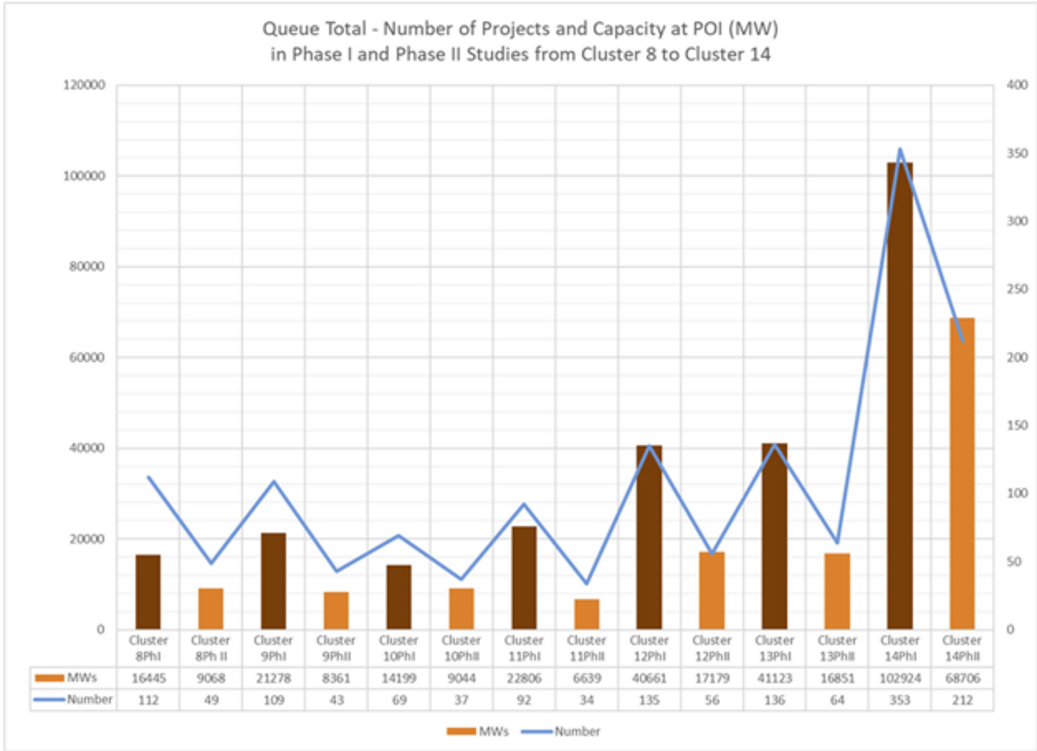
CAISO total number of projects and capacity at POI in the queue presented in Enverus Power and Renewables Power Market Publications. Power Market Publications is six publications in one, offering crucial market insights to help you stay ahead in the power markets.
No major new storage or generation COD this summer; the deep solar and storage queues face delays, yielding fewer near-term additions.
Policy
Senate Bill 540 will codify CAISO Pathways program of creating a Regional Organization (RO) which wouldremove CAISO’s role in the creation of the EDAM rules and regulatory oversight. It is hoped more utilities will join EDAM if the bill is approved.
Heat Rates & Price Forecast
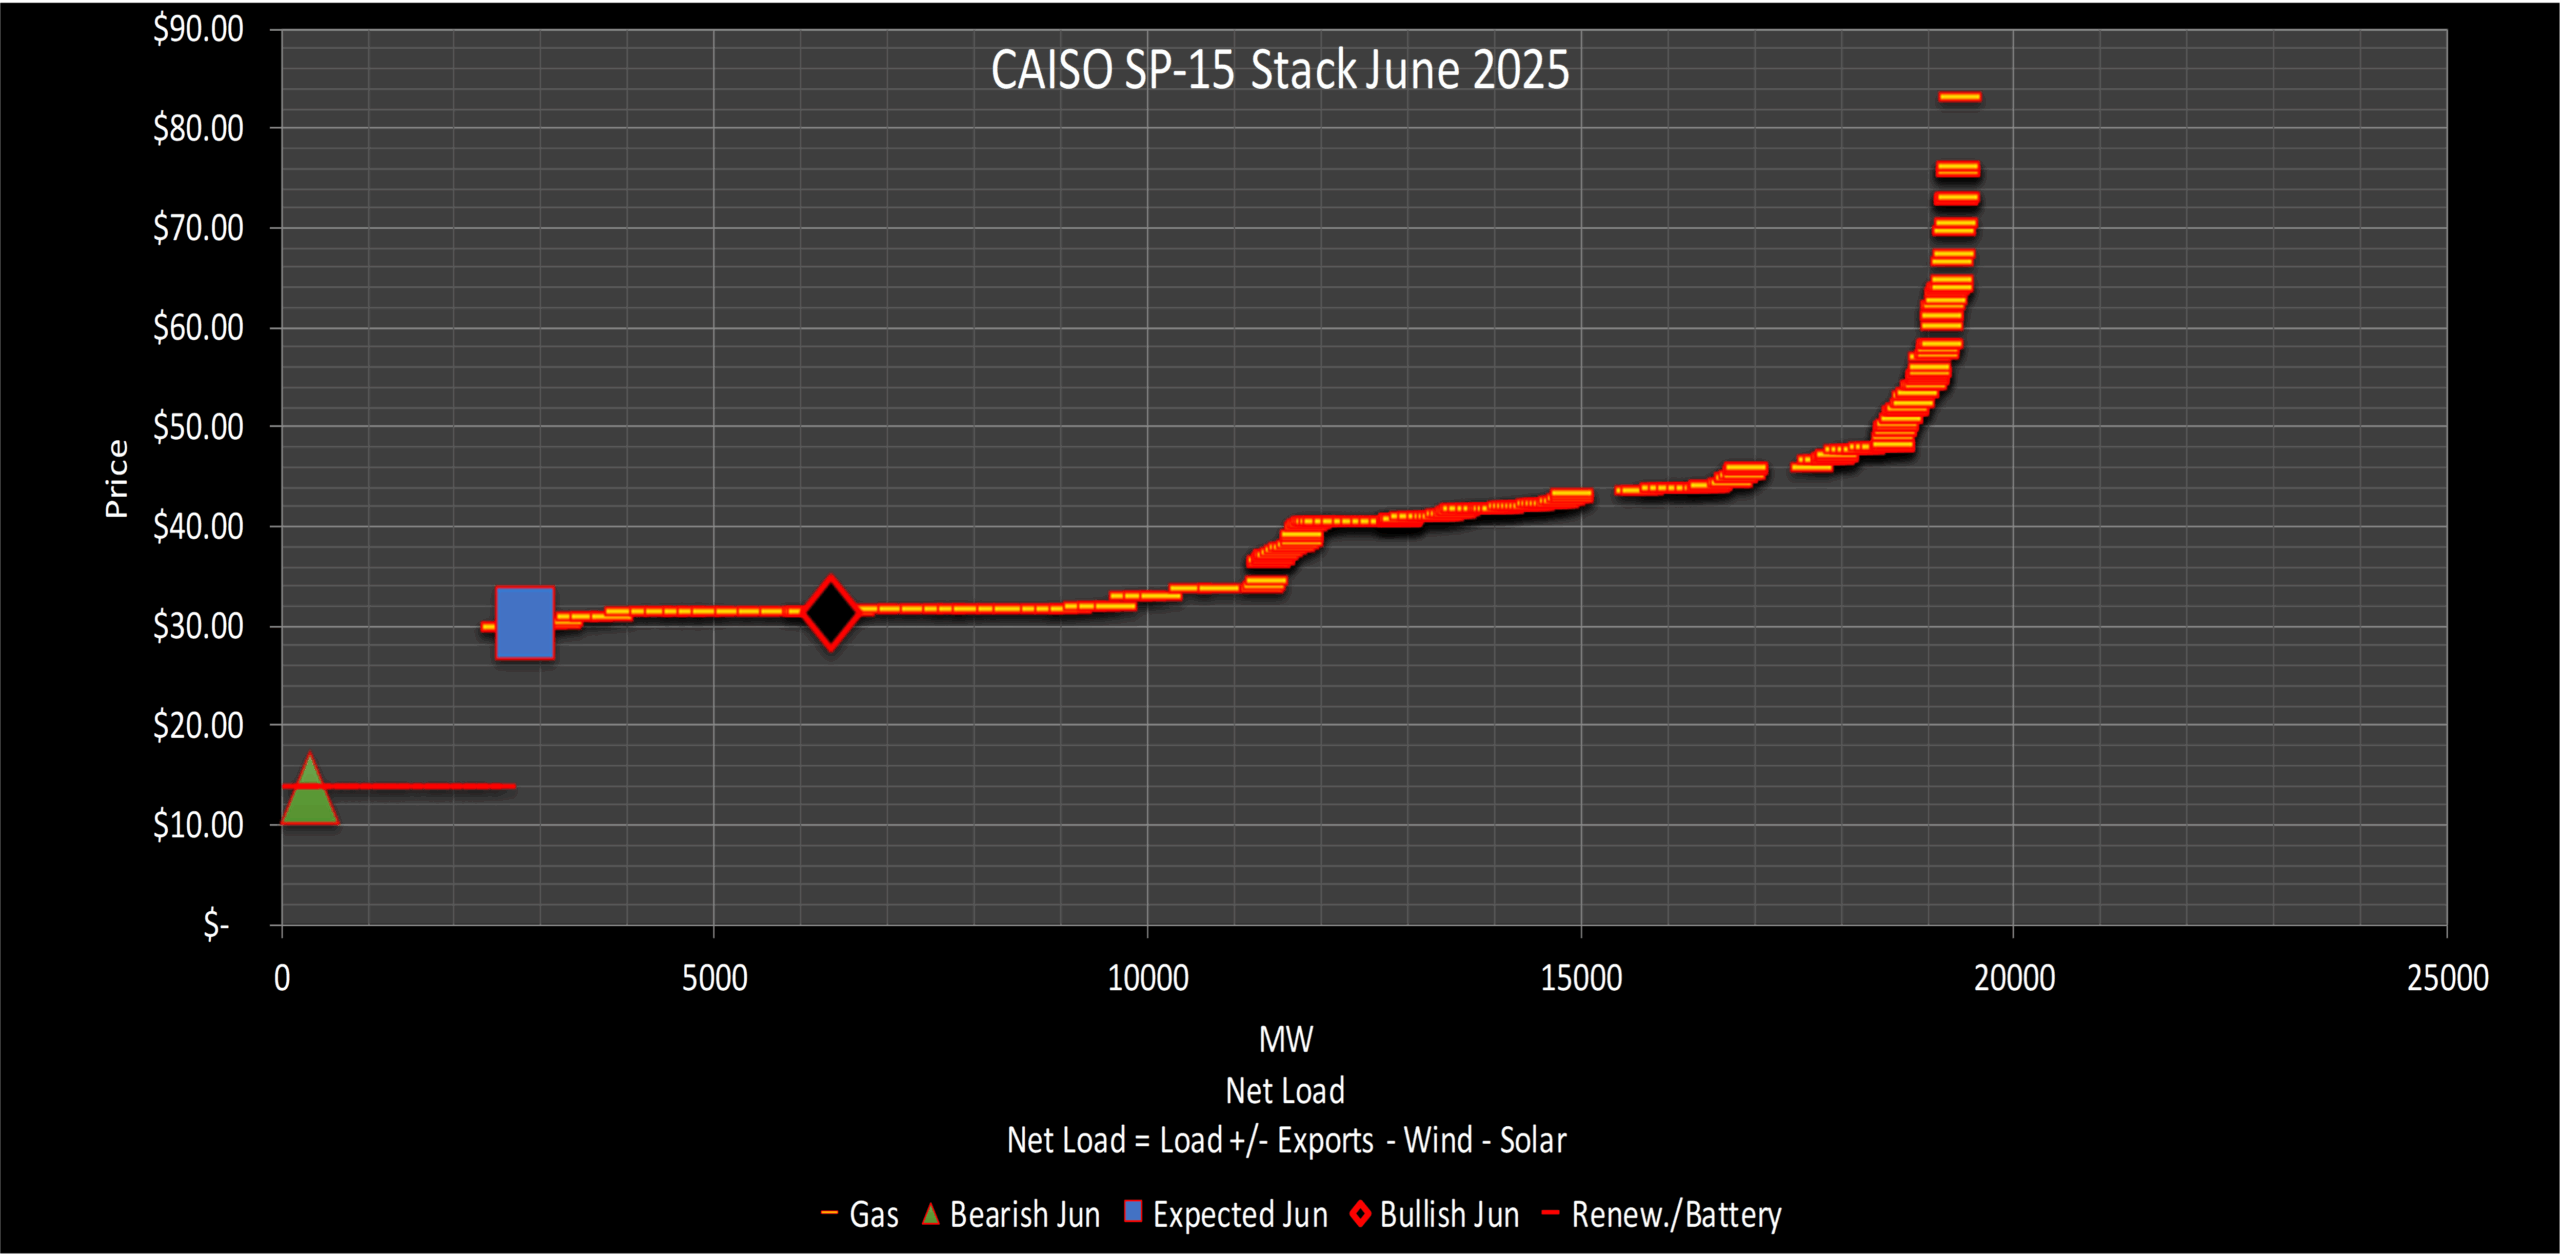
June
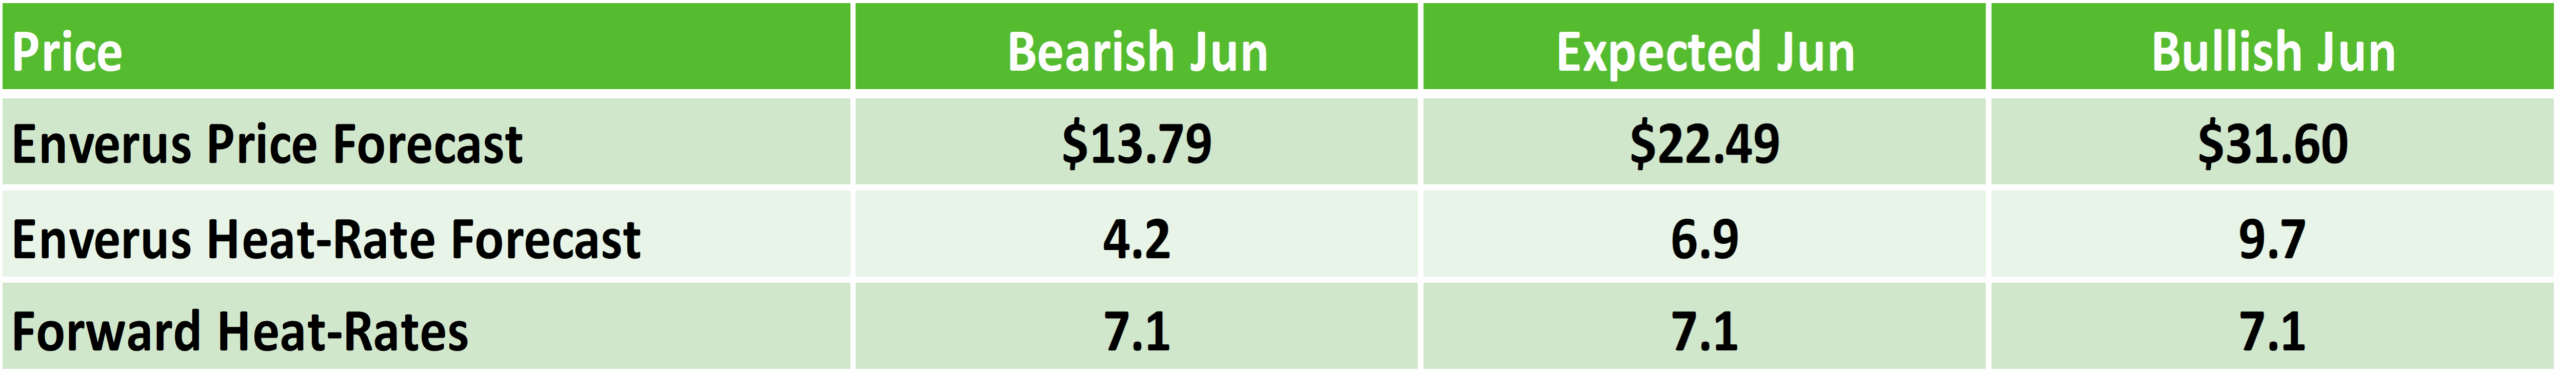
Enverus forecasts June has load above average with wind near average, but a risk of lower wind especially toward the end of the month.
If we have lower wind and multiple heat waves there is a risk that prices could stay in the low $40s (at this gas price) for even more days.
Price volatility could also be a big issue for June with a risk of severe heat waves like those measured in 2017.
CAISO Stack June 2025 presented by Enverus Power and Renewables Power Market Publications. Power Market Publications provides you with insights into price spreads, between trading hubs, informed by transmission congestion and renewable forecasts, helping you find more opportunities and risks faster.
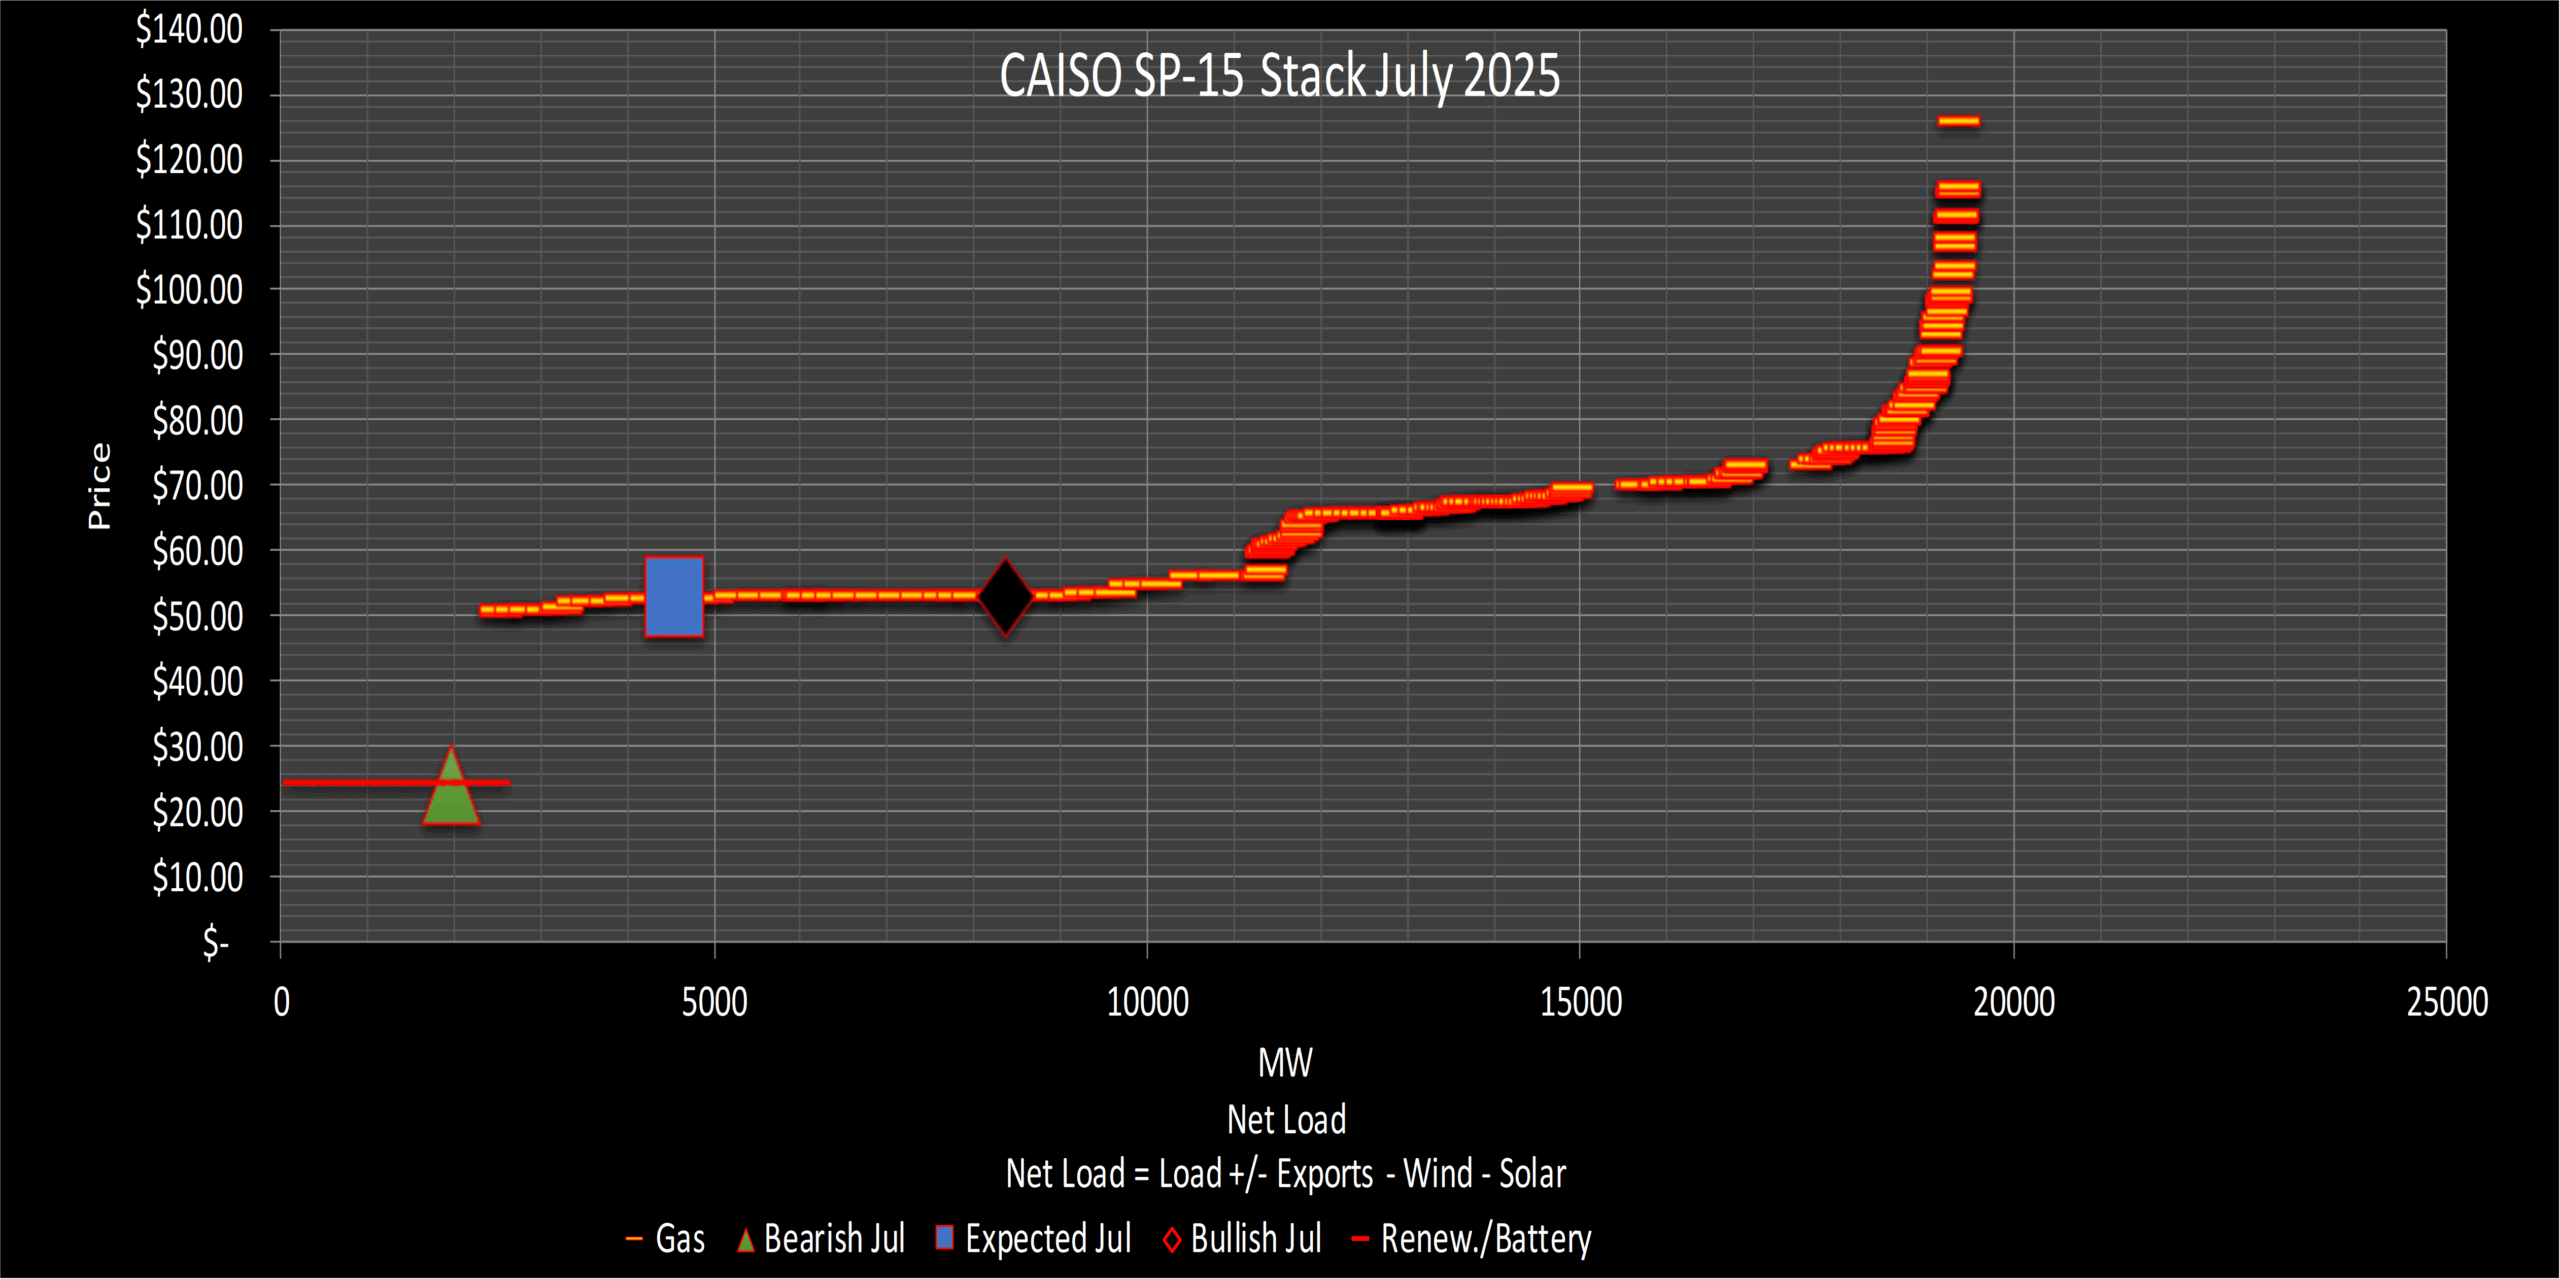
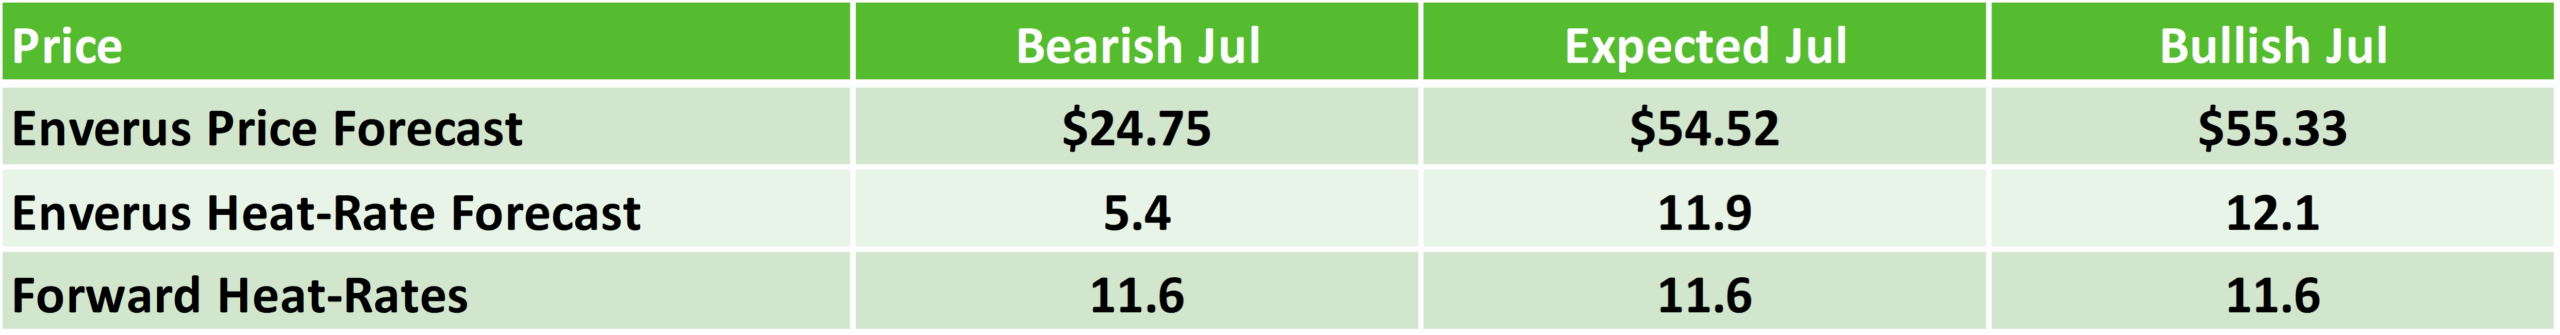
July
Enverus forecast for July has load above average with wind near average, but a risk of lower wind is the case again with hot temperatures in the coastal areas.
If we have lower wind and multiple heat waves there is a risk of prices moving into the $70s and $80s multiple days.
CAISO Stack July 2025 presented by Enverus Power and Renewables Power Market Publications. Gain detailed insights from our analysts on key trends in the power markets and use these insights as a foundation to identify trade adjustments.
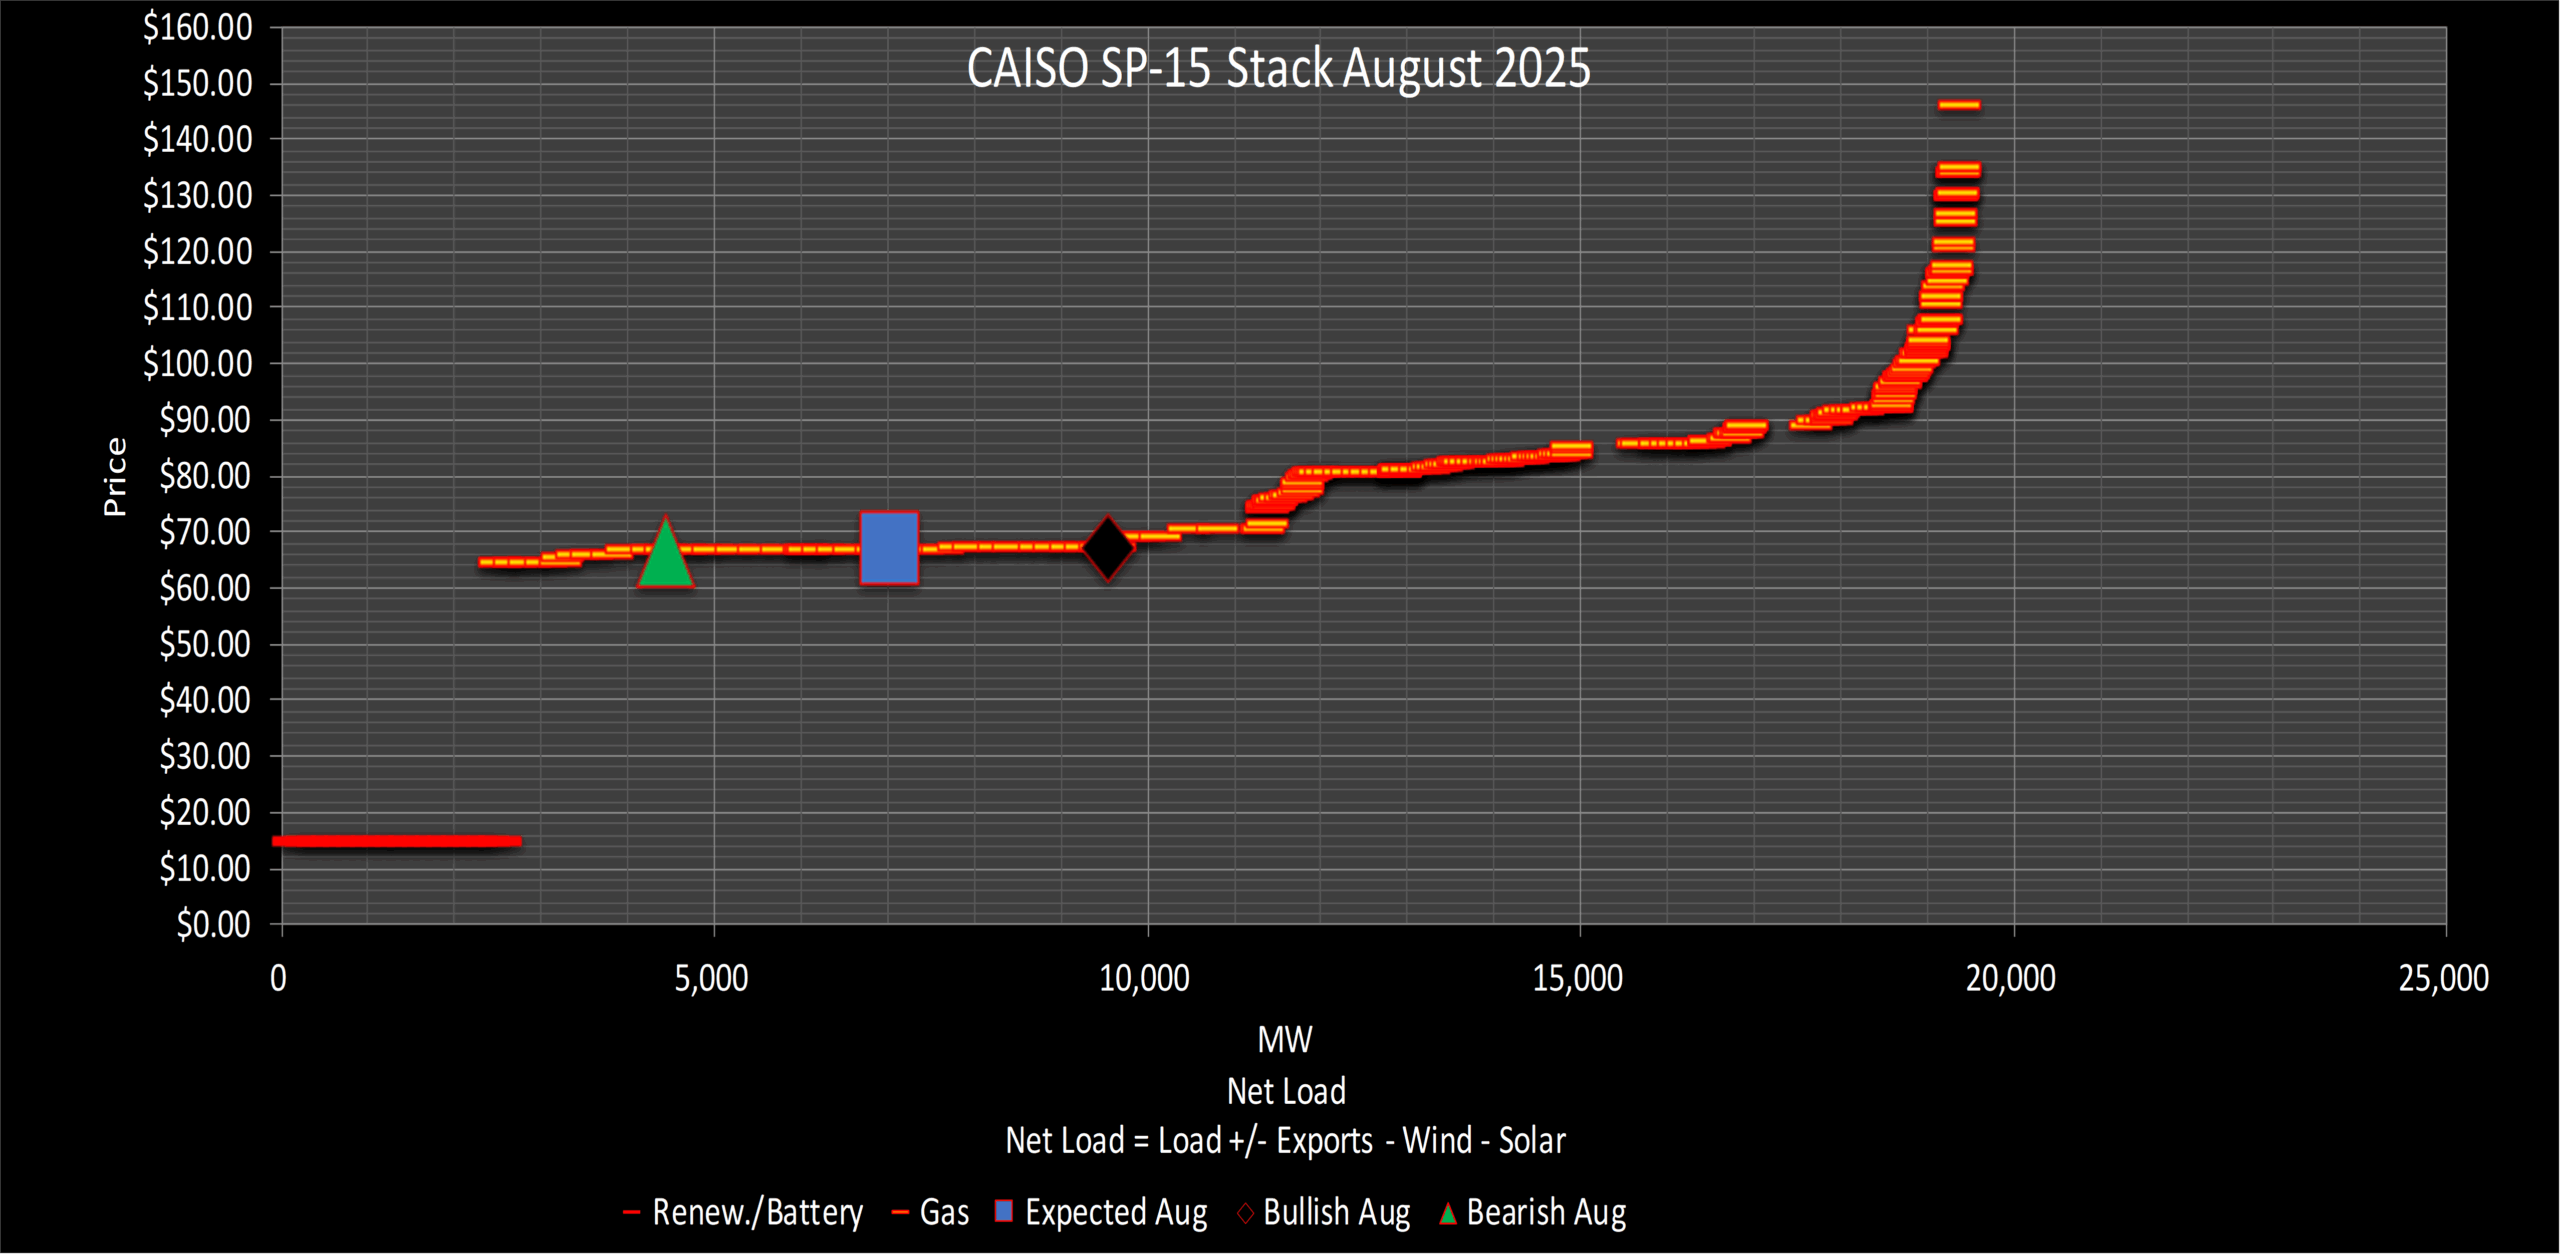
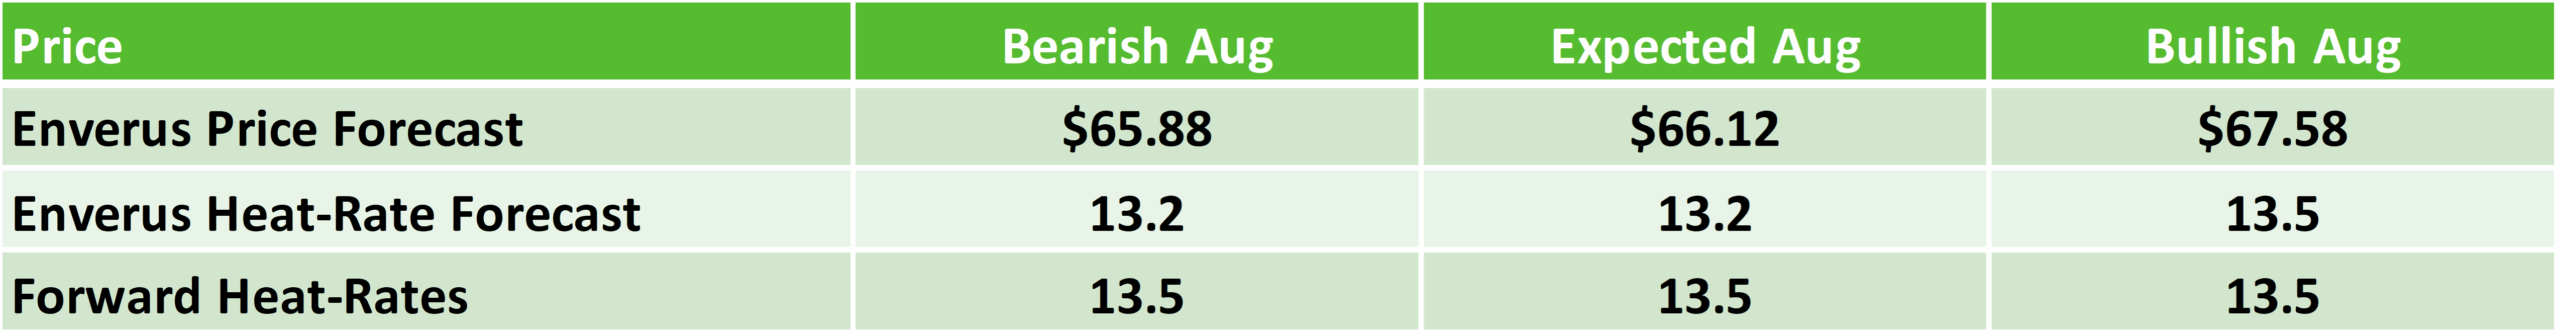
August
Enverus forecast for August has load near average with wind near average, but a risk of lower wind is the case again with hot temperatures in the coastal areas.
If solar is below average and if we were to get heat waves that correspond with the low solar there is a risk that prices could stay in the $80s and $90s for multiple days.
CAISO Stack August 2025 presented by Enverus Power and Renewables Power Market Publications. The seasoned analysts provide fresh perspectives on the power markets, offering insights and strategies that may not have been previously considered, elevating your team’s market analysis.
Mid-Columbia (Mid-C)
Load & Generation
Summer hydro peaks in May; June–August flows expected at 90–100% of average due to coordinated flood-control swaps, mitigating drought impact. The summer in NW is expected to be hotter than average with longer duration heat waves.
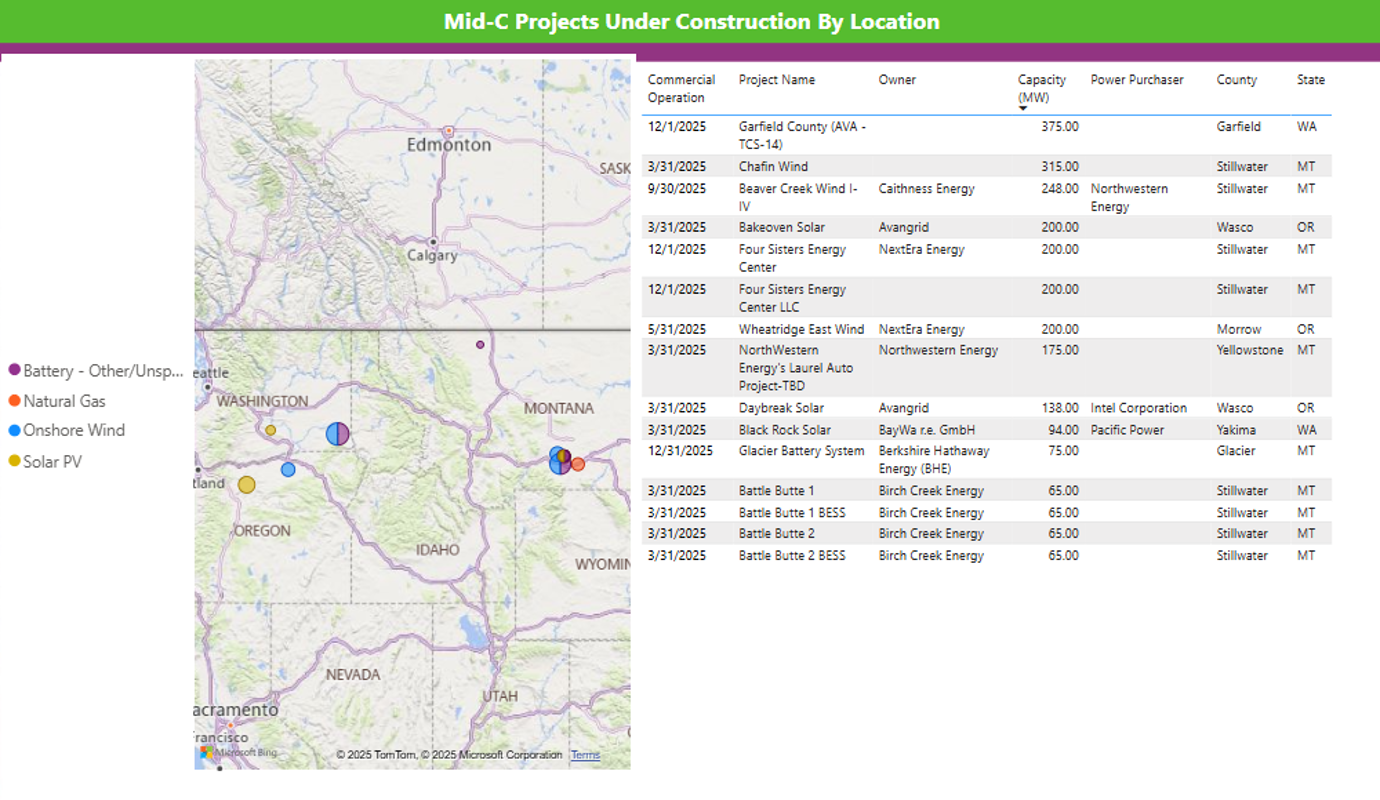
New Builds
Battery storage queue is poised for delivery; solar CODs this summer are few.
Mid-C Power Unit New Builds presented in Enverus Power and Renewables Power Market Publications. Power Market Publications is six publications in one, offering crucial market insights to help you stay ahead in the power markets.
Policy
U.S.-Canada treaty changes make more water available from Canada.
Heat Rates & Price Forecast
June
The Enverus Mid-C On-Peak (Heavy Load) shows heat rates for June bearish to the market.
Our view for above average load and a risk for well below average hydro-generation during the month is framing our Mid-C heat rate at 16.9. It appears the market likes the risk premium for a “heat wave” like event combined with below average hydro generation. Enverus likes that scenario, too, and our bullish scenario reflects that possibility.
Mid-C Stack June 2025 presented by Enverus Power and Renewables Power Market Publications. Power Market Publications provides you with insights into price spreads, between trading hubs, informed by transmission congestion and renewable forecasts, helping you find more opportunities and risks faster.
July
The Enverus Mid-C On-Peak (Heavy Load) shows heat rates for Julythat are bearish to the market.
Our view for below average load and a risk of above average wind puts our forecast well below the market. If the market is pricing July to be off the stack most of the month, in scarcity conditions, and this would be the case if the month turns out to be hot (above average load) with below average wind. If this is the case the market outlook could be on the mark.
Mid-C Stack July 2025 presented by Enverus Power and Renewables Power Market Publications. Gain detailed insights from our analysts on key trends in the power markets and use these insights as a foundation to identify trade adjustments.
August
For August we expect volatile prices as we are on the inflection point of the stack.
Our bullish scenario has us off the stack with scarcity prices if August is very hot with low wind generation.
The market seems to be assessing the above-mentioned conditions for August.
Mid-C Stack August 2025 presented by Enverus Power and Renewables Power Market Publications. The seasoned analysts provide fresh perspectives on the power markets, offering insights and strategies that may not have been previously considered, elevating your team’s market analysis.
NYISO
Load & Generation
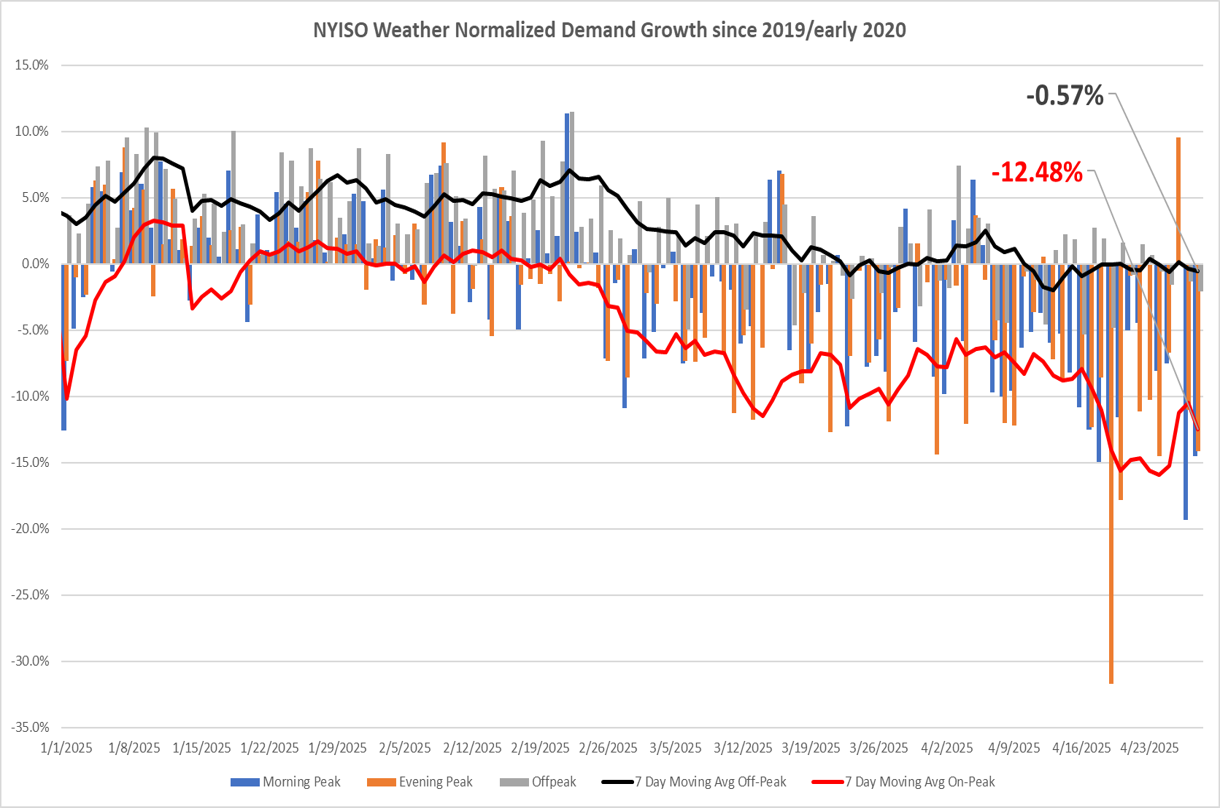
DER growth (solar + BESS) delays daytime peaks; on-peak load growth ~2% Y/Y.The summer in NYISO is expected to be cooler than average with short duration heat waves.
NYISO Weather Normalized Demand Growth presented by Enverus Power and Renewables Power Market Publications. Backed by a team of power analysts with decades of hands-on power market experience, Power Market Publications helps users make higher quality decisions.
Outages
Limited native generation outages; SmartPath Connect (1GW) and CHPE (1.2GW) HVDC lines COD in 2026–27 will bolster imports.
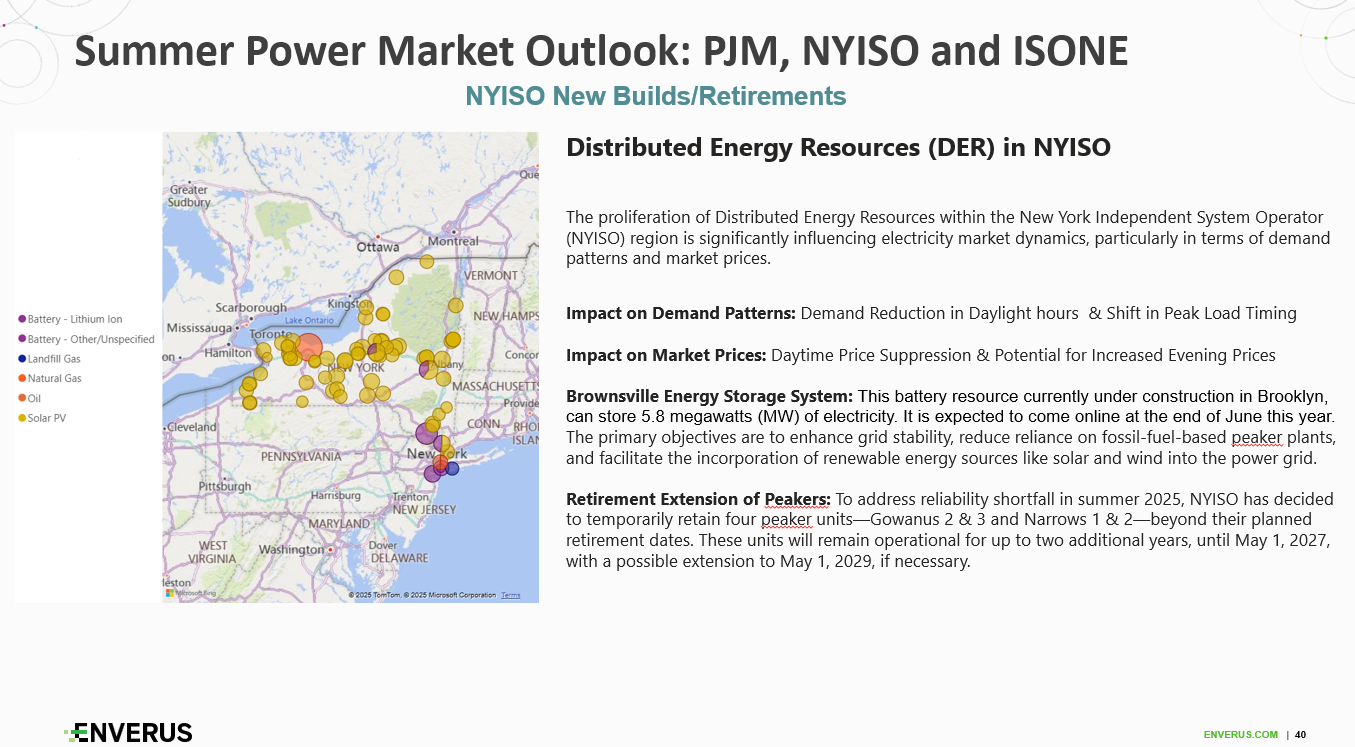
New Builds & Retirements
Brooklyn 5.8MW BESS COD in June; peaker retirements deferred to 2027 to ensure adequacy.
NYISO Power Unit New Builds presented in Enverus Power and Renewables Power Market Publications. Power Market Publications is six publications in one, offering crucial market insights to help you stay ahead in the power markets.
Policy
Battery participation in ancillary services is saturated, and new DER integration incentives shape dispatch.
Heat Rates & Price Forecast
June
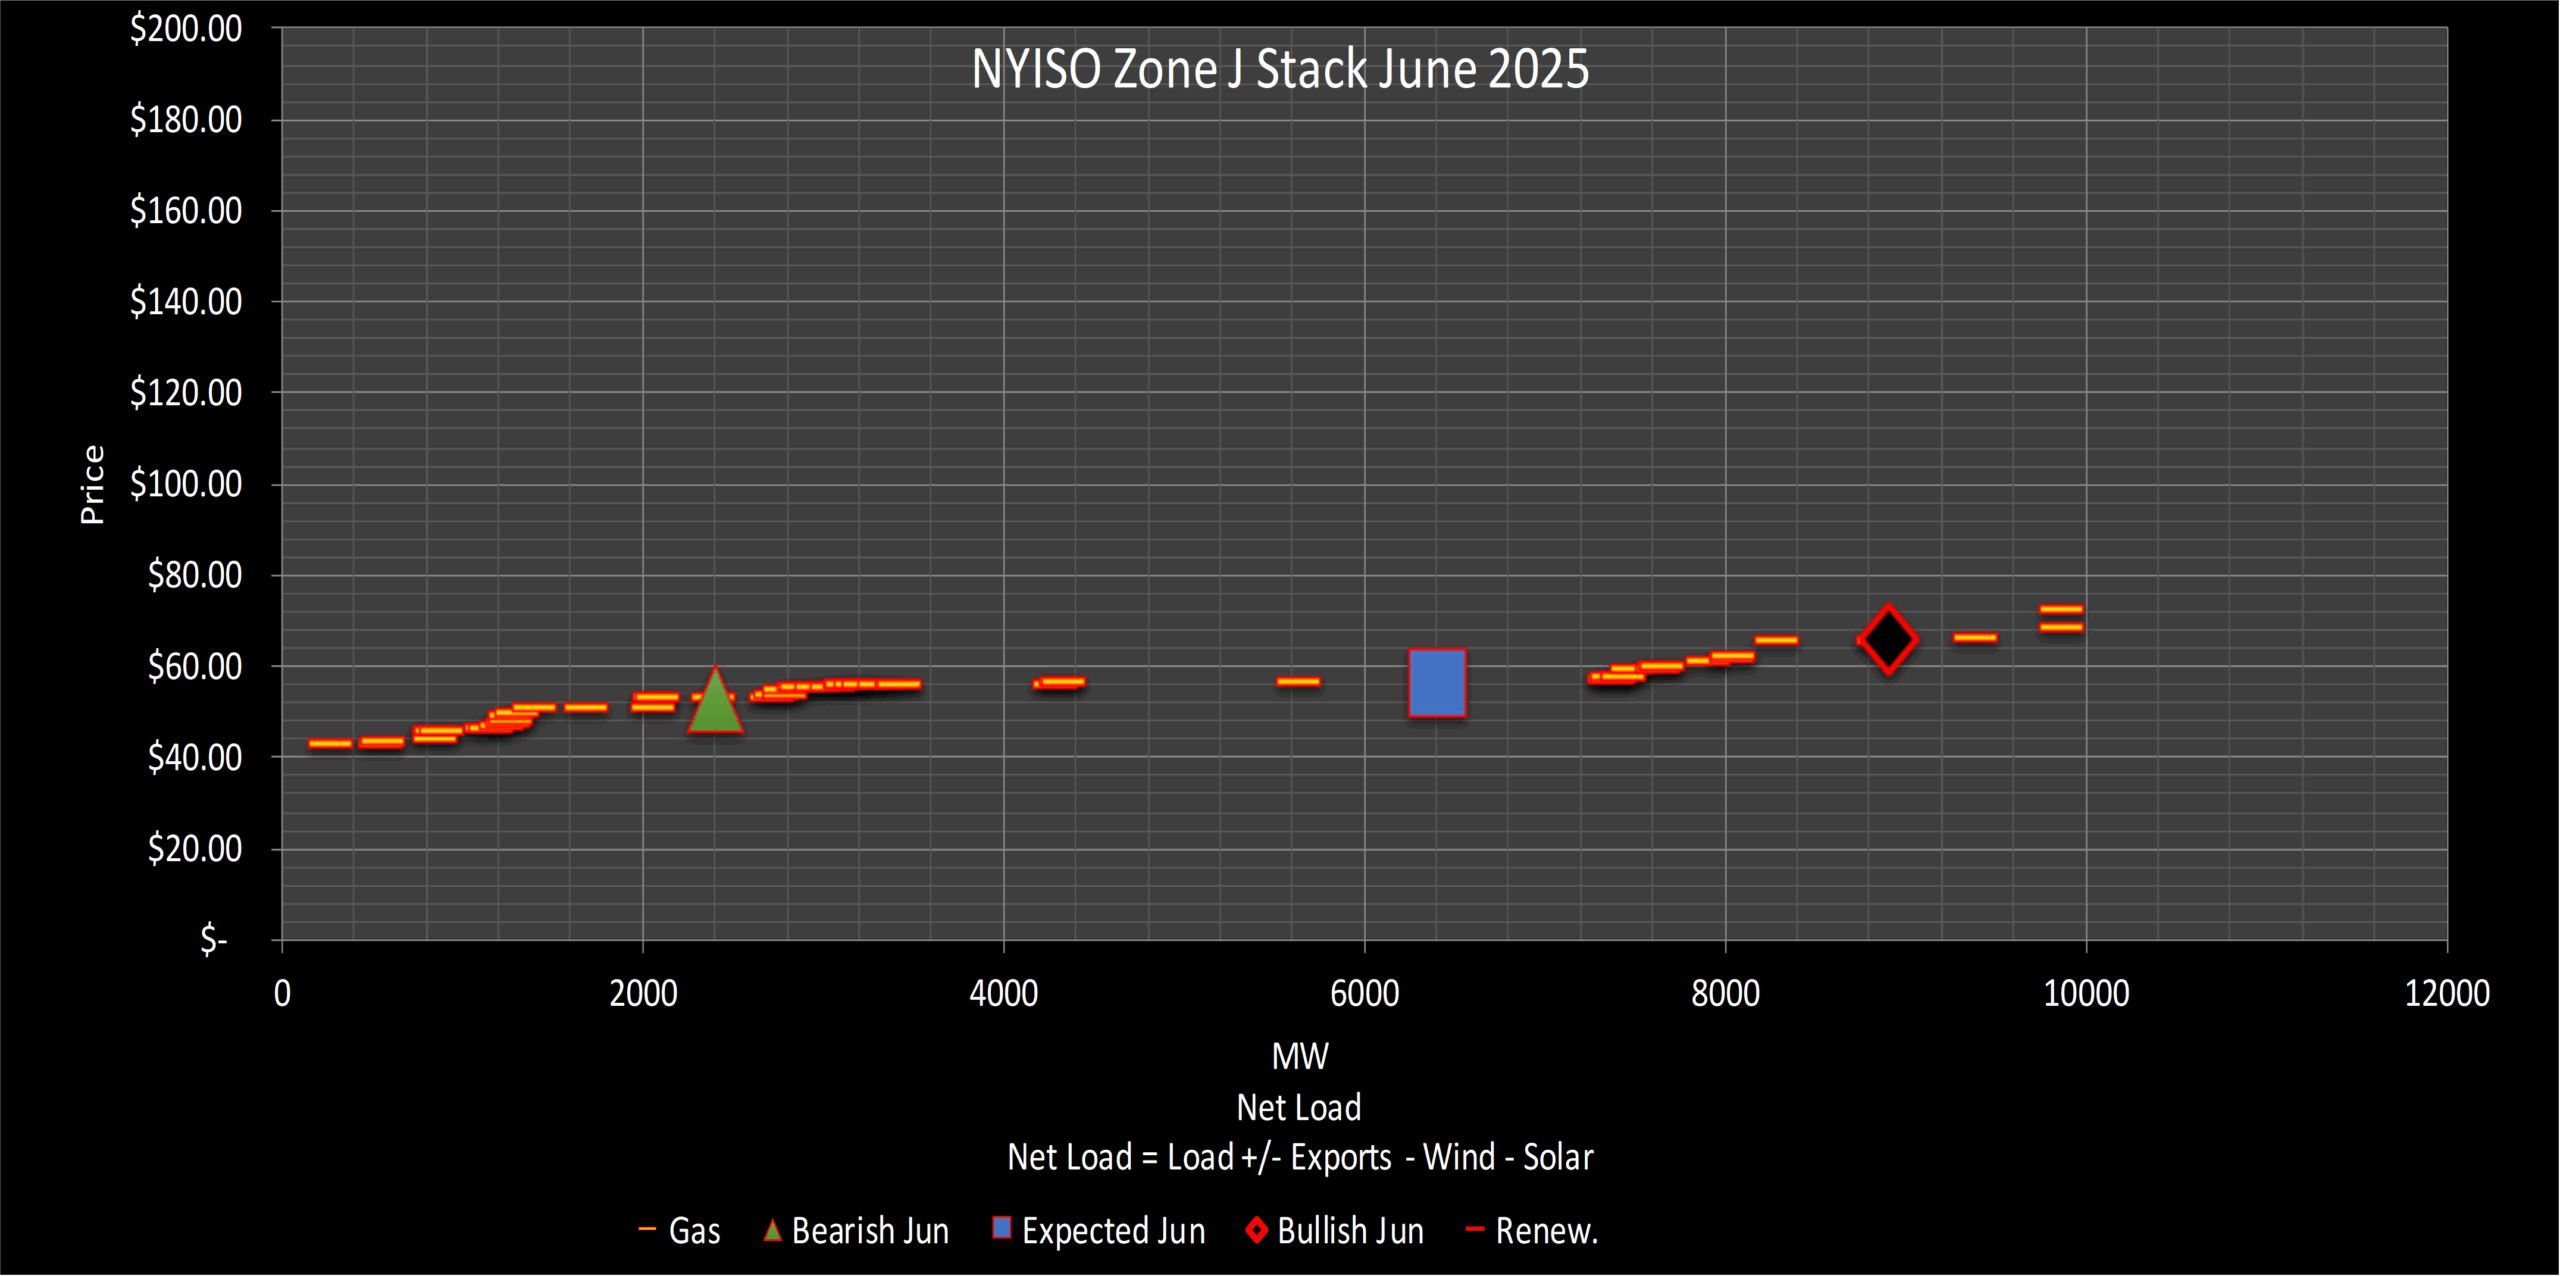
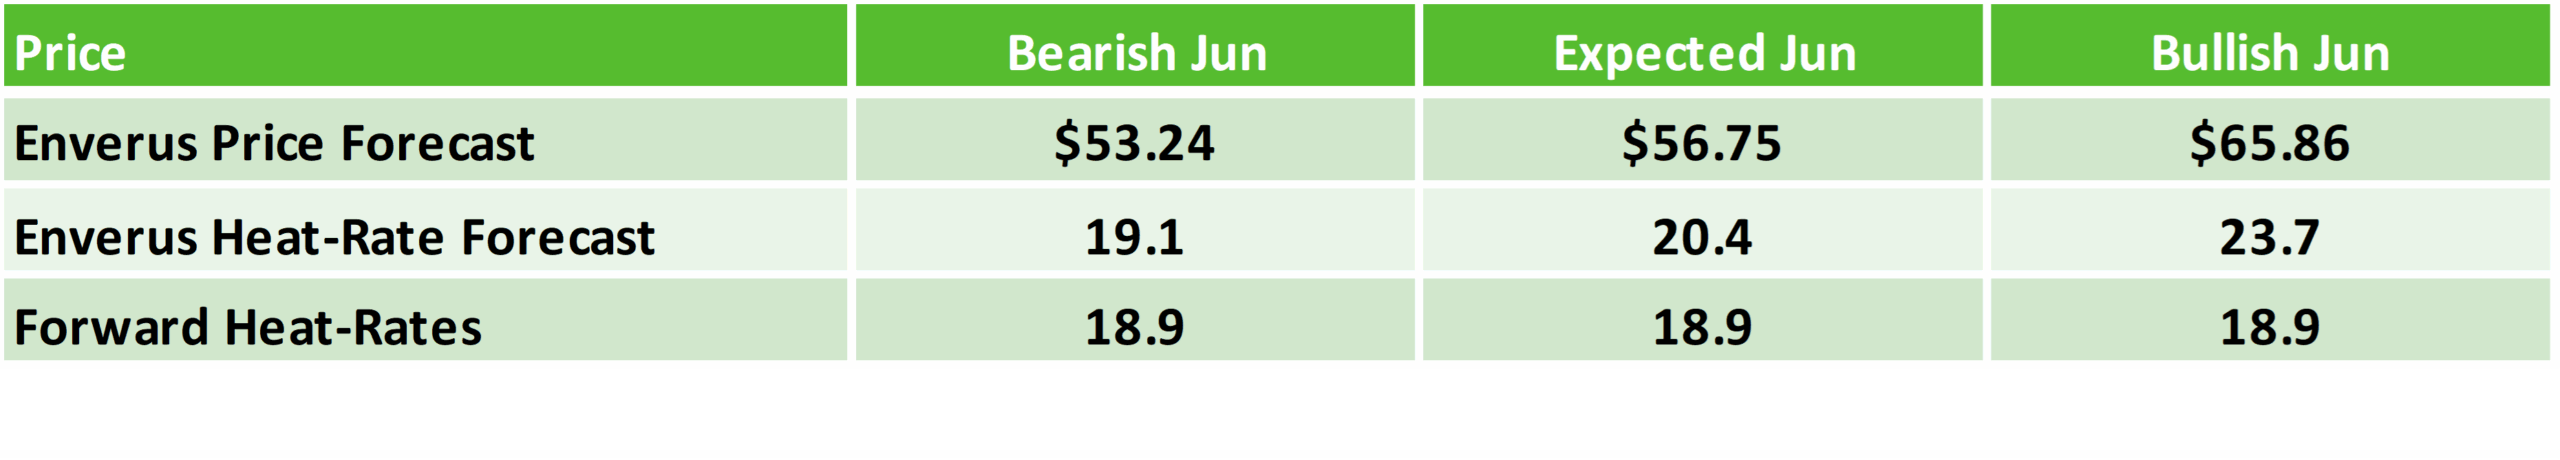
June will see average demand in NYISO region driven by mostly seasonal temperatures. Our current base case scenario is above the market. We see more risk of bearish prices in the month coming from below average load. Additional congestion can have bullish impact on the zone J prices during heat waves.
Improving drought conditions in the ISO region are expected to lessen the impact of prolonged heat waves, potentially reducing the risk of elevated power prices and volatility in June.
NYISO June 2025 presented by Enverus Power and Renewables Power Market Publications. Power Market Publications provides you with insights into price spreads, between trading hubs, informed by transmission congestion and renewable forecasts, helping you find more opportunities and risks faster.
July
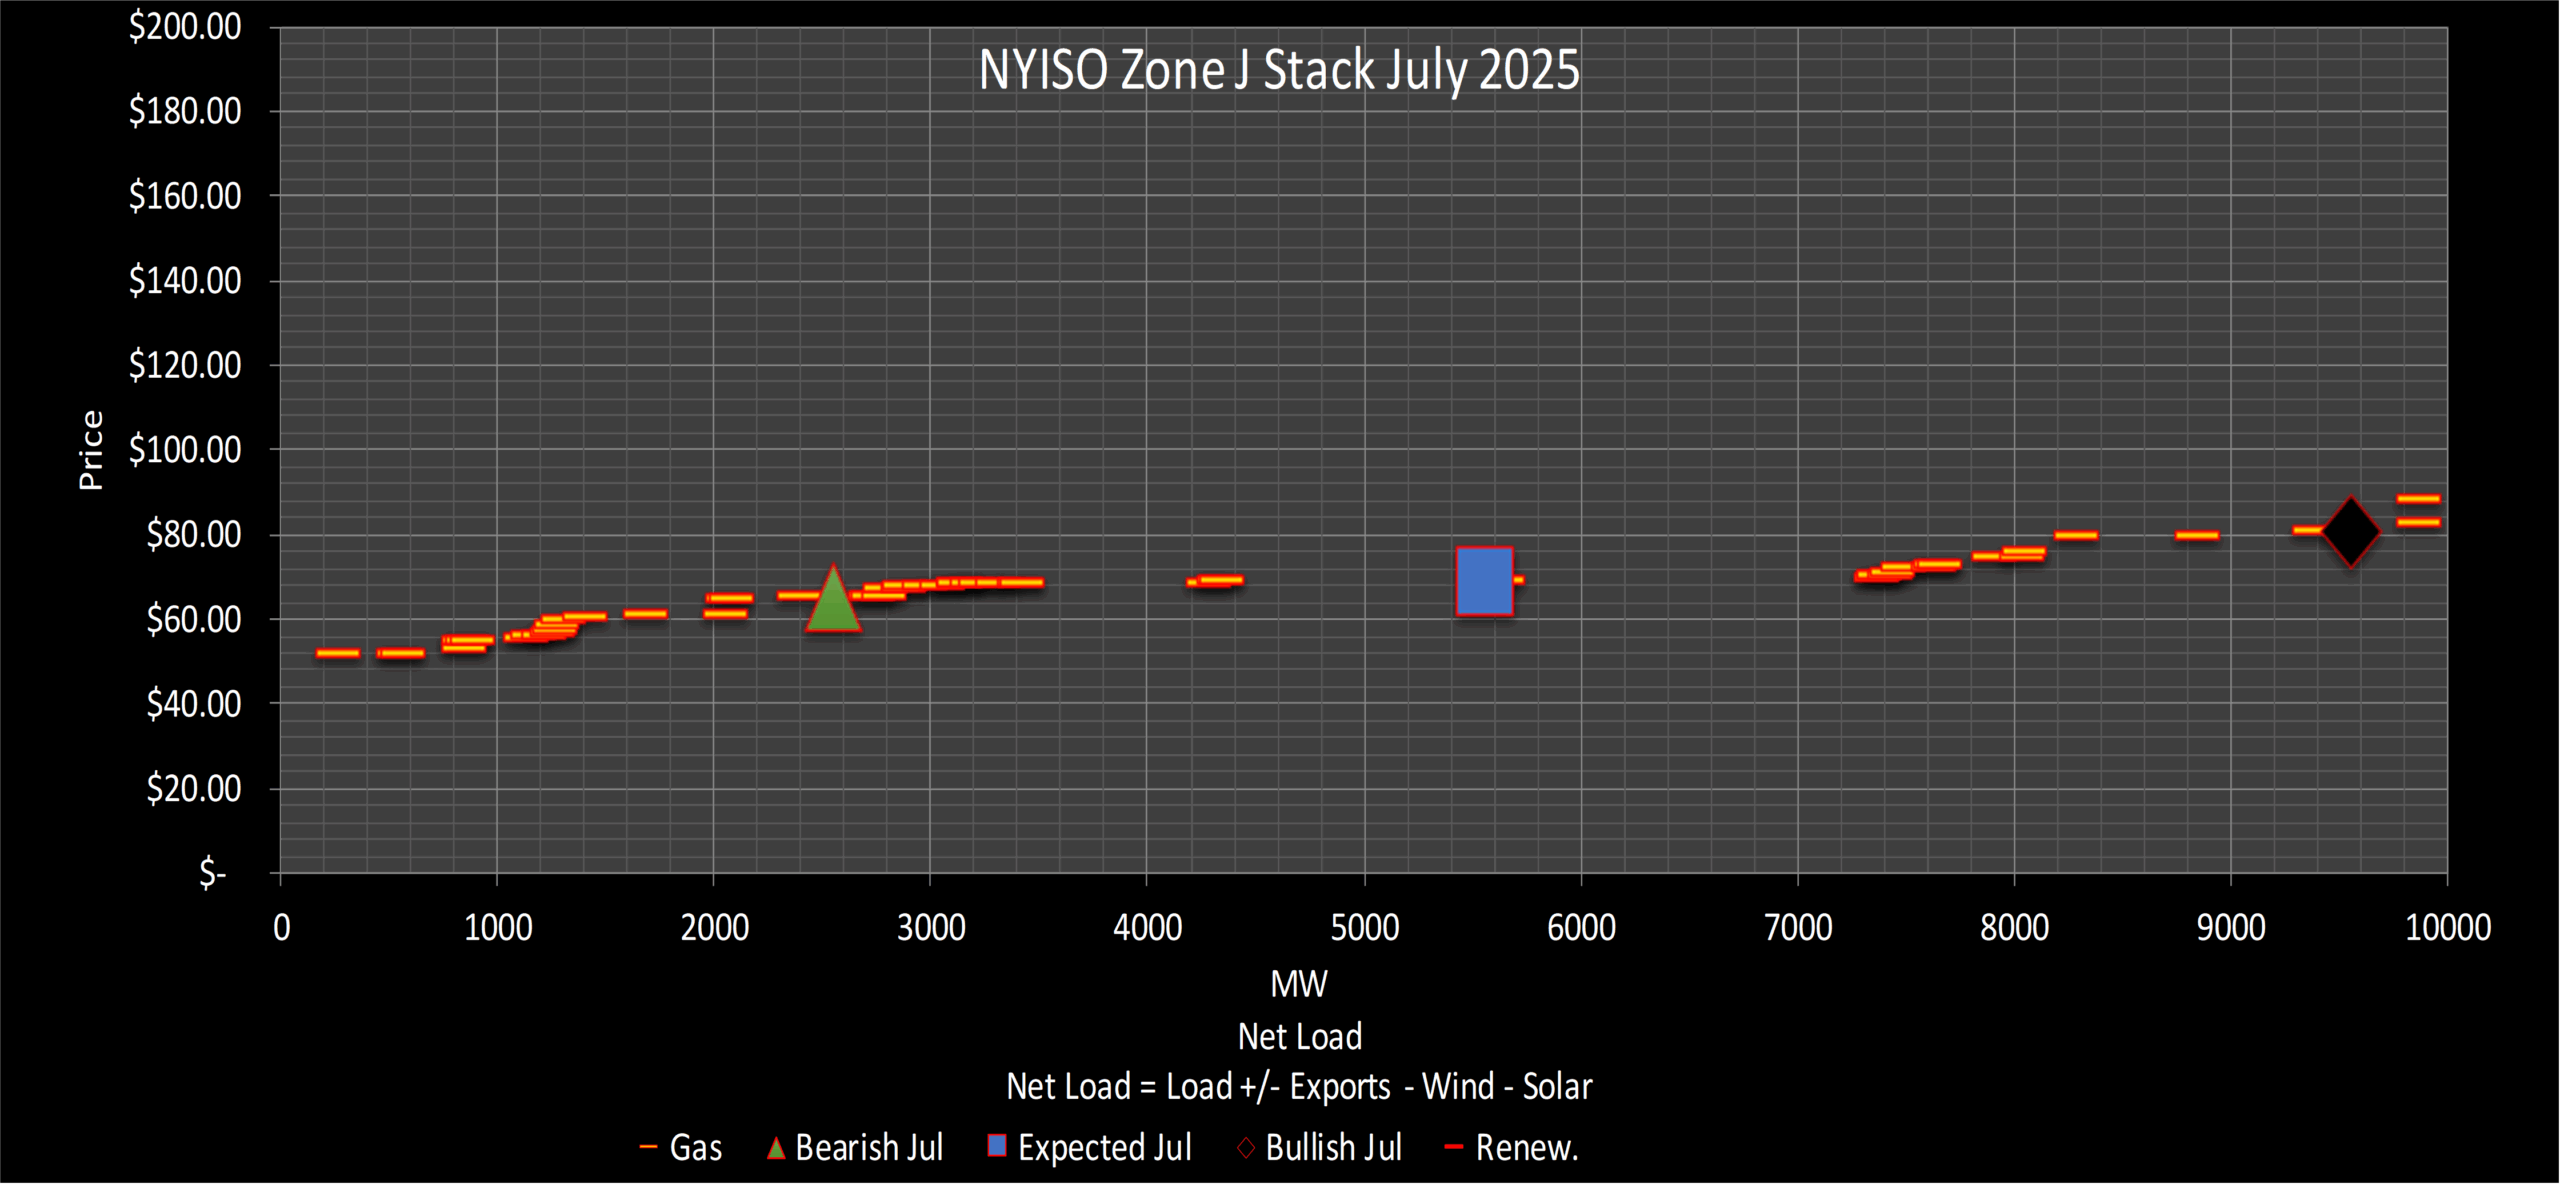
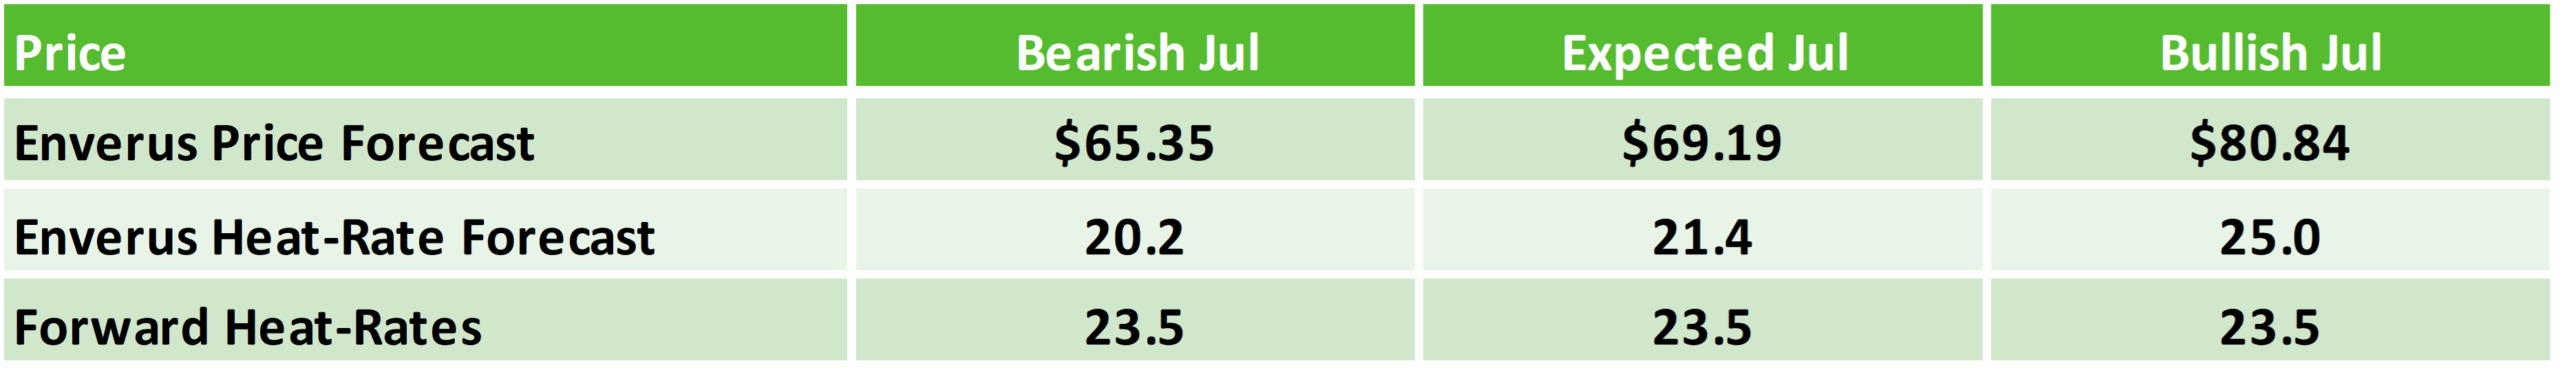
July will see below average demand in NYISO region driven by below seasonal temperatures. Our selected analog years suggest that ENSO-neutral type brings unusual weather patterns. High demand in NYC can increase local congestion. This can have bullish impact on the zone J prices.
Improving drought conditions in the ISO region are expected to lessen the impact of prolonged heat waves, potentially reducing the risk of elevated power prices and volatility in July.
NYISO Stack July 2025 presented by Enverus Power and Renewables Power Market Publications. Gain detailed insights from our analysts on key trends in the power markets and use these insights as a foundation to identify trade adjustments.
August
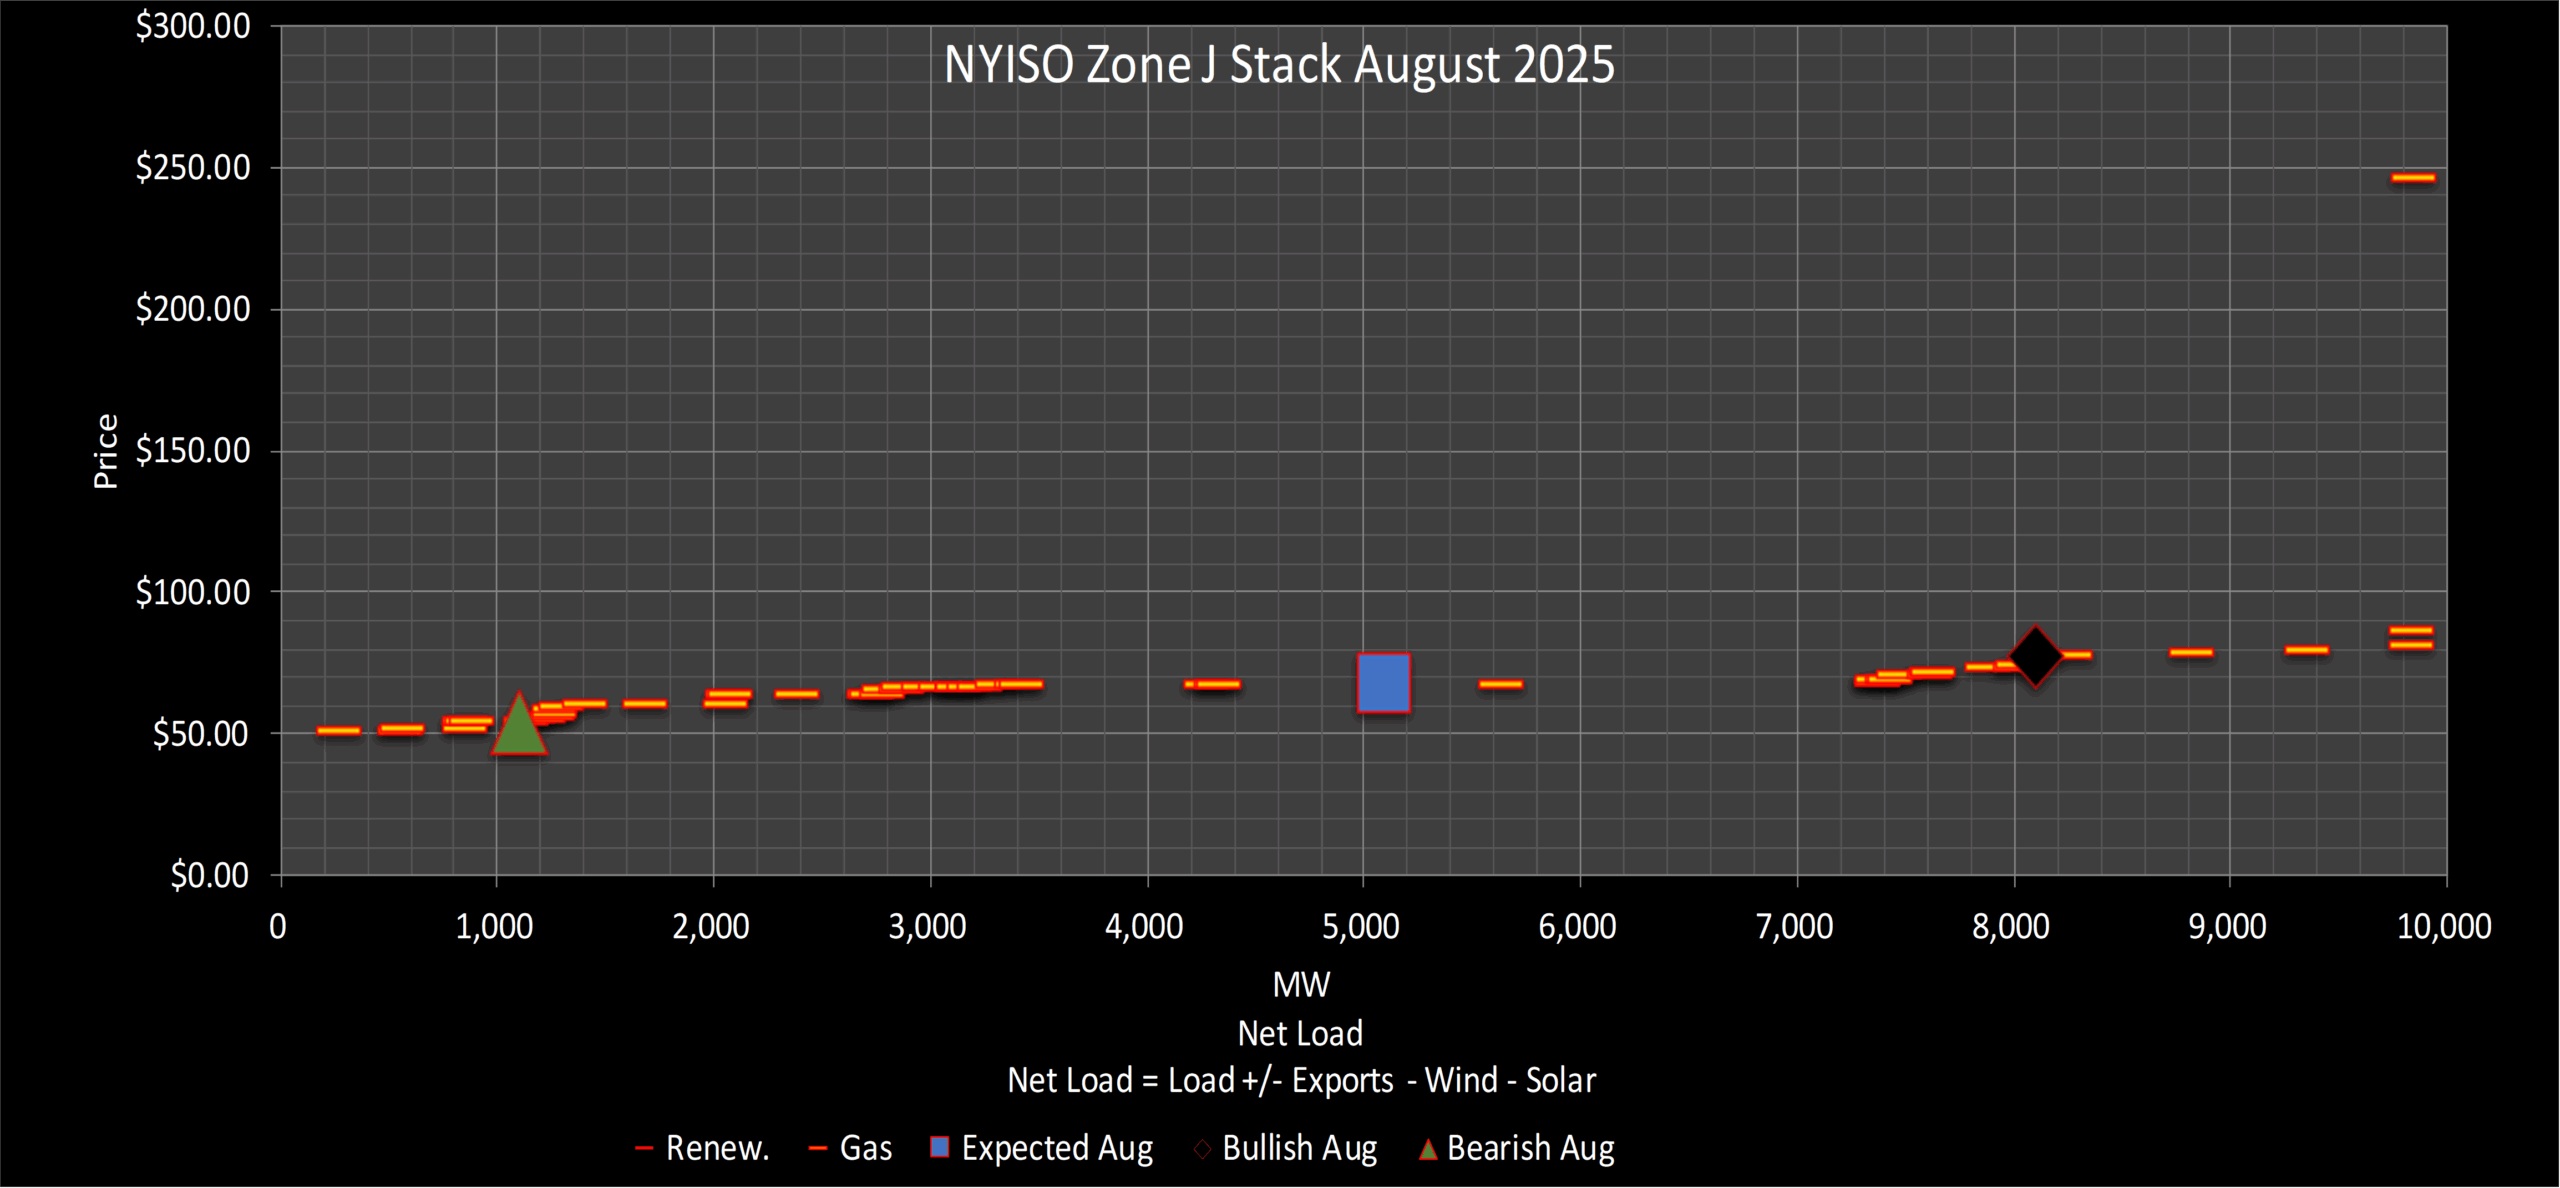
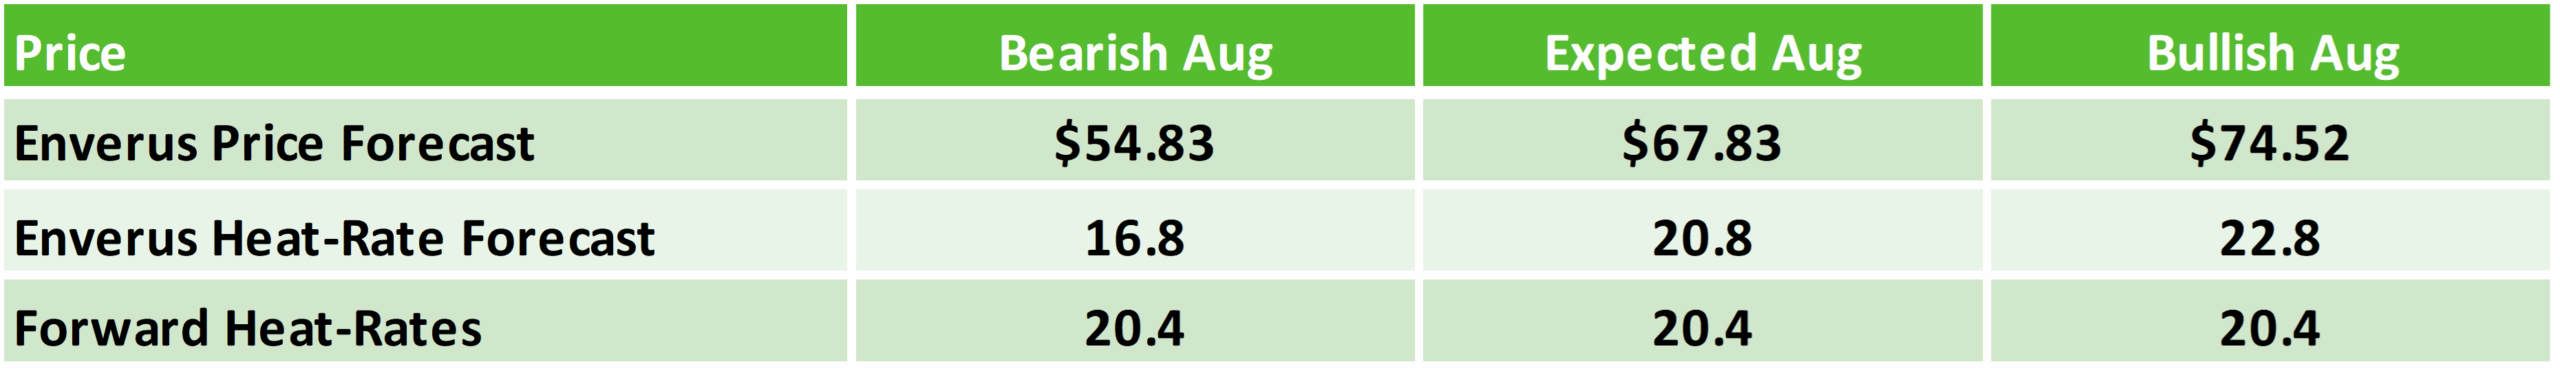
August will see below average demand in NYISO region driven by below seasonal temperatures. High demand in NYC can increase local congestion, which can have a bullish impact on the zone J prices.
Improving drought conditions in the ISO region are expected to lessen the impact of prolonged heat waves, potentially reducing the risk of elevated power prices and volatility in July. Lower BTM solar production in August can also increase the risk of power price volatility.
NYISO Stack August 2025 presented by Enverus Power and Renewables Power Market Publications. The seasoned analysts provide fresh perspectives on the power markets, offering insights and strategies that may not have been previously considered, elevating your team’s market analysis.
ISO New England (ISO-NE)
Load & Generation
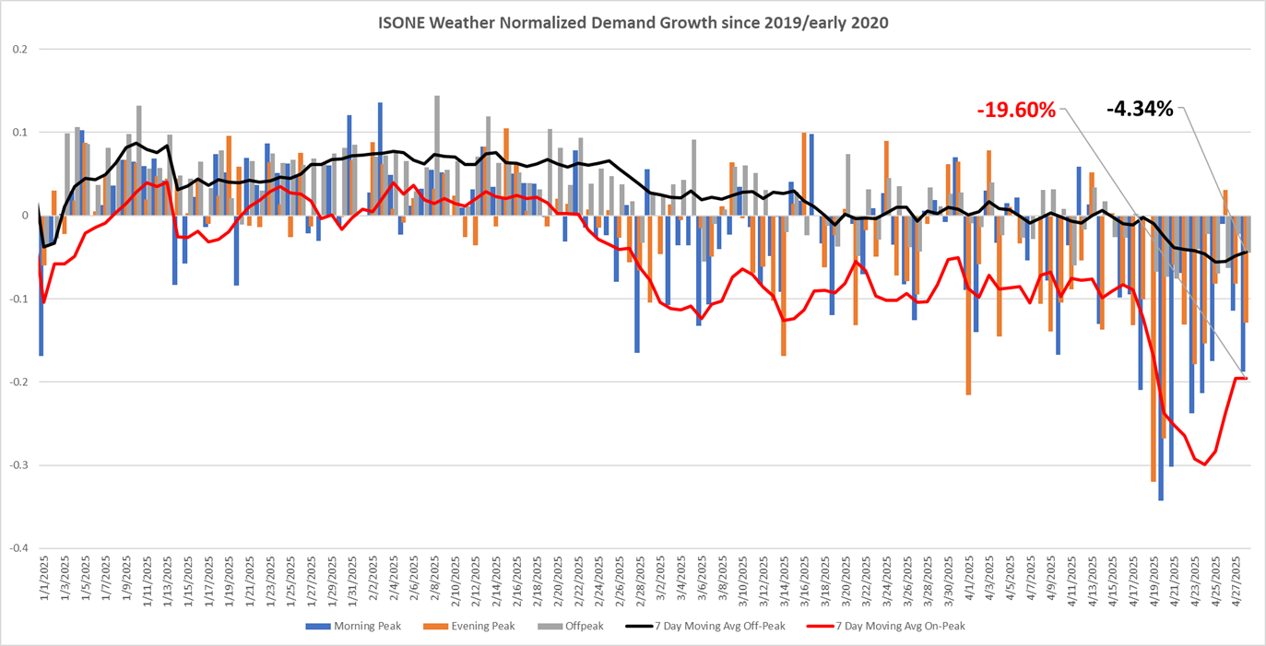
Vineyard Wind’s first 24 turbines (800MW) online; Cranberry Pt (150MW BESS) and Crosstown (175MW BESS) COD in 2025; on-peak load growth ~2–3%. The summer in ISO-NE is expected to be cooler than average with short duration heat waves.
ISO-NE Weather Normalized Demand Growth presented by Enverus Power and Renewables Power Market Publications. Backed by a team of power analysts with decades of hands-on power market experience, Power Market Publications helps users make higher quality decisions.
Outages
Minimal thermal and transmission outages; early offshore wind capacity is entering service.
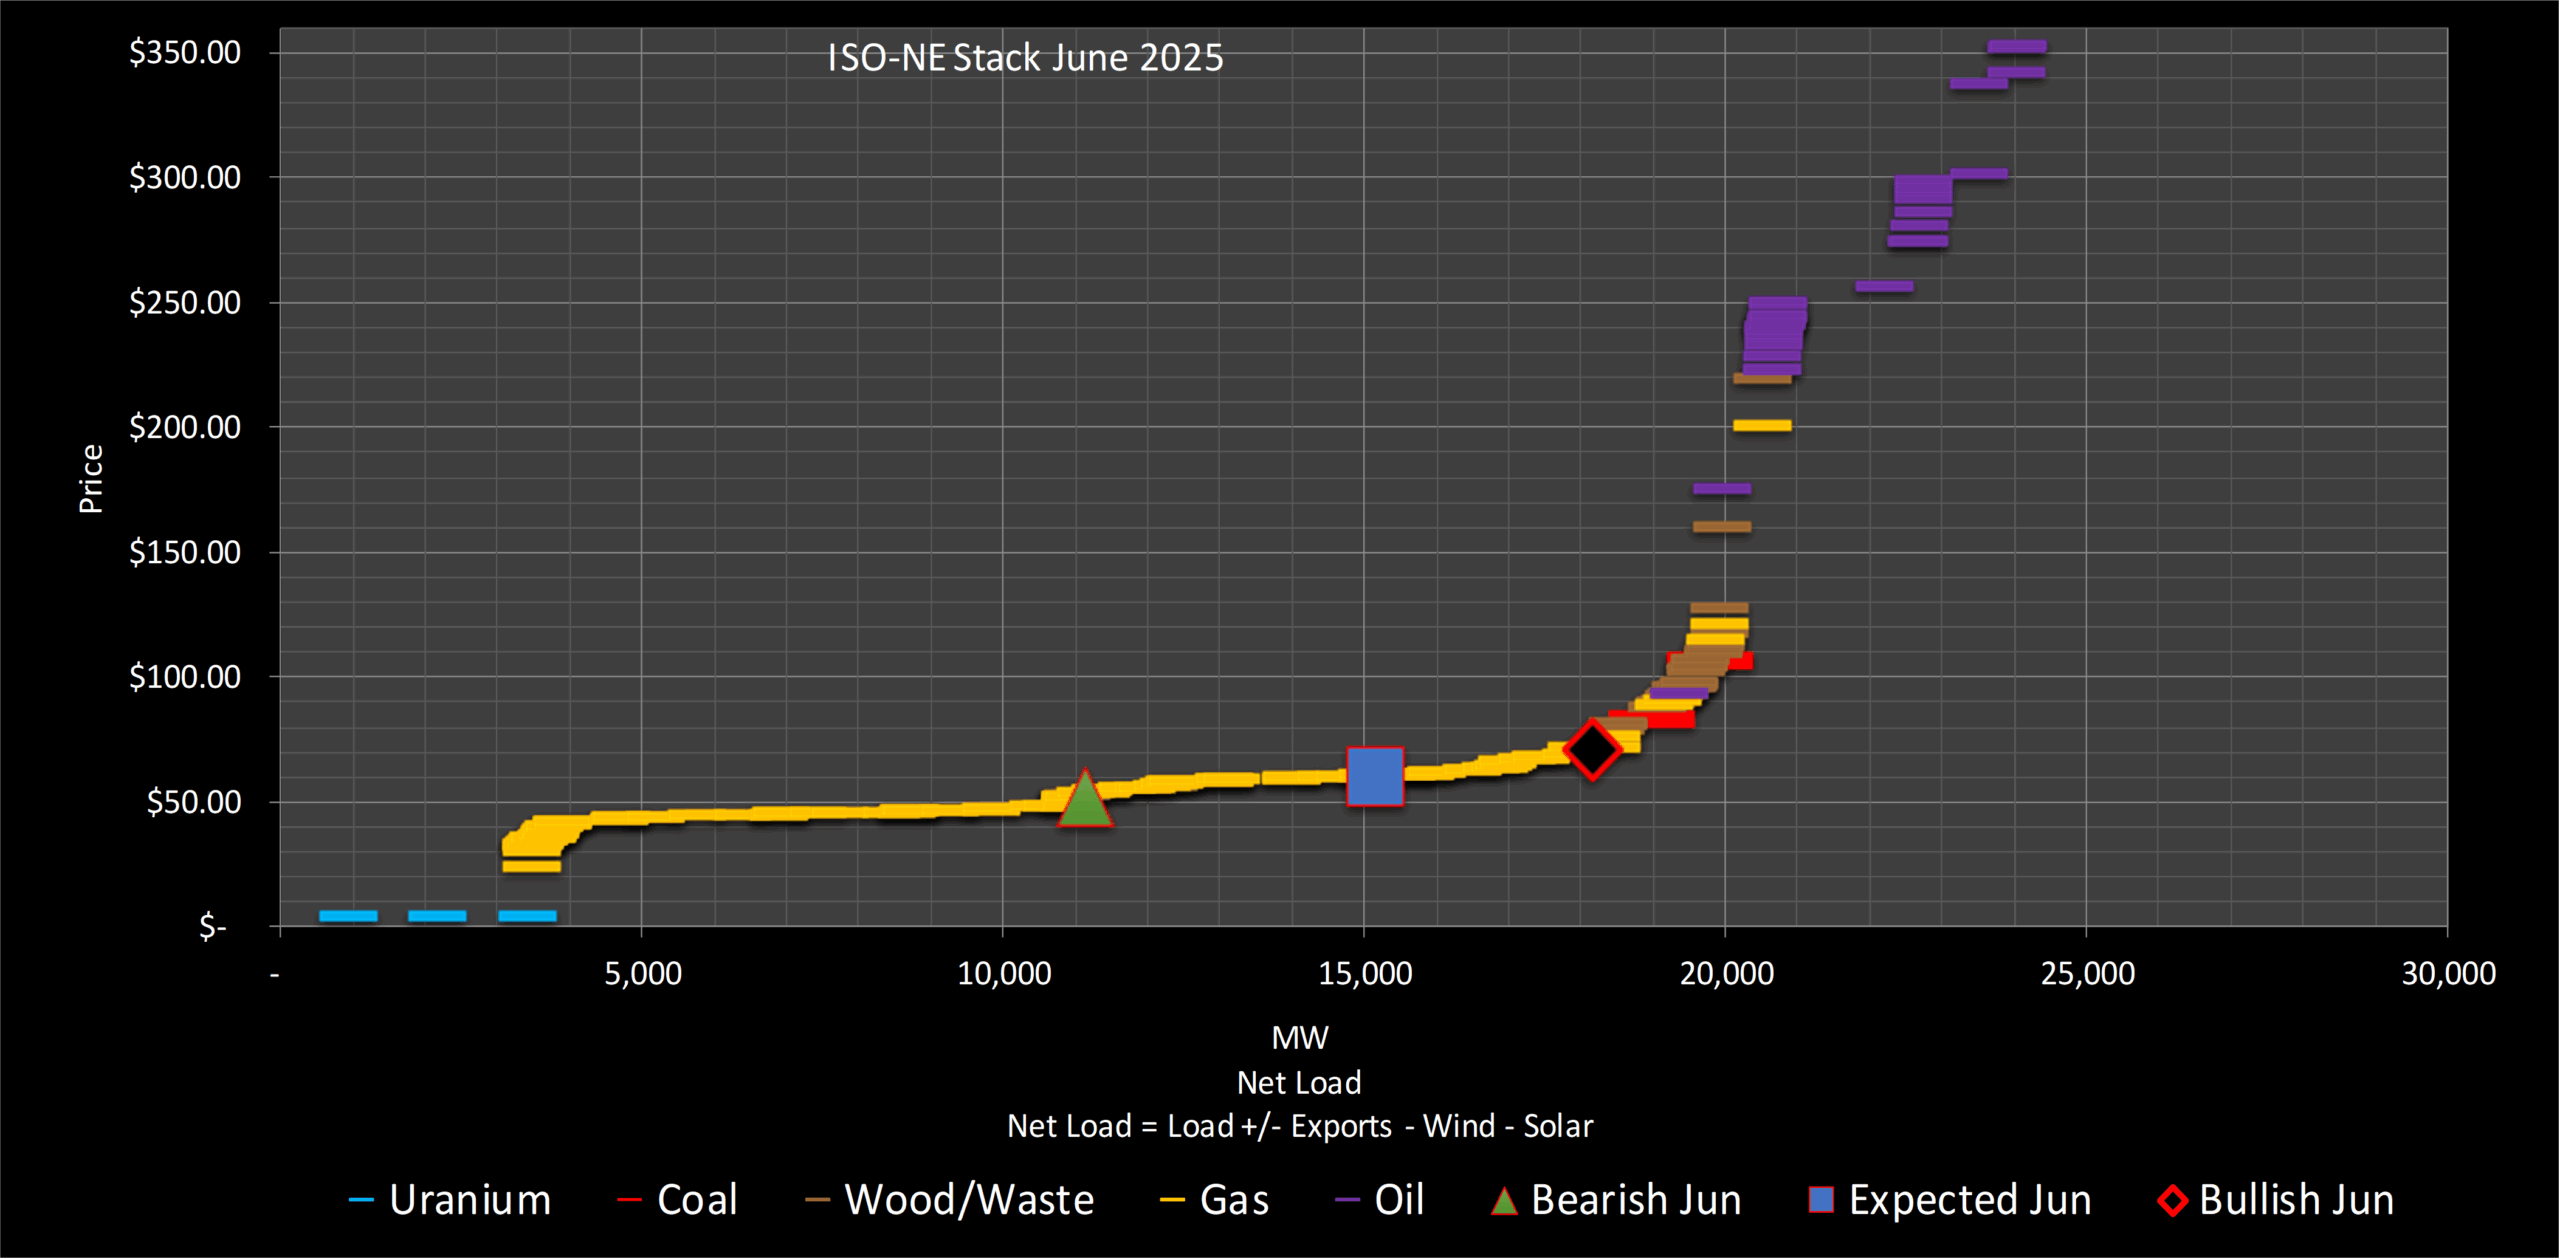
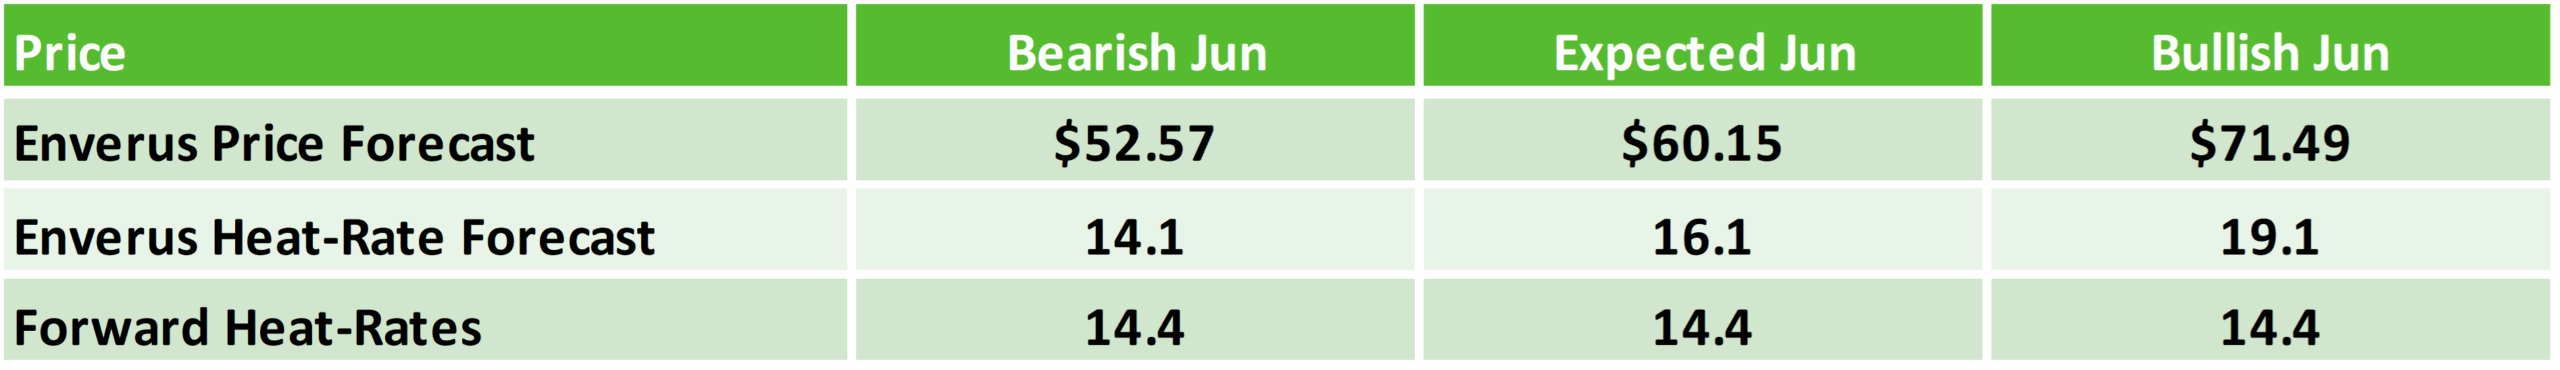
Our load forecast for June is average driven by more seasonal temperatures. Our selected analog years suggest that ENSO neutral-type weather brings unusual weather patterns. Our current base case scenario is above the market. High demand and gas prices will have a bullish impact on power prices. Any heat wave like our analog year 2017 or last year will increase the risk of bullish prices in ISONE.
Drought conditions in the region can increase the risk of a longer heat waves with higher risk of price volatility. Improving drought conditions in the ISO region are expected to lessen the impact of prolonged heat waves, potentially reducing the risk of elevated power prices and volatility in June.
ISO-NE Stack June 2025 presented by Enverus Power and Renewables Power Market Publications. Power Market Publications provides you with insights into price spreads, between trading hubs, informed by transmission congestion and renewable forecasts, helping you find more opportunities and risks faster.
July
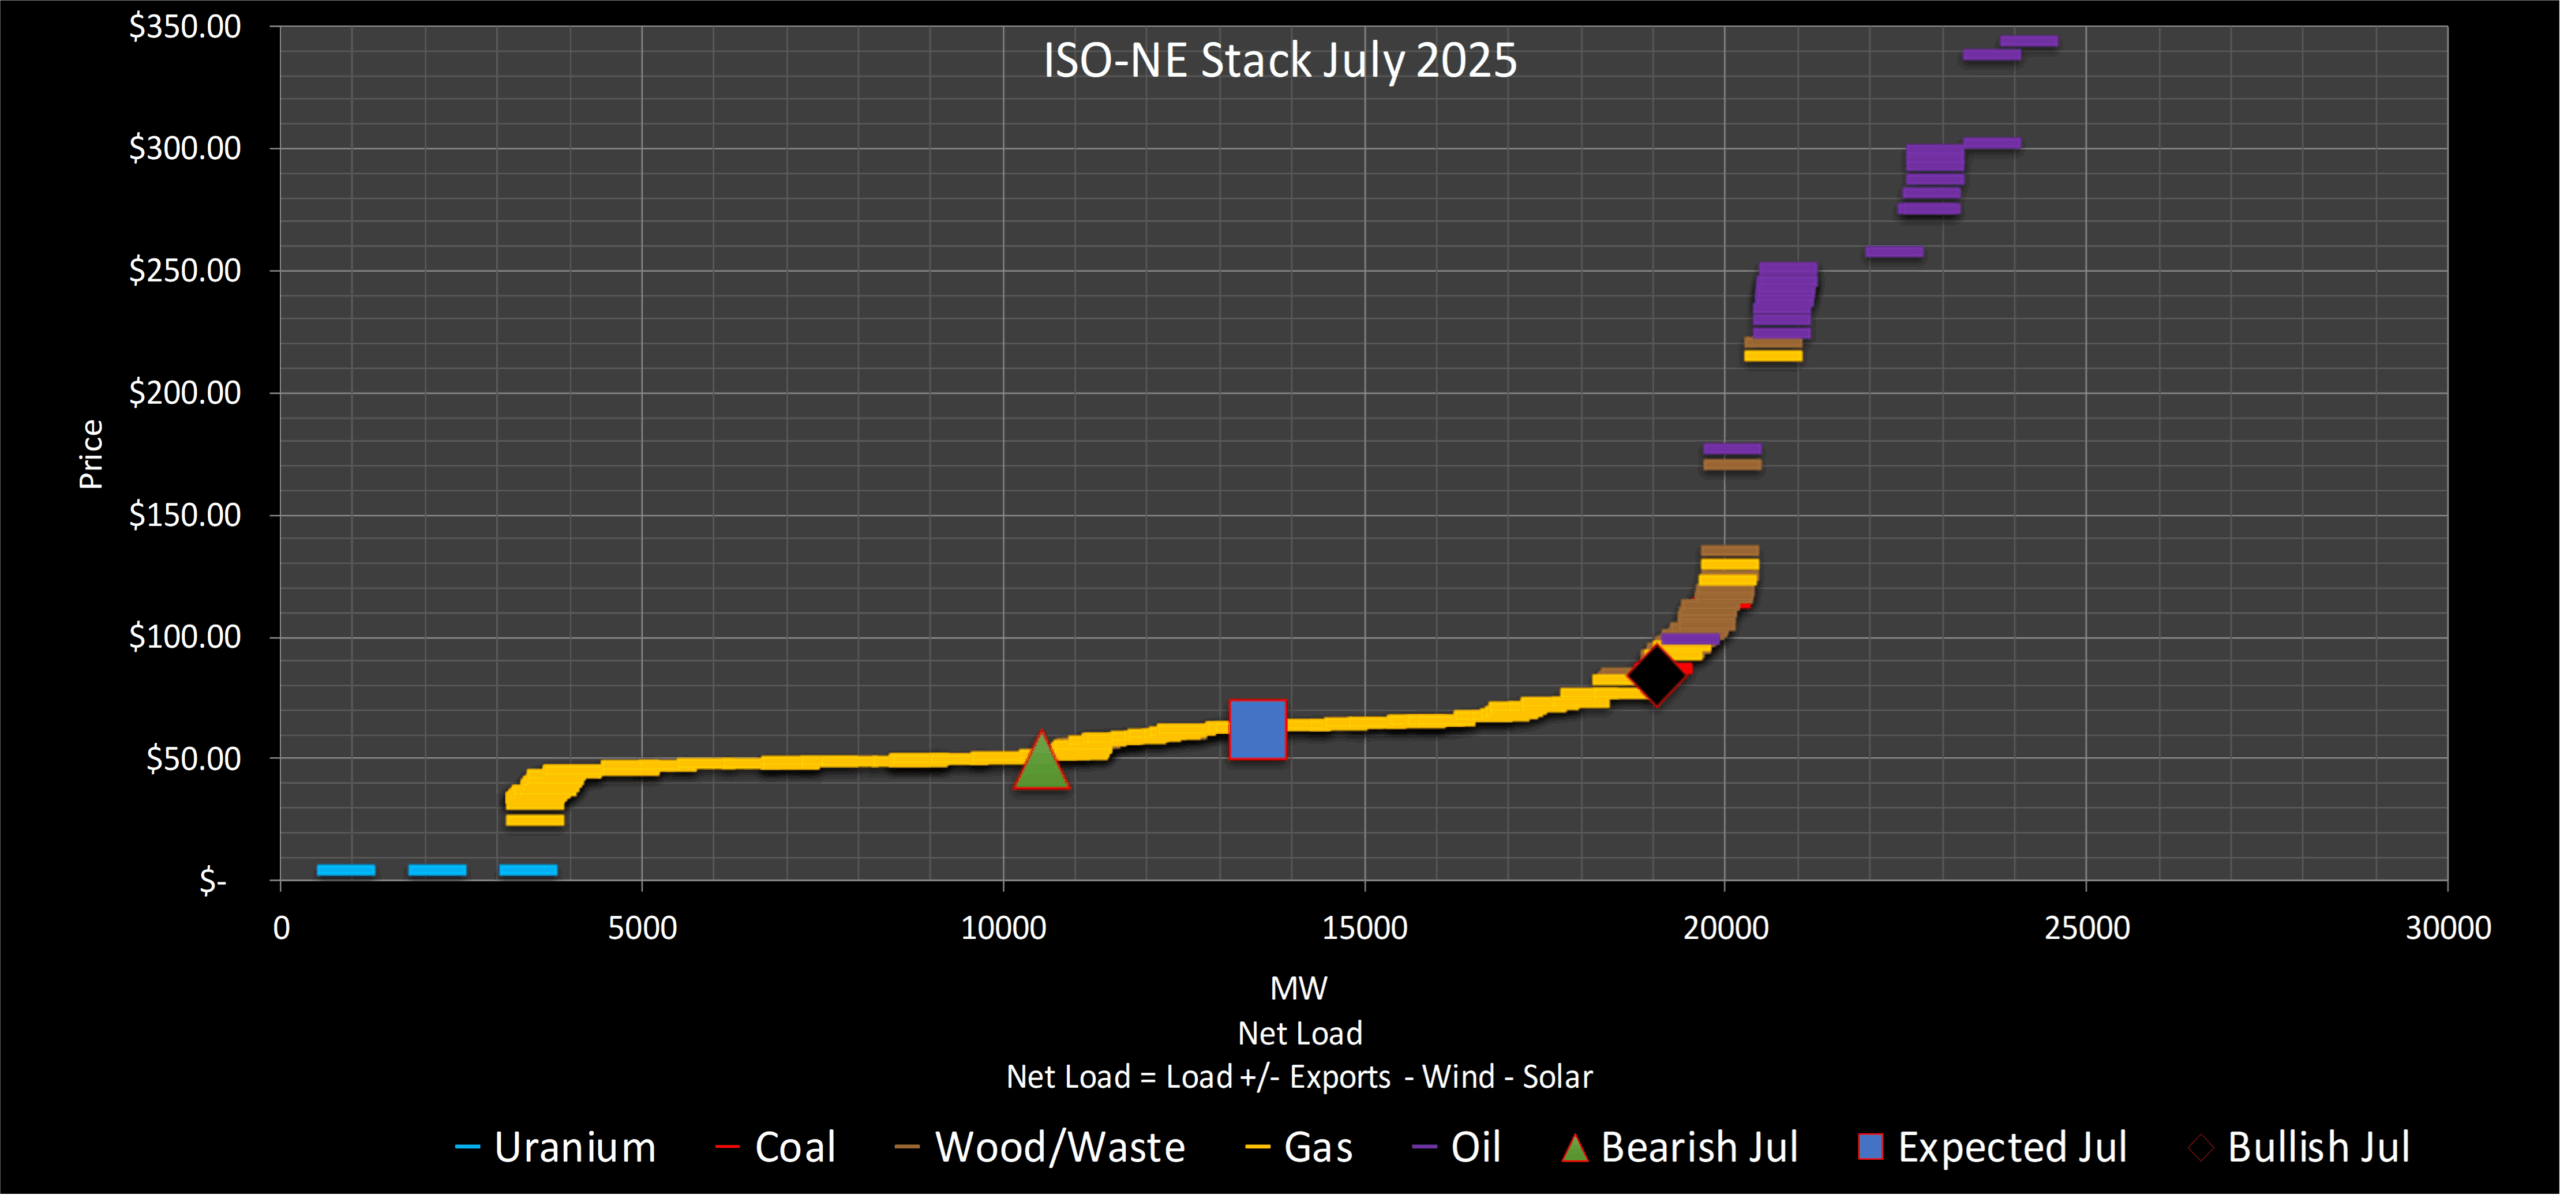
Our load forecast for July is below average driven by below seasonal temperatures. Our selected analog years suggest that ENSO neutral-type weather brings unusual weather patterns. Our current base case scenario is below the market. Any heat wave like our analog year 2017 or last year will increase the risk of bullish prices in ISONE. Our bullish scenario is above the market considering much above average demand due to heat wave and high gas prices.
Drought conditions in the region can increase the risk of longer heat waves with higher risk of price volatility. Improving drought conditions in the ISO region are expected to lessen the impact of prolonged heat waves, potentially reducing the risk of elevated power prices and volatility in July.
Lower hydro imports from Canada due to high tariffs can increase the risk of high power prices in the summer months.
ISO-NE Stack July 2025 presented by Enverus Power and Renewables Power Market Publications. Gain detailed insights from our analysts on key trends in the power markets and use these insights as a foundation to identify trade adjustments.
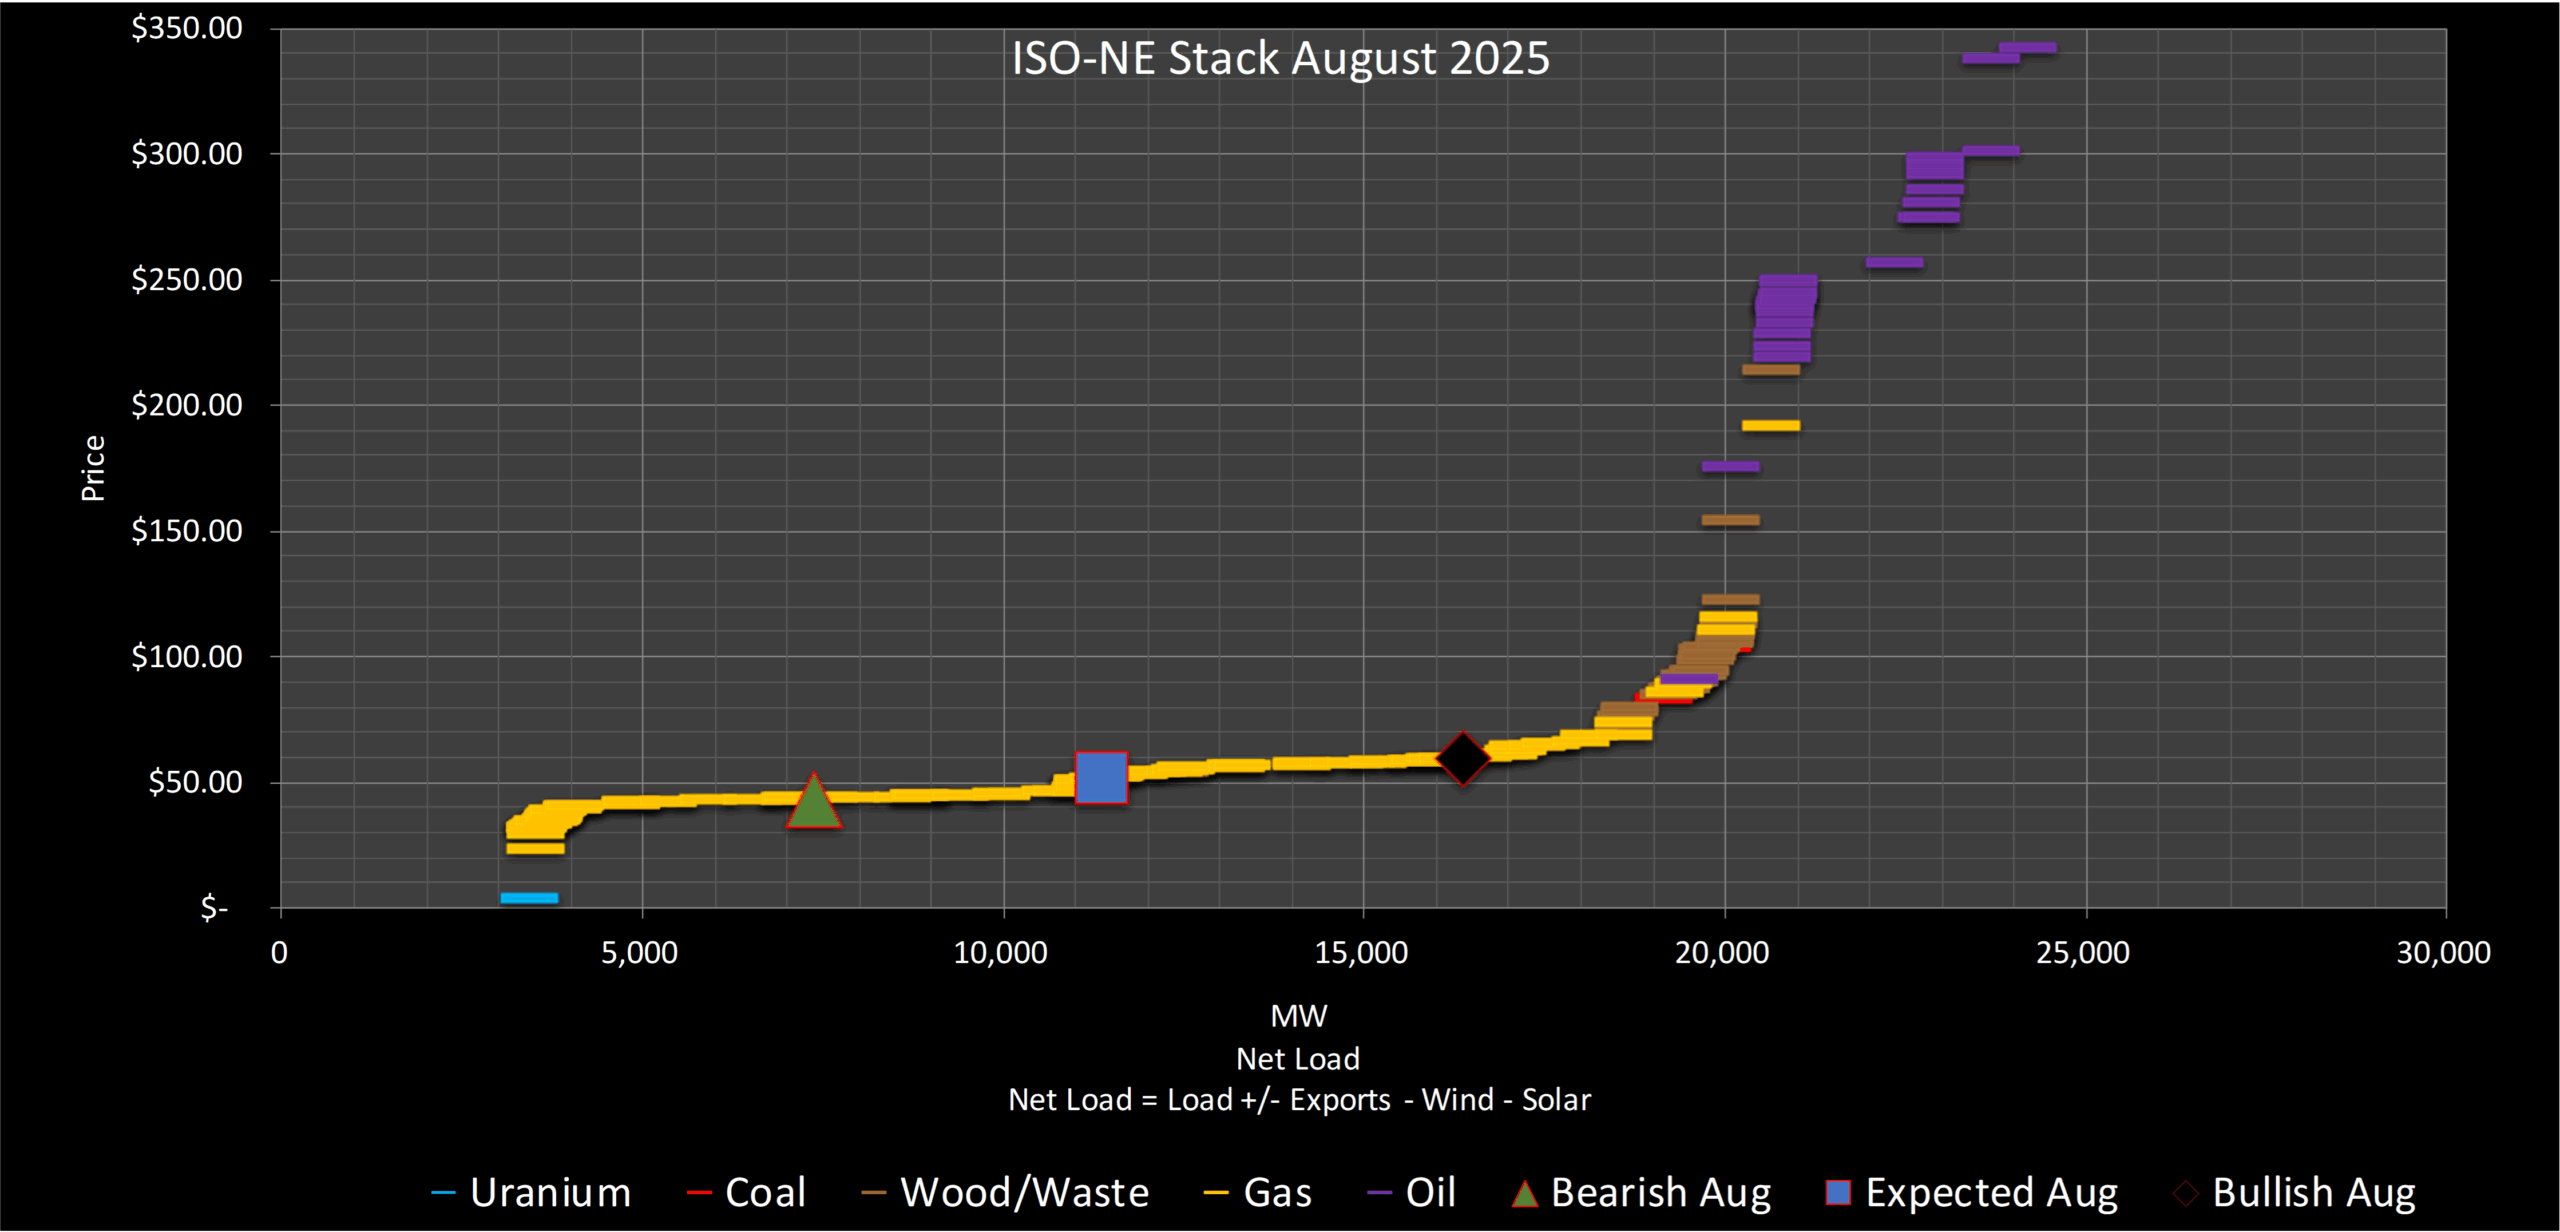
August
Our load forecast for August is below average driven by below seasonal temperatures. Our current base case scenario is below the market. Any heat wave like our analog year 2017 or last year will increase the risk of bullish prices in ISONE.
Drought conditions in the region can increase the risk of longer heat wave with higher risk of price volatility. Improving drought conditions in the ISO region are expected to lessen the impact of prolonged heat waves, potentially reducing the risk of elevated power prices and volatility in August.
Lower BTM solar production in August can also increase the risk of power price volatility.
ISO-NE Stack August 2025 presented by Enverus Power and Renewables Power Market Publications. The seasoned analysts provide fresh perspectives on the power markets, offering insights and strategies that may not have been previously considered, elevating your team’s market analysis.
Conclusion & Takeaways
Key trends include rapid solar and storage growth, localized congestion trade opportunities, policy-driven market shifts, and targeted hedging strategies for heat-wave and scarcity events.
The Summer Power Market Outlook for 2025 underscores several pivotal trends that will define the season’s power market dynamics. Rapid growth in solar and battery storage capacity continues to transform the supply stack, creating both opportunities and challenges for grid reliability and market pricing. Localized congestion, driven by planned outages and regional infrastructure constraints, presents targeted trading opportunities for market participants with the foresight to act. Policy-driven market shifts—such as real-time co-optimization, capacity market reforms and evolving emissions regulations—are reshaping dispatch and pricing dynamics, requiring stakeholders to stay agile and informed. Our heat rate and price forecasts highlight the potential for volatility, particularly during heat waves and scarcity events, emphasizing the need for robust hedging strategies to mitigate risks.
The following five factors will be key drivers of congestion across the ISOs discussed in this e-book:
Planned Transmission Outages: Long-duration outages, such as those on ERCOT’s TWINBU-HARGROVE (138kV) and STP-ANGSTROM (345kV) lines or MISO’s Maple Chrysler 345kV line work, will create persistent congestion patterns, particularly during peak summer demand.
Renewable Integration and Variability: The rapid growth of solar and wind, especially in ERCOT and CAISO, combined with variability in behind-the-meter solar output and low-wind conditions in SPP, will strain transmission systems and exacerbate congestion during ramping periods.
Retirements and Delayed New Builds: Retirements like MISO’s J.H. Campbell 1 GW coal unit and delays in projects like MISO’s Magnolia 700 MW will heighten congestion, particularly on west-to-east flows, as supply tightens in key regions.
Regional Load Growth: Significant load growth, such as ERCOT’s 5–6% on-peak increase and NYISO’s high demand in NYC, will stress transmission infrastructure, leading to localized congestion in urban hubs and constrained corridors.
Policy-Driven Dispatch Changes: Policies like ERCOT’s real-time co-optimization with batteries and NYISO’s DER integration incentives will alter dispatch patterns, potentially increasing congestion in areas with high renewable penetration or constrained import capacity.
As weather patterns, load growth and renewable integration converge, proactive planning and data-driven strategies will be essential for navigating the summer of 2025 successfully. This e-book equips you with the insights needed to anticipate challenges, capitalize on emerging trends and drive strategic decision-making in a rapidly changing power market landscape.
With Enverus Instant Analyst™, you receive answers you can trust, delivered in seconds. Sourcing from 25+ years of vetted data and research on the most trusted SaaS platform designed exclusively for energy.
Arm yourself with the knowledge to inform strategic decisions and grow your business with one source for insights across oil and gas, renewables, carbon capture and ESG.
SUGAR™ helps grid operators and utilities manage increasing interconnection queue volumes by accelerating modeling and simulation studies, with up to 2x reduction in time-consuming study processes.
Tune out the noise, get unbiased evaluations and uncover hidden opportunities with advice you can trust from experienced energy and power intelligence advisors.
Interconnect offers developers certainty throughout the interconnection lifecycle, providing scenario analysis and risk assessment capabilities to improve the chances of deploying new projects.