Identify grid ready, commercially viable hybrid development locations faster
Solar and storage development is increasingly constrained by interconnection congestion, land scarcity, and capital discipline, making early, high confidence siting decisions critical. This case study demonstrates how Enverus PRISM®, RatedPower, and Pearl Street Interconnect enable developers to rapidly identify and prioritize high quality hybrid opportunities by unifying interconnection economics, land viability, pricing fundamentals, and competitive dynamics into a single, analytics driven workflow.
Using Indiana as a representative market, this analysis highlights how developers can move faster and with greater certainty by focusing capital on sites with manageable upgrade costs, scalable land positions, and durable hybrid economics. The workflow surfaces locations that support near term generation feasibility, long term storage value, and phased hybrid development while reducing development risk and avoiding oversubscribed interconnection points.

This case study illustrates how Enverus solutions help developers identify and differentiate solar and storage siting opportunities in Indiana by integrating interconnection cost signals, land buildability, pricing dynamics, and competitive pressure into a single decision framework.
Across three evaluated locations, the analysis reveals material differences in site quality driven by:
Among the sites evaluated, Miami County emerges with the best possible site. It offers the lowest upgrade costs, best land buildability, and minimal queue competition. Pike and Vermillion counties present viable but more specialized opportunities, each requiring more targeted hybrid or storage forward development strategies to interconnection and land constraints.
Sites were evaluated using Enverus PRISM®, Interconnect, and RatedPower across the following criteria:
By replacing fragmented datasets and manual screening with a unified analytics workflow, Enverus enables developers to reduce siting risk, prioritize capital efficiently, and advance projects with greater confidence earlier in the development lifecycle.
Developers pursuing utility scale solar + storage projects in Indiana face a familiar challenge: identifying locations that simultaneously offer manageable interconnection economics, sufficient buildable land, and durable long term value. With most attractive substations already constrained, success increasingly depends on understanding where upgrades are economically viable and how hybrid configurations can unlock value despite limited injection availability.
The goal of this analysis is to identify high quality hybrid development zones where interconnection upgrades are justified by land scale, pricing fundamentals, and storage driven value stacking.
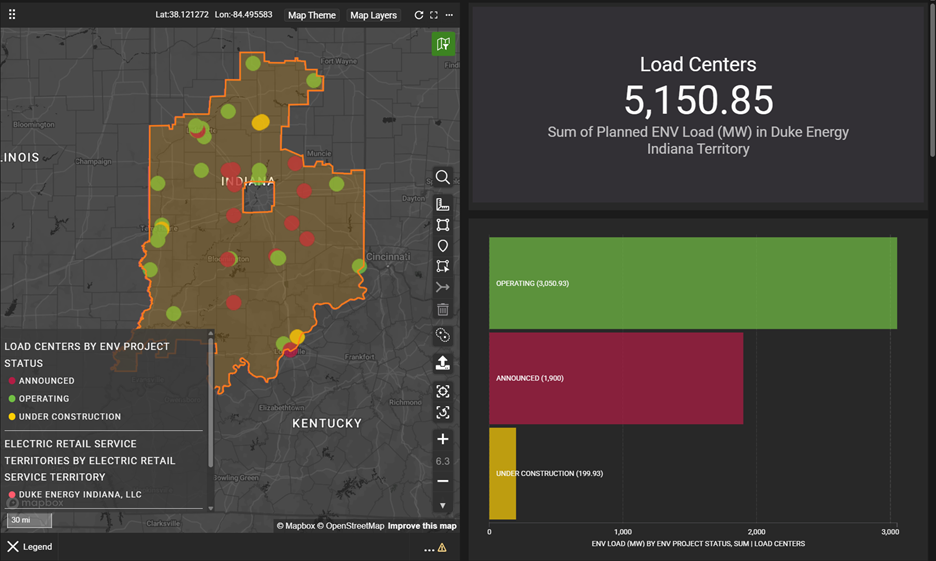
Indiana is a high value region for solar + storage development. Utilities across the state have outlined aggressive renewable and storage additions in recent Integrated Resource Plans, signaling sustained procurement needs. At the same time, the state is preparing for significant load growth from data centers, manufacturing expansions, and other power intensive industries. For example, Duke Energy Indiana has over 5,000 MWs of planned load capacity.
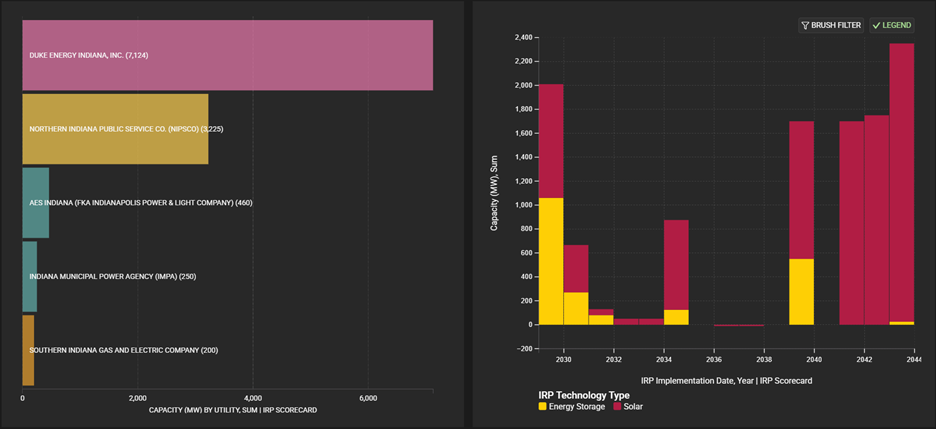
This convergence of renewable expansion, storage integration, and accelerating demand positions Indiana as an attractive market for developers who can move quickly and secure economically viable interconnection points. PRISM, RatedPower, and Interconnect compress months of manual screening into minutes, enabling that speed.
Attribute | Value |
|---|---|
County | Pike |
ISO | MISO |
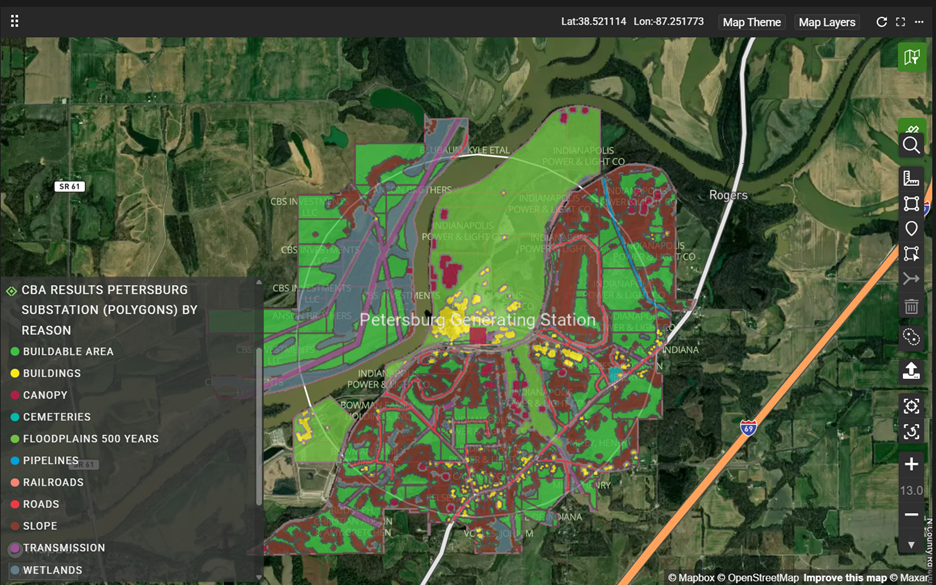
Nearest Substation | Petersburg Generating Station |
Bus Voltage (kV) | 345 kV |
$/MW to Upgrade Site for 500MW Facility | $638,721 |
$/MW for Pre-Overloaded Network Upgrades | $408,309 |
$/MW for Newly-Overloaded Network Upgrades | $230,412 |
Number of Constraints for 500MW Facility* | 6 |
Planned Capacity at Substation (MW) | 100 MW |
Adjacent Acreage (1-mile radius) | 1,890 acres |
Buildable Acreage | 717 acres |
LMP Node (Nearest to Site) | HE.RATTS.ARR-MISO-LMP |
Avg. LMP, 5-Year Historical | $42.91/MWh |
Avg. Solar-Weighted LMP, 5-Year Historical | $47.41/MWh |
Avg. Top/Bottom 4-Hour Spread, 5-Year Historical | $30.48/MWh |
Avg. LMP, 20-Year Forecast | $43.13/MWh |
Avg. Solar-Weighted LMP, 20-Year Forecast | $38.53/MWh |
Avg. Top/Bottom 4-Hour Spread, 20-Year Forecast | $31.32/MWh |
Avg. PV RatedPower MWac per Parcel (MW) | 8.10 MW |
Avg. PV RatedPower MWac, Sum All Parcels (MW) | 121.8 MW |
$/MW to Upgrade Site for 122MW Facility | $2,617,709 |
Petersburg is Indiana’s most de-risked development environment for utility-scale solar. The substation anchors a proven 345 kV node where three large projects are already operational, establishing clear precedent for permitting, landowner engagement, and construction execution. Pike County carries no county-level zoning ordinance, eliminating the regulatory friction that has derailed projects across 72 of Indiana’s 92 counties. Local officials have publicly welcomed renewable investment, and no organized opposition exists.
The principal constraint is economics: at $638,721/MW across 6 binding constraints, Petersburg carries the highest network upgrade cost in the evaluated set. A 500 MW facility would require approximately $319M in network upgrades, a significant capital burden that must be weighed against the site’s regulatory and execution advantages. The buildable footprint at 717 acres is also the smallest evaluated and will require multi-landowner assembly for a project of scale. A project fitting on this land, roughly 122MWac, would increase network upgrade cost exposure to $2,617,709. CCR contamination from the legacy coal plant imposes buffer requirements on adjacent parcel development.
Attribute | Value |
|---|---|
County | Miami |
ISO | MISO |
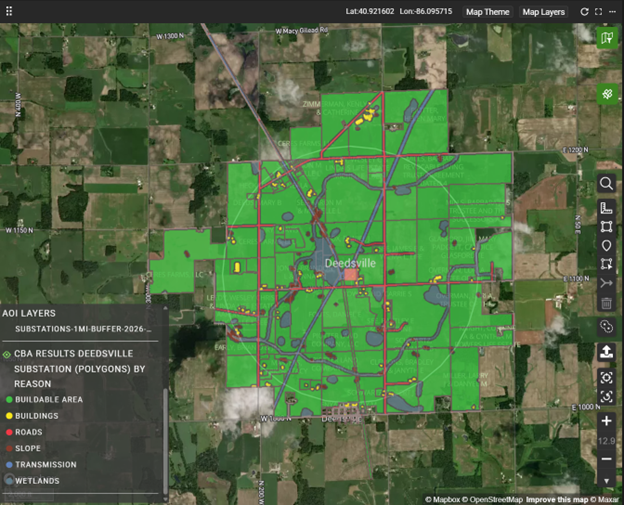
Nearest Substation | Deedsville |
Bus Voltage (kV) | 345 kV |
$/MW to Upgrade Site for 500MW Facility | $188,100 |
$/MW for Pre-Overloaded Network Upgrades | $86,040 |
$/MW for Newly-Overloaded Network Upgrades | $102,060 |
Number of Constraints for 500MW Facility* | 6 |
Planned Capacity at Substation (MW) | 369 MW |
Adjacent Acreage (1-mile radius) | 1,999 acres |
Buildable Acreage | 1,747 acres |
LMP Node (Nearest to Site) | CIN.LOGANOAKR-MISO-LMP |
Avg. LMP, 5-Year Historical | $44.69/MWh |
Avg. Solar-Weighted LMP, 5-Year Historical | $49.37/MWh |
Avg. Top/Bottom 4-Hour Spread, 5-Year Historical | $33.88/MWh |
Avg. LMP, 20-Year Forecast | $43.03/MWh |
Avg. Solar-Weighted LMP, 20-Year Forecast | $37.02/MWh |
Avg. Top/Bottom 4-Hour Spread, 20-Year Forecast | $35.17/MWh |
Avg. PV RatedPower MWac per Parcel (MW) | 15.30 MW |
Avg. PV RatedPower MWac, Sum All Parcels (MW) | 291.0 MW |
$/MW to Upgrade Site for 122MW Facility | $147,835 |
Deedsville presents the strongest combination of economics and land quality in the evaluated set. Network upgrade costs are the lowest at $188,100/MW across 6 constraints — a $450,000/MW advantage over Pike that translates to roughly $225M in savings at 500 MW scale. The surrounding Tipton Till Plain delivers a land position that is exceptional by any measure: 1,747 buildable acres at 89% buildability, with flat agricultural terrain, no karst geology, and minimal wetland exposure. Individual parcel sizes average 15.3 MWac, aggregating to ~291 MWac of modeled solar capacity across the buildable footprint. The reduction in project size to ~291MWac benefits the project by removing 2 of the constraints that appear at 500MW, reducing the network upgrade risk to $147,835/MW. The LMP environment is the strongest of the three sites at $44.69/MWh historically and $49.37/MWh solar-weighted, supported by a 20-year forward case that holds above $43/MWh. Miami County’s 2021 solar ordinance provides one of Indiana’s few unambiguous permitting pathways. The primary risk is queue competition: 369 MW of planned capacity at Deedsville demands early queue positioning and rigorous delivery study management.
Attribute | Value |
|---|---|
County | Vermillion |
ISO | MISO |
Nearest Substation | Cayuga City |
Bus Voltage (kV) | 345 kV |
$/MW to Upgrade Site for 500MW Facility | $523,874 |
$/MW for Pre-Overloaded Network Upgrades | $475,204 |
$/MW for Newly-Overloaded Network Upgrades | $48,670 |
Number of Constraints for 500MW Facility* | 8 |
Planned Capacity at Substation (MW) | 0 MW |
Adjacent Acreage (1-mile radius) | 1,728 acres |
Buildable Acreage | 620 acres |
LMP Node (Nearest to Site) | CIN.CT.VERMN.8-MISO-LMP |
Avg. LMP, 5-Year Historical | $41.27/MWh |
Avg. Solar-Weighted LMP, 5-Year Historical | $45.25/MWh |
Avg. Top/Bottom 4-Hour Spread, 5-Year Historical | $29.26/MWh |
Avg. LMP, 20-Year Forecast | $41.24/MWh |
Avg. Solar-Weighted LMP, 20-Year Forecast | $35.21/MWh |
Avg. Top/Bottom 4-Hour Spread, 20-Year Forecast | $34.61/MWh |
Avg. PV RatedPower MWac per Parcel (MW) | 5.90 MW |
Avg. PV RatedPower MWac, Sum All Parcels (MW) | 94.1 MW |
$/MW to Upgrade Site for 122MW Facility | $2,786,568 |
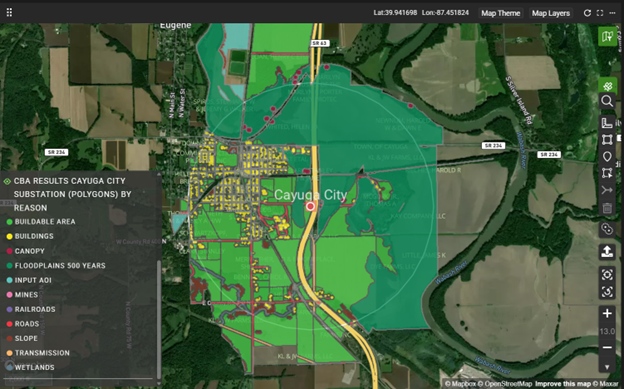
Cayuga City is purpose-built for storage forward or hybrid development. The substation carries a clean interconnection queue — zero planned competing generation, and the strongest intraday price spreads in the evaluated set: $29.26/MWh historically, rising to $34.61/MWh in the 20-year forward case. These spread dynamics directly support battery storage arbitrage economics and make Vermillion the natural home for developers optimizing around dispatch value rather than energy generation alone.
The site’s limitations are structural. At $523,874/MW across 8 binding constraints, the highest constraint count evaluated, network upgrade costs are meaningful, and complexity is elevated. The buildable land footprint at 620 acres supports only compact or storage-dominant configurations, not large-scale solar-only development, increasing the network upgrade risk to $2,786,568/MW. Regulatory risk is real: a solar moratorium was narrowly defeated in October 2025. Projects here require storage-heavy financing and close monitoring of the permitting environment.
Metric | Pike | Miami | Vermillion |
|---|---|---|---|
$/MW Upgrade (500 MW) | $638,721 | $188,100 | $523,874 |
# Constraints | 6 | 6 | 8 |
Planned Competing (MW) | 100 MW | 369 MW | 0 MW |
Metric | Pike | Miami | Vermillion |
|---|---|---|---|
Adjacent Acreage (1-mi) | 1,890 ac | 1,999 ac | 1,728 ac |
Buildable Acreage | 717 ac | 1,747 ac | 620 ac |
% Buildable | 37.9% | 87.4% | 35.9% |
Est. Total Solar MWac | ~122 MW | ~291 MW | ~94 MW |
Metric | Pike | Miami | Vermillion |
|---|---|---|---|
Avg. LMP, 5yr Historical | $42.91/MWh | $44.69/MWh | $41.27/MWh |
Solar-Wtd LMP, 5yr Historical | $47.41/MWh | $49.37/MWh | $45.25/MWh |
4-Hr Spread, 5yr Historical | $30.48/MWh | $33.88/MWh | $29.26/MWh |
Avg. LMP, 20yr Forecast | $43.13/MWh | $43.03/MWh | $41.24/MWh |
Solar-Wtd LMP, 20yr Forecast | $38.53/MWh | $37.02/MWh | $35.21/MWh |
4-Hr Spread, 20yr Forecast | $31.32/MWh | $35.17/MWh | $34.61/MWh |
Project 2 (P2): Deedsville Substation – Miami County, Indiana
Let’s get started!
Let’s get started!
We’ll follow up right away to show you a quick product tour.
Ready to Subscribe?
Ready to Get Started?
Ready to Subscribe?
Sign Up
Power Your Insights