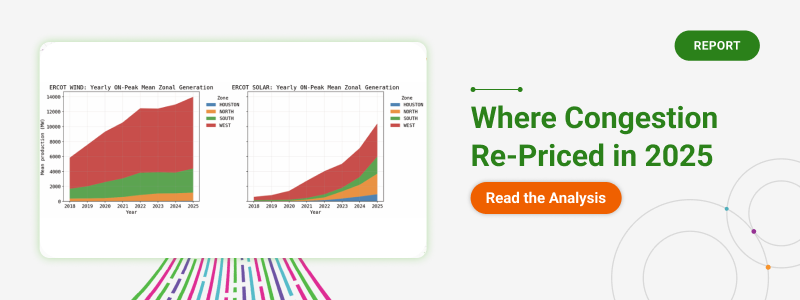
How weather, load, and renewables reshaped congestion across MISO, ERCOT, and PJM
With 2026 underway, it’s worth stepping back to examine how weather, load, and renewable generation evolved across North American power markets in 2025. While individual price events often dominate attention, it’s the underlying structural patterns like how weather risk moved through the calendar, where demand growth emerged, and how new generation altered net-load dynamics that more consistently shape congestion and basis behavior over time.
Across MISO, ERCOT, and PJM, 2025 was defined less by singular extremes and more by distribution. Weather stress rotated across seasons rather than concentrating in a single peak period. Load growth broadened beyond the traditional summer focus, with winter and shoulder months playing a more meaningful role. At the same time, continued renewable expansion, particularly accelerating solar growth, increasingly influenced the shape and location of net load rather than just its magnitude.
Using Enverus Mid-Term Nodal Renewable Forecast (MTNRF) data, this e-book looks back at how these dynamics unfolded across each ISO. Rather than relying on system wide averages, the analysis emphasizes zonal-level detail, where regional weather variability, localized load growth, and geographically specific renewable buildout most directly affect congestion outcomes.
Common themes emerge, but they manifest differently by market. ERCOT’s evolving net-load patterns reflect rapid solar growth and shifting export dynamics. MISO’s broad footprint continues to produce meaningful regional divergence, where renewable additions dampen net load in some areas while amplifying it in others. PJM remains largely demand-driven, though solar growth is beginning to introduce early intraday effects.
Taken together, 2025 reinforces a key takeaway. Structural change is often subtle until it’s not. Understanding how incremental shifts accumulate across seasons, hours, and locations is essential for distinguishing persistent signals from short-term noise. This e-book brings those patterns together, offering a consolidated view of how 2025 reshaped the congestion and risk landscape across MISO, ERCOT, and PJM heading into 2026.
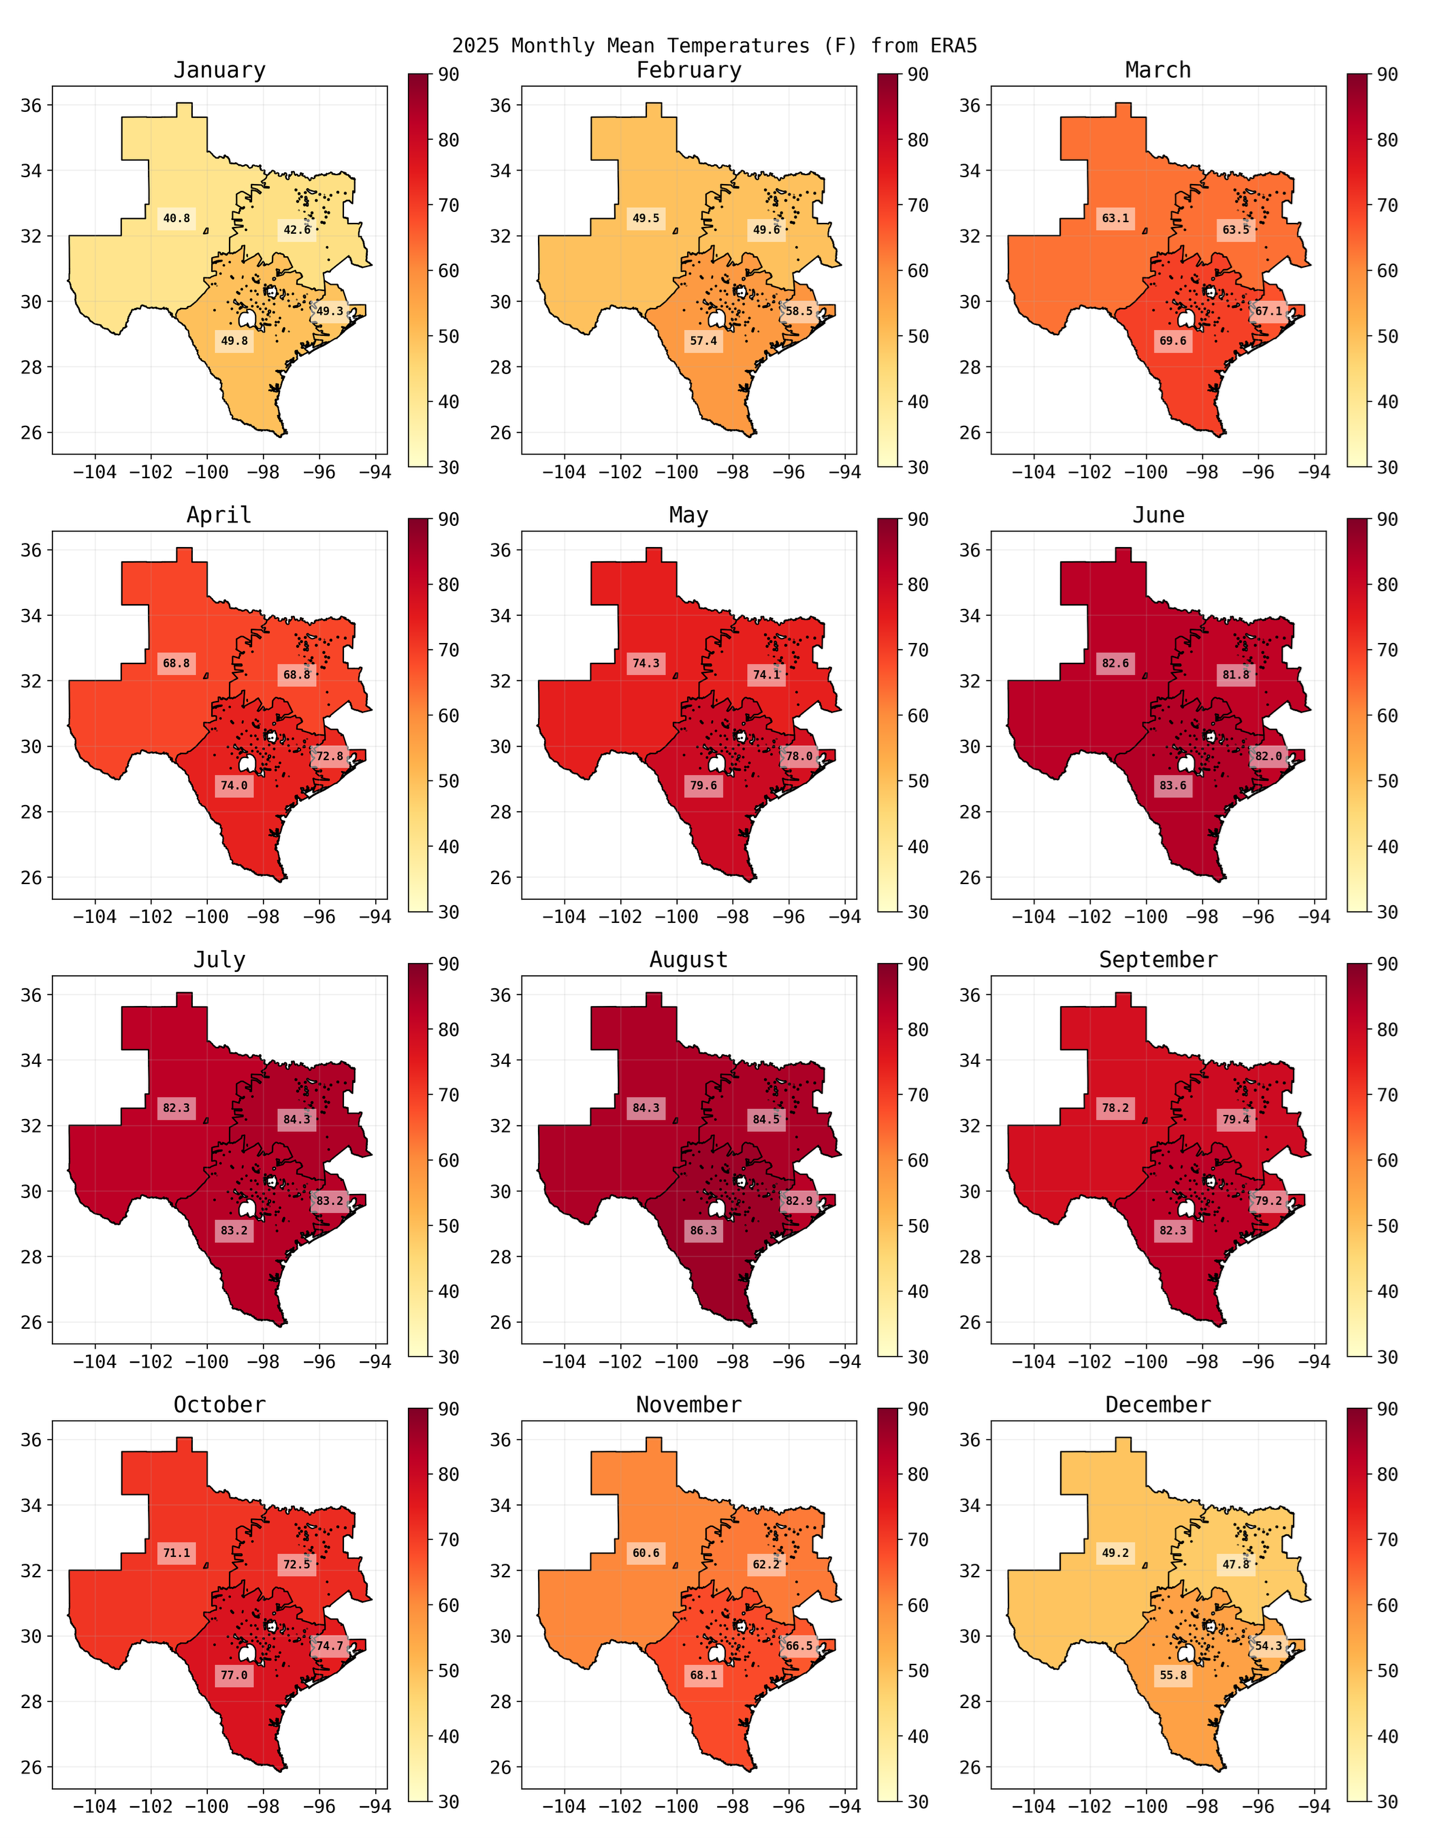
Our 2025 temperature figures highlight how seasonal conditions varied meaningfully by load zone, in ways that system averages would have smoothed over.
Monthly mean zonal temperatures show the familiar Texas summer profile, but also a mild overall winter and persistent warmth extending into the shoulder seasons. Importantly, the zones did not move in lockstep—West, North, Houston, and South each show their own timing and magnitude of temperature shifts, which is often where weather-driven regional differences start to matter for how the system behaves.
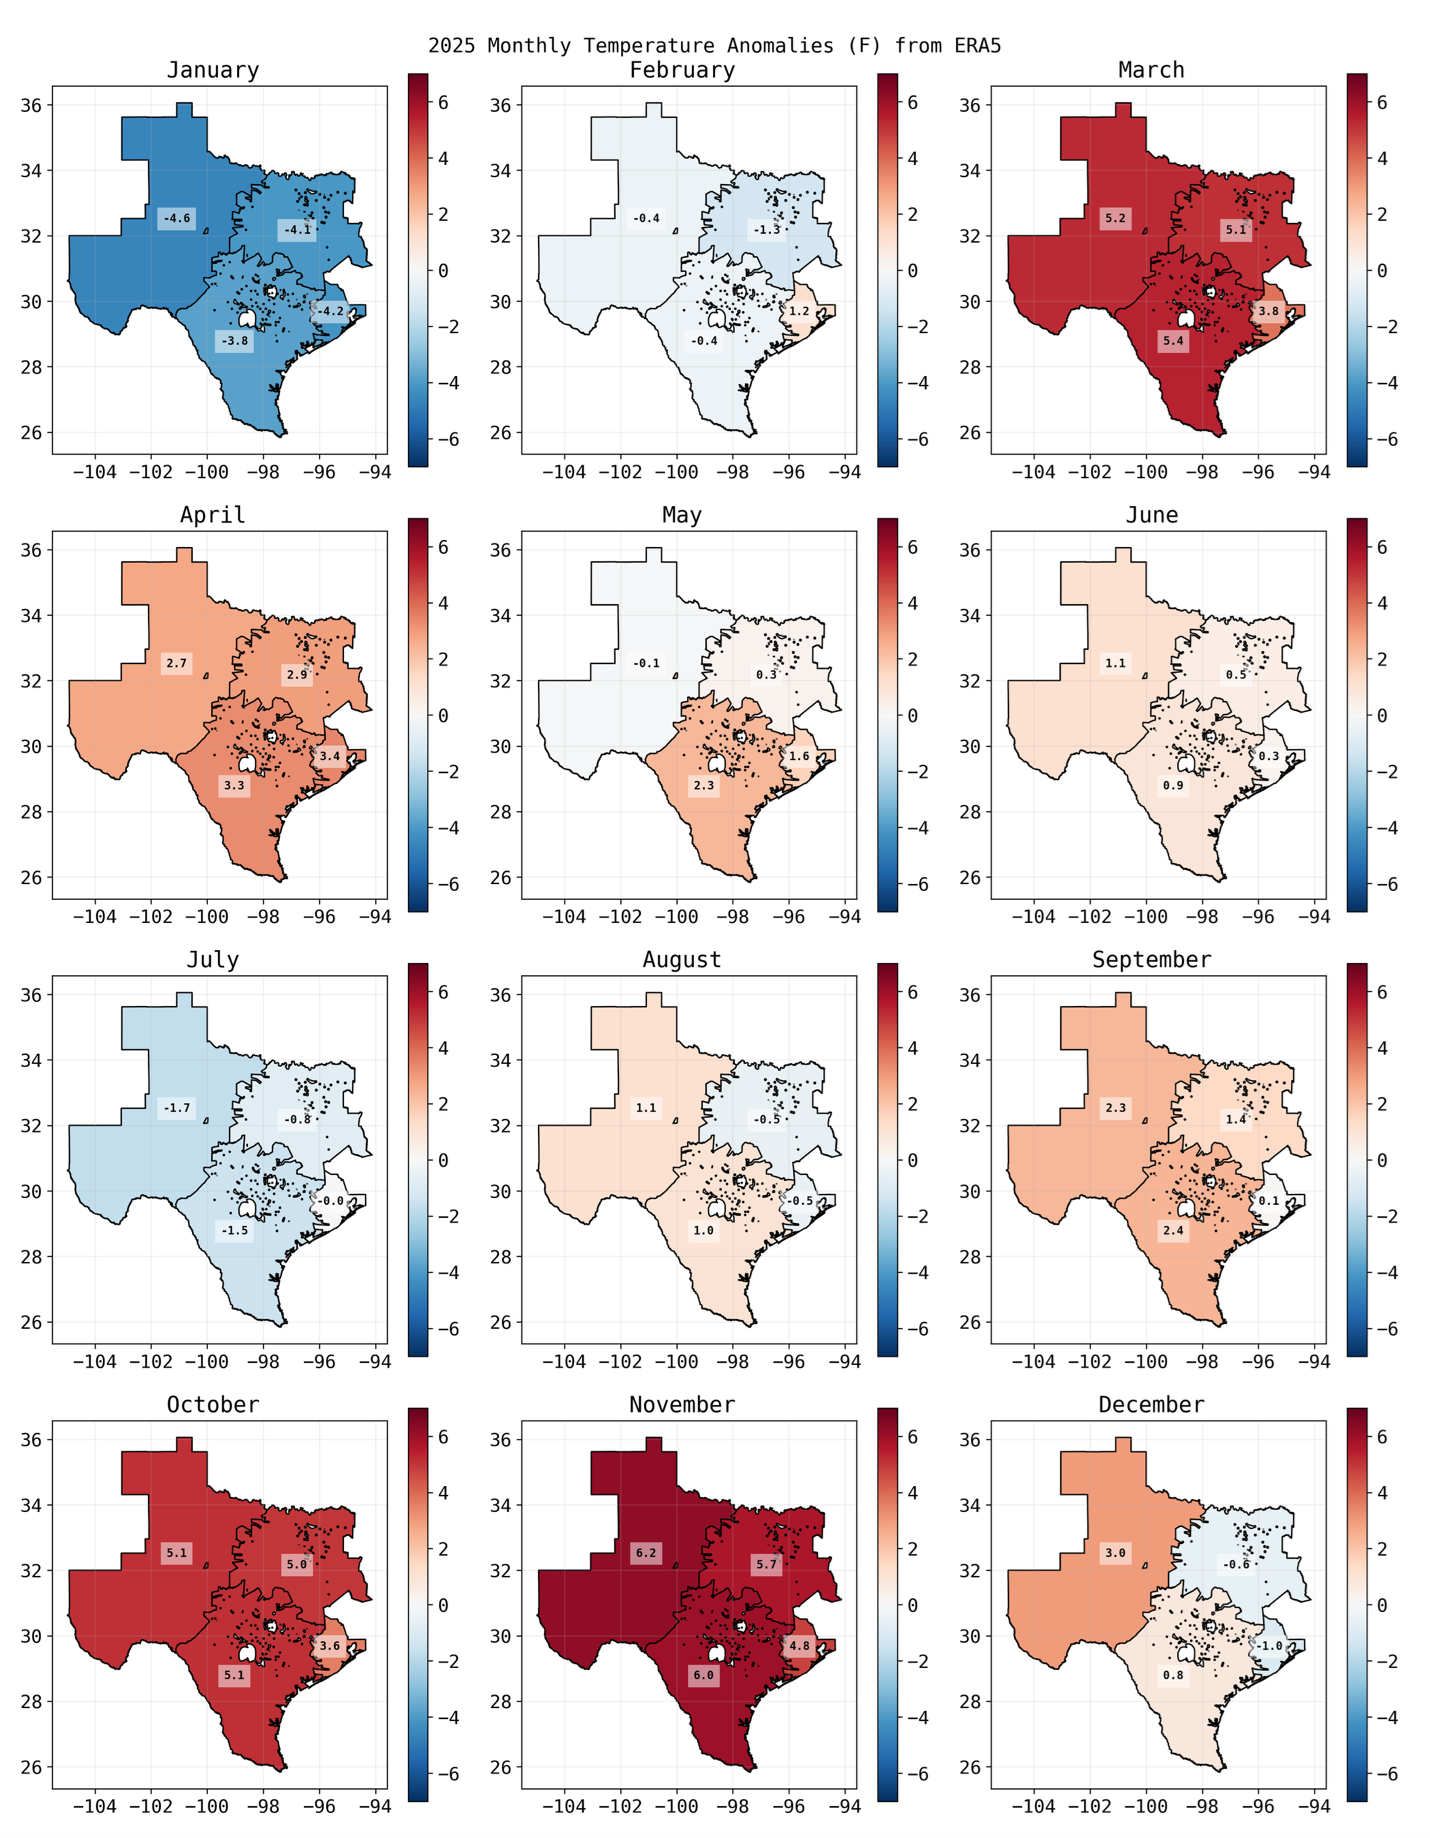
The anomaly maps below add helpful context on when 2025 diverged from normal. Spring and fall shoulder periods ran notably warmer than average. In contrast, January was very cold before conditions normalized in February, followed by a warm March and April. Summer anomalies were moderate, especially relative to the other seasons. Another key point is that anomalies were not uniform across zones, which sets the stage for inter-zonal dynamics rather than a single “ERCOT-wide” weather story.
The seasonal city breakdown makes that geographic nuance more concrete:
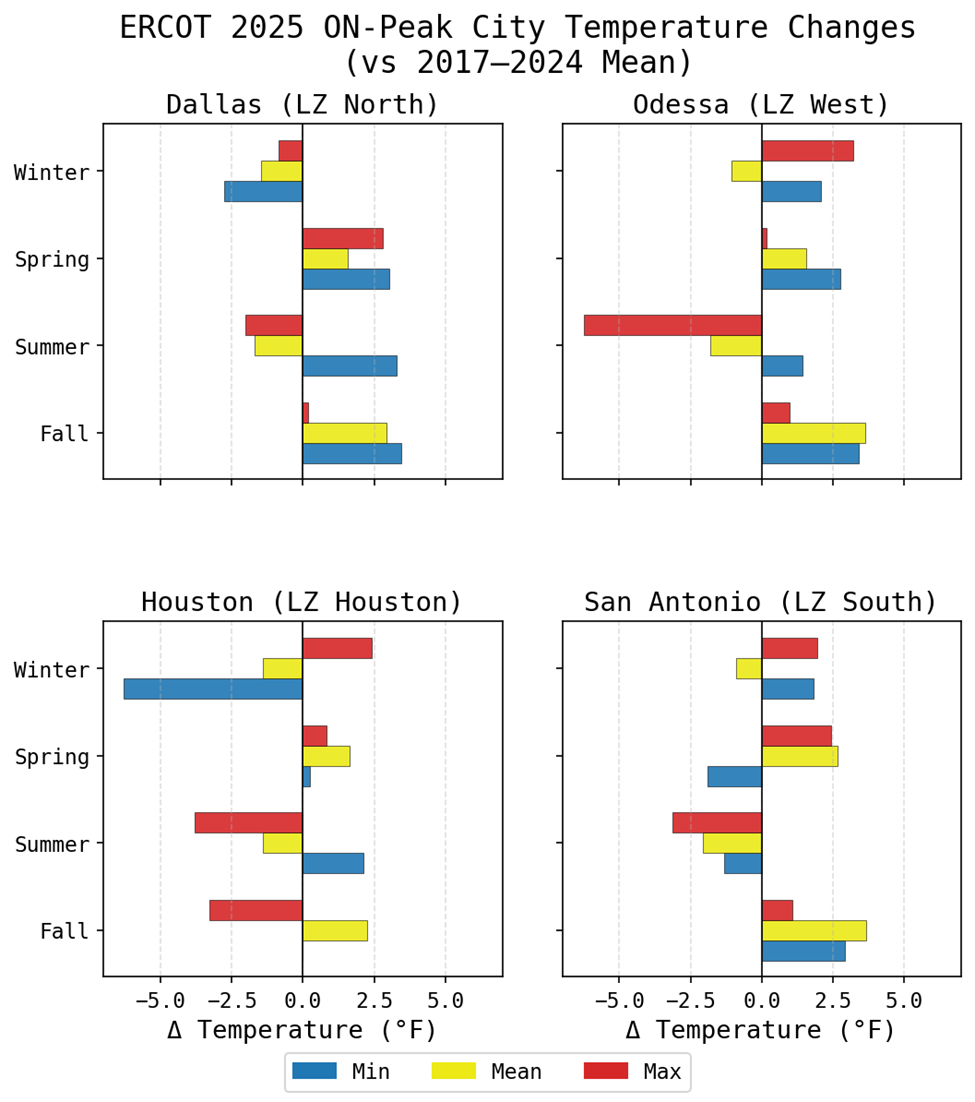
Our takeaway: 2025’s weather signals were highly locational and seasonal—meaning “average ERCOT conditions” would have missed important differences in how and when temperature-driven pressure showed up across zones.
Load and net load changes suggest that the “center of gravity” for load growth in ERCOT may be expanding beyond the traditional summer focus. Winter shows moderate to high load growth across all zones, especially in maximum load changes. That lines up with the unusually cold January we saw in the temperature anomaly figure and supports the idea that winter is increasingly behaving like a second peak season. A notable pattern is that maximum load percent change exceeds mean load percent change in many cases, most clearly in winter across every zone, pointing to increasing volatility in load shape and potentially sharper ramps. Shoulder months also show growth, reinforcing that spring and fall may no longer be reliably low-stress periods from a system-pattern standpoint.
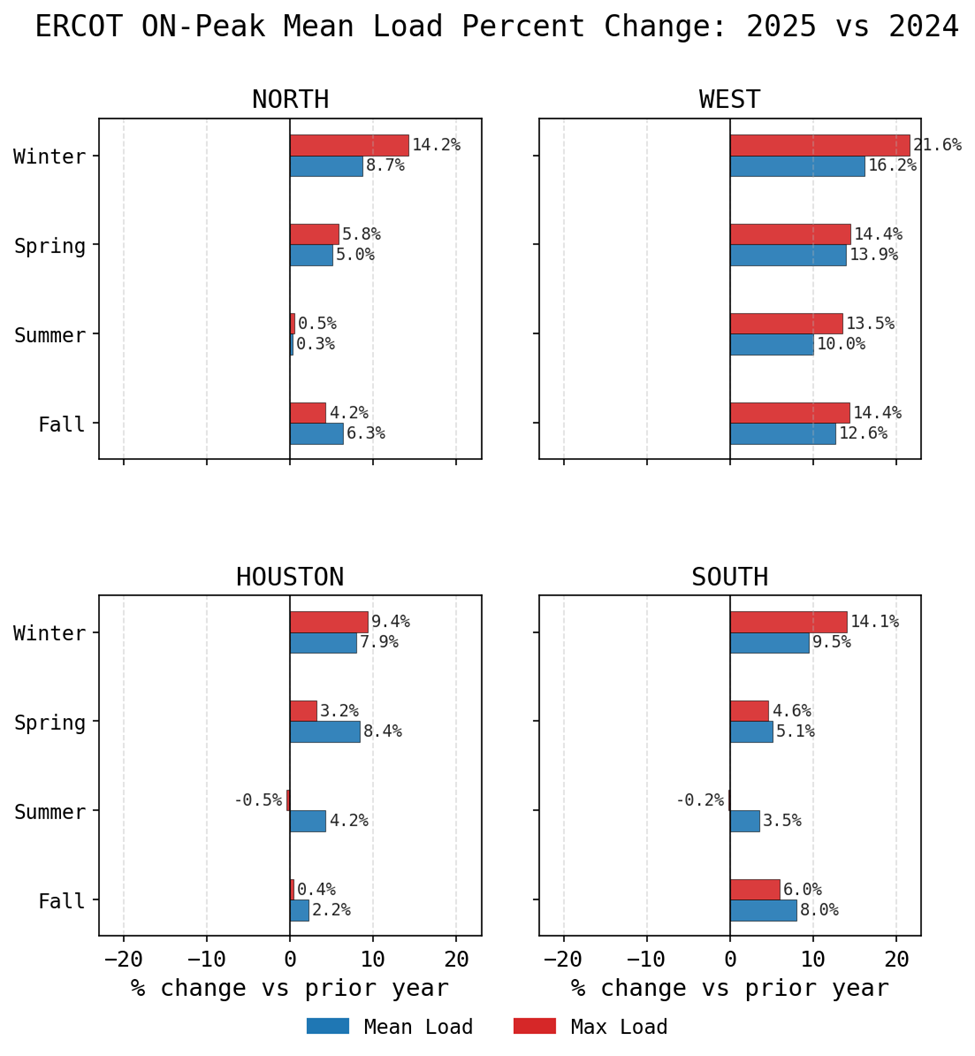
Summer load changes are modest across most areas except West, which aligns with the relatively moderate summer temperature anomalies and may hint that summer growth is more mature in some zones. West shows double-digit percentage increases in nearly all seasons, but it’s important to interpret that in context: West load remains small relative to the major hubs, with mean monthly loads rarely exceeding 10GW, so even modest absolute increases can register as large percentage gains. Still, the directional signal matches real-world developments in the region: Permian load growth, electrification, ongoing oil and gas activity, and data center build-out, suggesting the West zone’s load footprint is continuing to evolve.
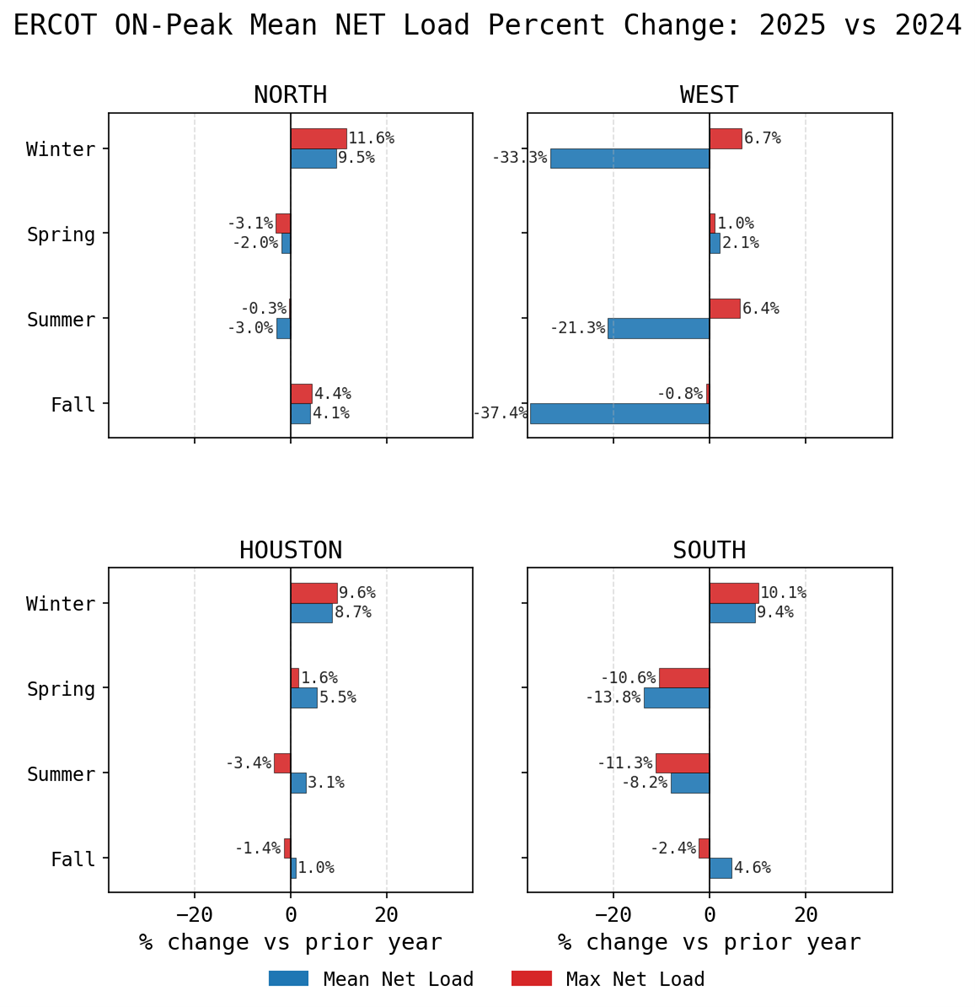
Net load changes add another layer. Winter net load increased across North, South, and Houston, pointing again to winter as a season where volatility may be rising as renewables work to keep pace with higher demand. In spring and summer, net load is negative in South, which is consistent with significant renewable generation growth in that zone between 2024 and 2025; a similar but smaller effect appears in North. West mean net loads decreased strongly year-over-year, which makes sense given this zone’s high renewable generation and overall low loads, as mentioned before. However, with renewable generation increases in West looking modest relative to this large net load decrease, it is possible that structural export pressure came into play as well, highlighting potential changes in West-North/Houston congestion patterns.
Our takeaway: The 2025 load story looks broader than “just summer,” while net load patterns increasingly reflect where renewable growth is occurring, reshaping seasonal risk windows and changing the system’s regional balance.
The wind and solar changes we see reinforce the continued year-over-year increase in renewable generation, with 2025 extending that trend. What stands out most is the apparent acceleration in solar growth: increases in 2025 are steeper across all zones than in prior years, suggesting the pace of solar additions is rising. Wind also shows stronger growth into 2025 than in the immediately preceding period, though the longer-run shape implies wind’s most rapid buildout occurred earlier (pre-2022), with the system now increasingly focused on bringing solar online quickly across multiple zones.
While West still dominates overall renewable output, other zones continue to catch up gradually. The increase in North-zone solar is especially notable because it represents more locally generated renewable energy in a high-demand area. That kind of shift can matter because it changes not only total renewable penetration, but also where generation is produced relative to load, potentially influencing how much the system relies on inter-zonal transfers from traditional exporting regions.
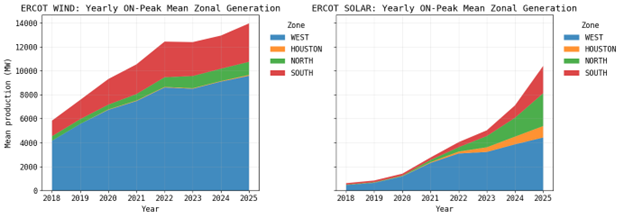
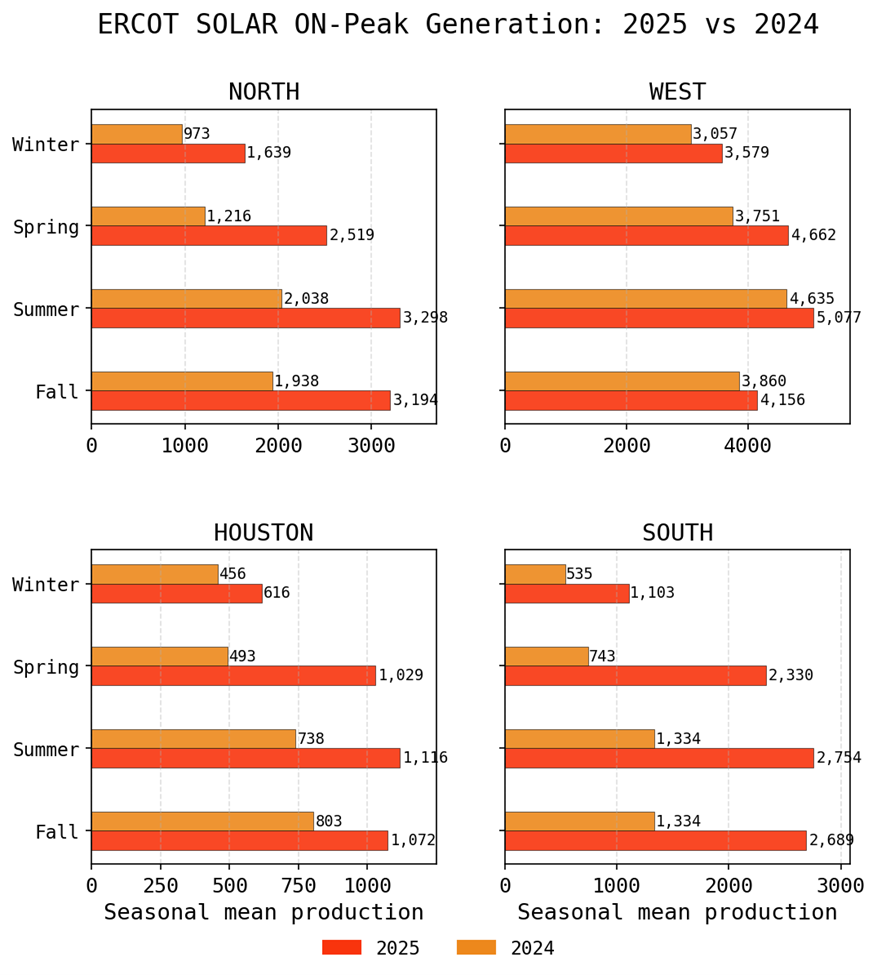
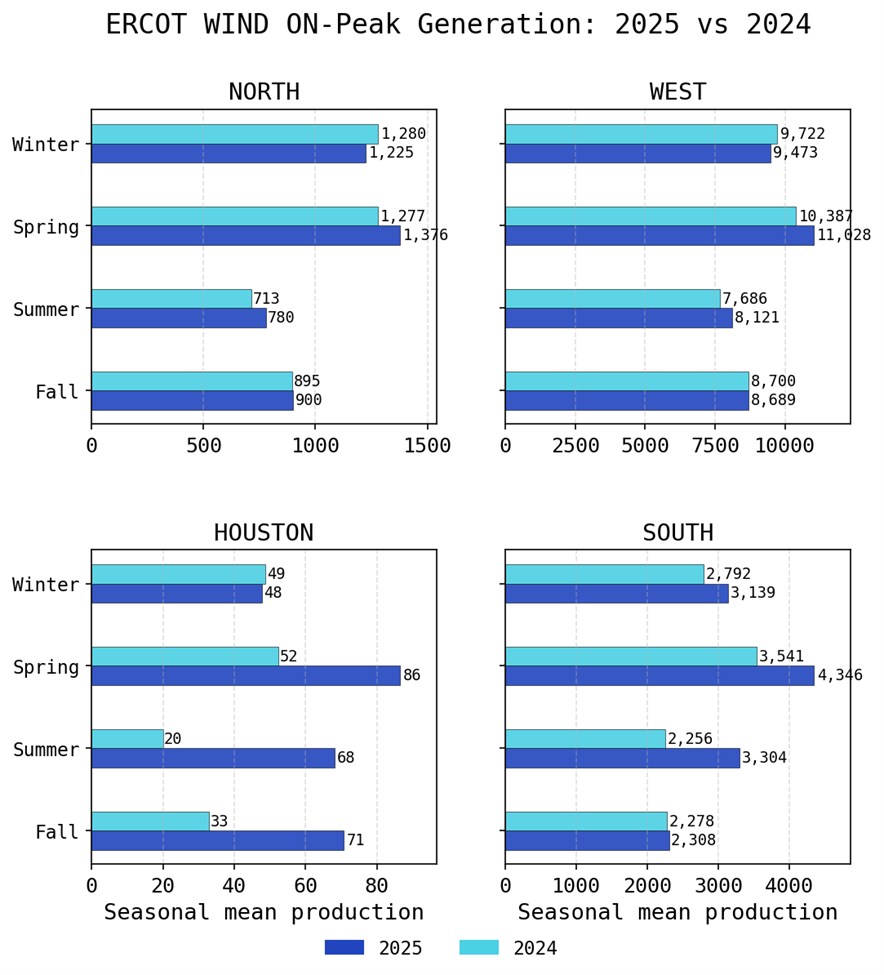
Our takeaway: 2025 reinforces a renewable story that’s not just “more volume,” but also “different geography”, with solar growth accelerating and localized buildout in major demand zones becoming an increasingly important part of the ERCOT picture.
Taken together, our 2025 data tell a story of gradual but meaningful change. Weather risk was highly locational and often concentrated in shoulder seasons rather than purely in summer. Load growth appears to be broadening beyond traditional peak months, with winter increasingly resembling a second stress season. At the same time, renewable buildout, particularly accelerating solar additions, continues to reshape net load patterns and shift where export and congestion pressure may emerge.
None of these trends alone defines the market. But in combination, they suggest that the ERCOT risk landscape is becoming more distributed across seasons and more dependent on zonal detail. For FTR participants, that makes our Enverus MTNRF granular, seasonal visibility into temperature, load, and renewable trends increasingly valuable.
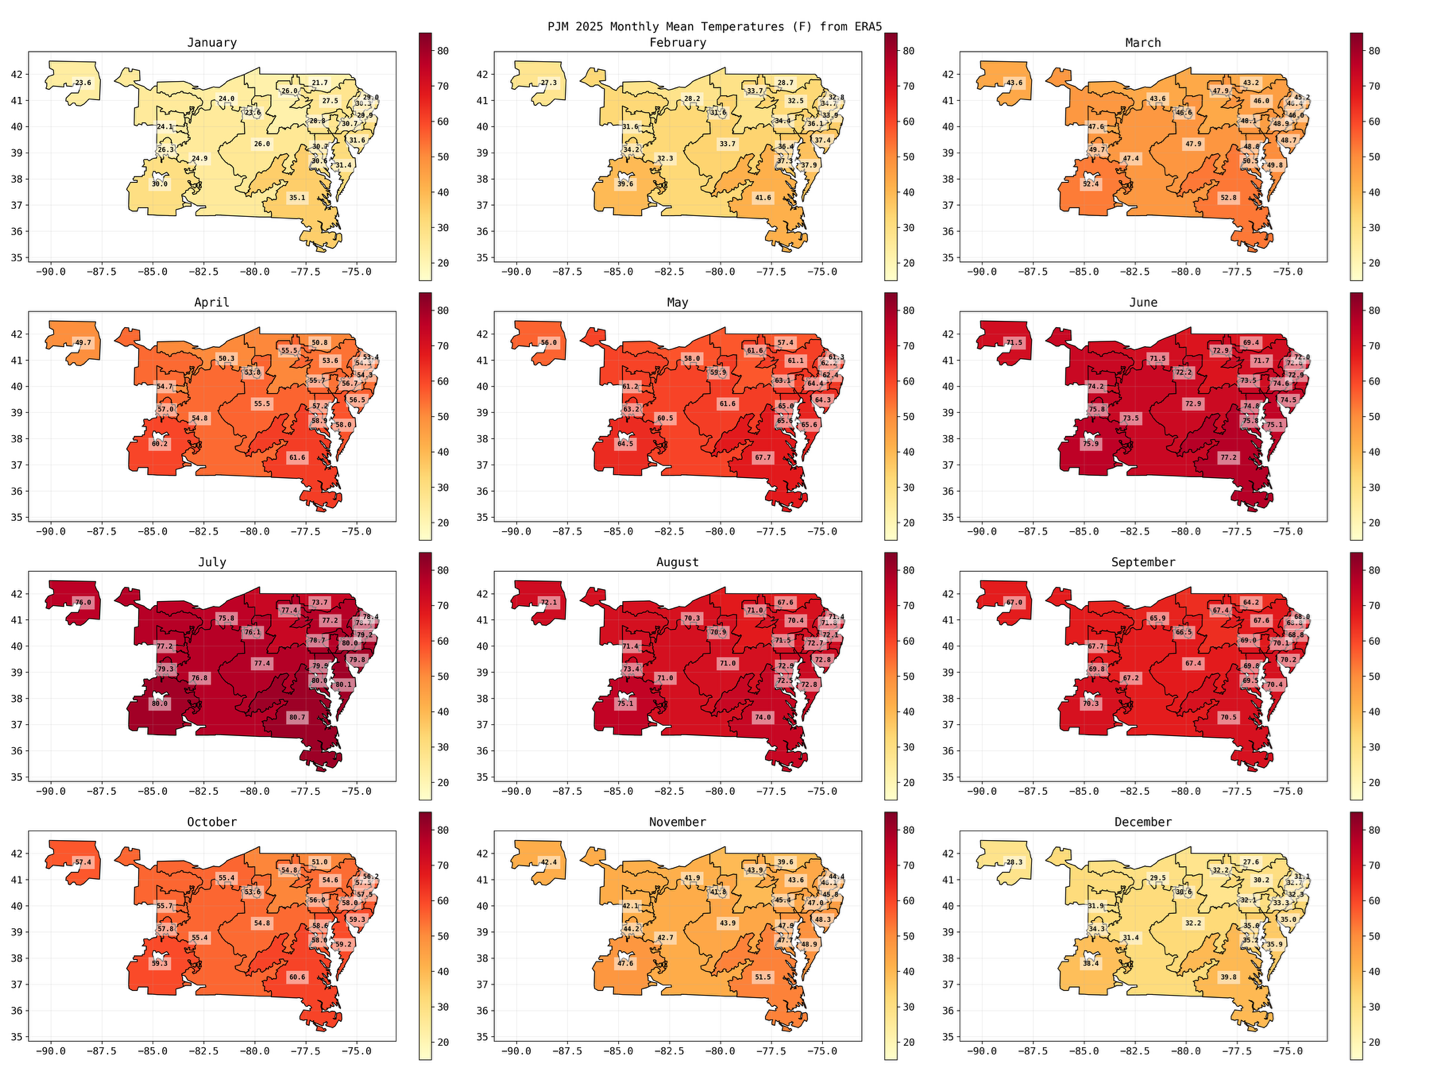
Mean zonal temperatures show a clear seasonal arc. January and December were materially colder than the 2017–2024 baseline across nearly all PJM zones. March stands out as broadly warm, marking a decisive shoulder-season shift. Early summer leaned warmer, but August reversed course with below-normal temperatures in much of the footprint. Fall anomalies were comparatively muted.
The sequencing is important. Cold conditions reinforced winter load before a spring reset, and summer warmth lacked the persistence of a prolonged heatwave year. Weather pressure moved through the calendar rather than accumulating in a single sustained regime.
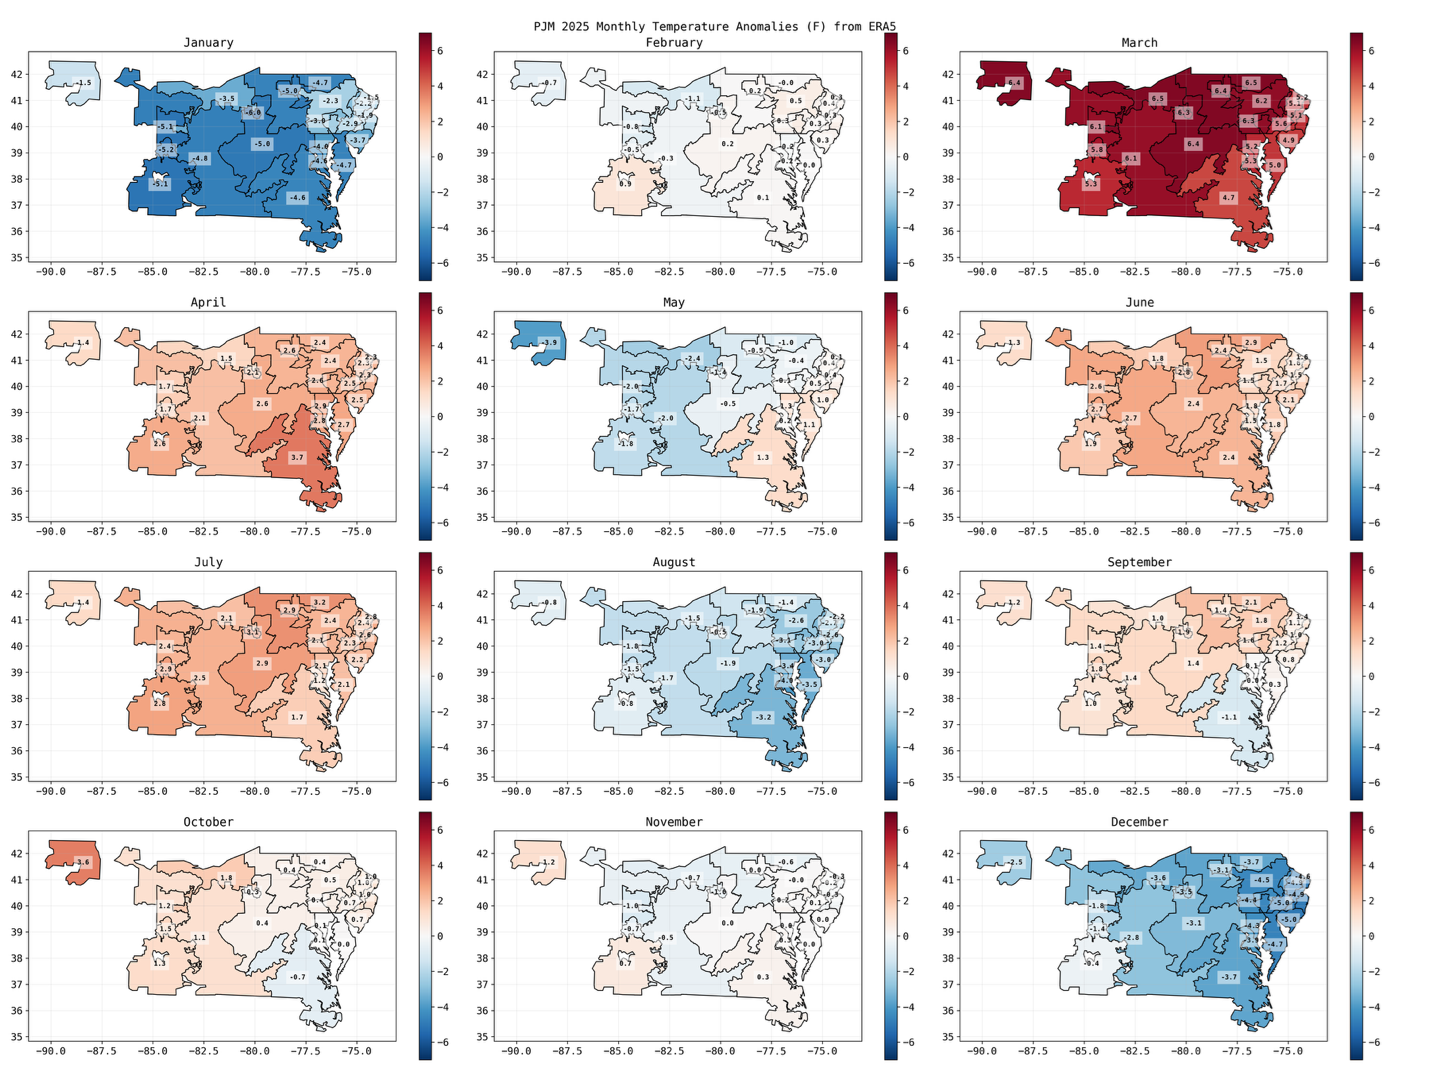
The anomaly view highlights geographic dispersion. Winter anomalies were not only negative but differentiated across zones, reinforcing north–south and inland–coastal gradients. March warmth was more uniform, compressing spatial variability. Summer showed moderate positives early and widespread negatives in August, while fall remained closer to normal.
For congestion-sensitive markets, dispersion can matter as much as magnitude. Uneven anomalies tend to widen zonal demand differentials, while uniform warmth or cold moves the system more cohesively.
City-level data reinforce the ISO-scale patterns and add intraday detail. Nearly all cities experienced significantly lower winter minimum temperatures, strengthening overnight heating demand. Spring shows warmer means but relatively muted extremes. Summer reveals a widening intraday spread: cooler minimums paired with warmer maximums. Fall anomalies are comparatively modest across cities.
The summer distribution shift is particularly relevant. Hotter daytime highs combined with cooler nights can intensify peak-hour sensitivity without extending multi-day stress events. Winter, by contrast, strengthened the demand floor rather than producing isolated spikes.
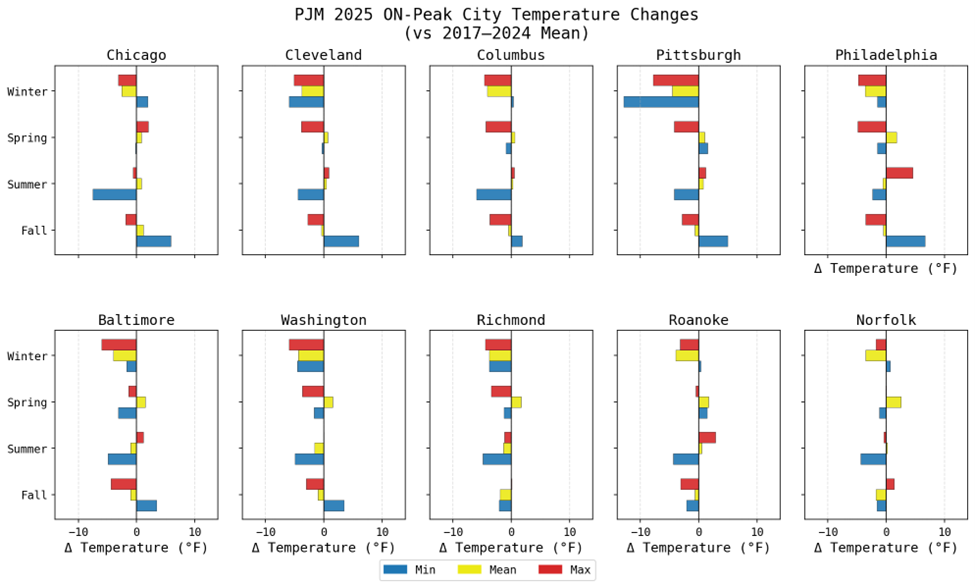
Our takeaway: 2025 temperature risk in PJM was defined by rotation and distribution. Winter reinforced the demand floor, spring compressed variability, summer concentrated stress into peak hours, and fall remained comparatively controlled. Geographic dispersion, especially in winter, likely mattered more for congestion patterns than annual averages alone.
Load changes closely tracked the seasonal temperature arc. Winter shows growth in both mean and peak demand across all zones, consistent with the colder January and December conditions. This was not limited to isolated peaks; average load levels moved higher as well, reinforcing a stronger winter base.
Spring presents the smallest changes of the year. Several Mid-Atlantic zones and the system-wide view show flat-to-negative movement, consistent with warm March conditions and moderately warm April temperatures suppressing residual heating demand.
Summer load growth was moderate rather than dramatic. Warmer June and July were tempered by a cooler August, limiting the expansion in seasonal averages. The southern region stands out for showing load growth in all seasons — both mean and peak — indicating a more consistent structural increase.
Fall load increases across most zones are notable given relatively muted fall temperature anomalies. This divergence suggests incremental structural demand growth rather than purely weather-driven movement.
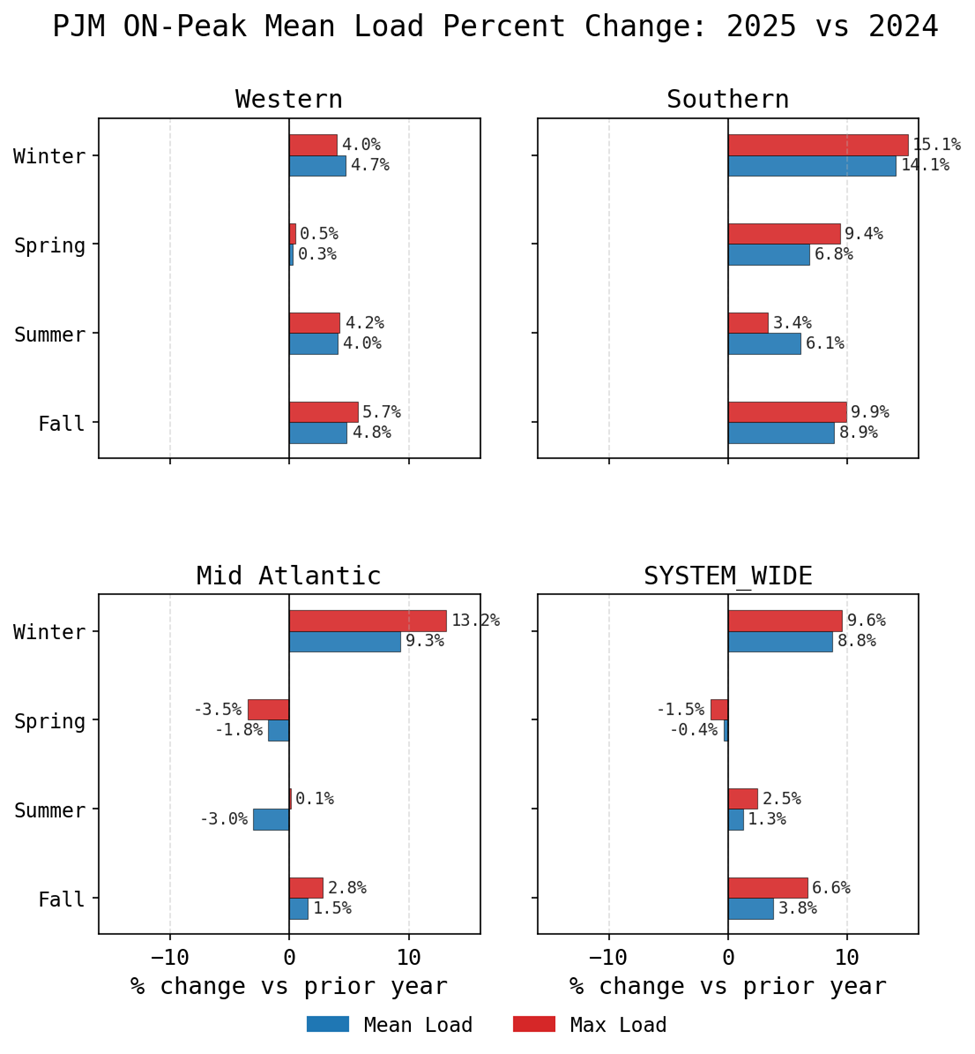
The close alignment between load and net load underscores PJM’s still demand-driven character. Renewable penetration, while growing, did not materially reshape seasonal net load structures in 2025. Winter net load increased alongside stronger heating demand. Spring softness remained visible even after accounting for renewables. Summer net load changes were moderate, reflecting limited renewable-induced compression compared to higher-penetration ISOs.
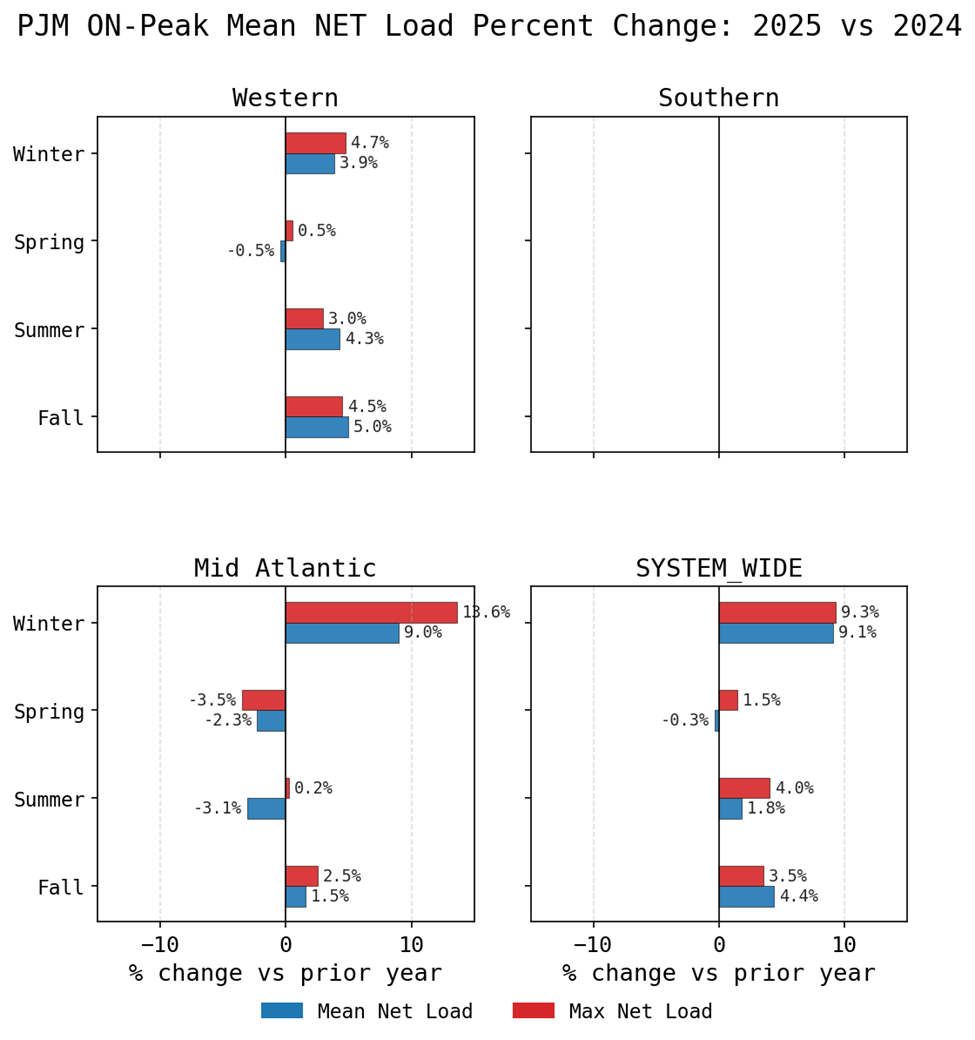
Our takeaway: Winter strengthened the demand floor across the footprint. Spring was stable and weather-muted. Summer peaks were present but not persistent. Fall showed structural load growth despite mild temperatures. Net load’s close tracking of gross load reinforces that PJM congestion remains fundamentally demand-driven.
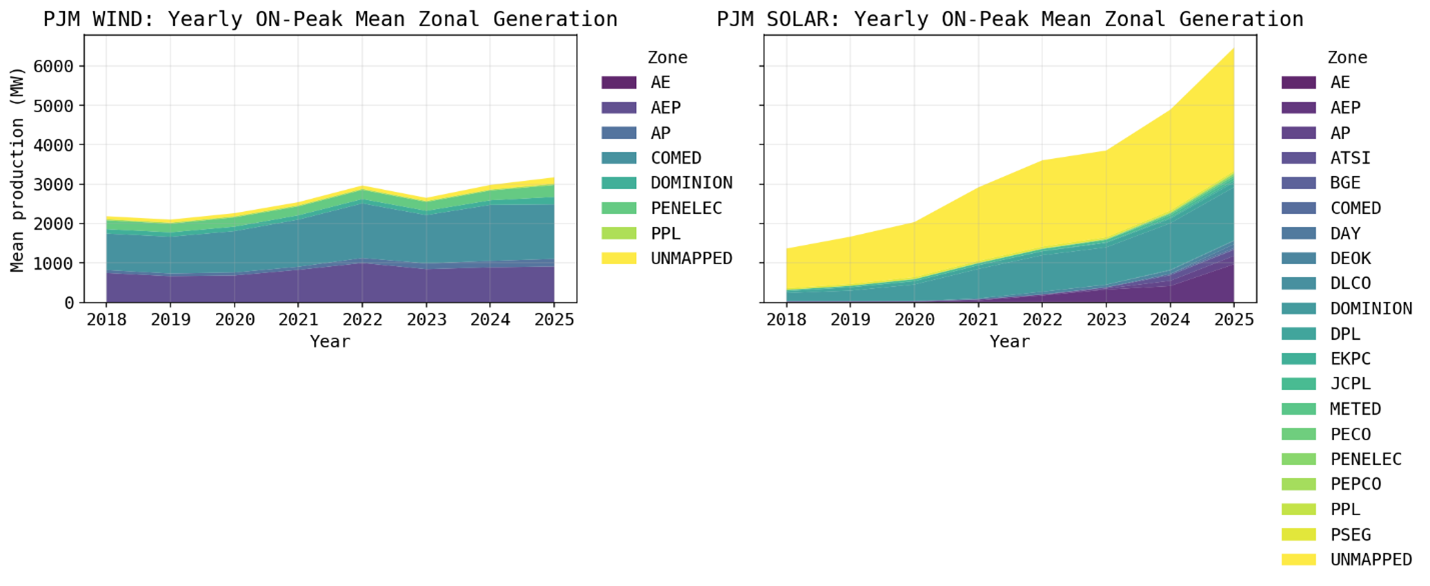
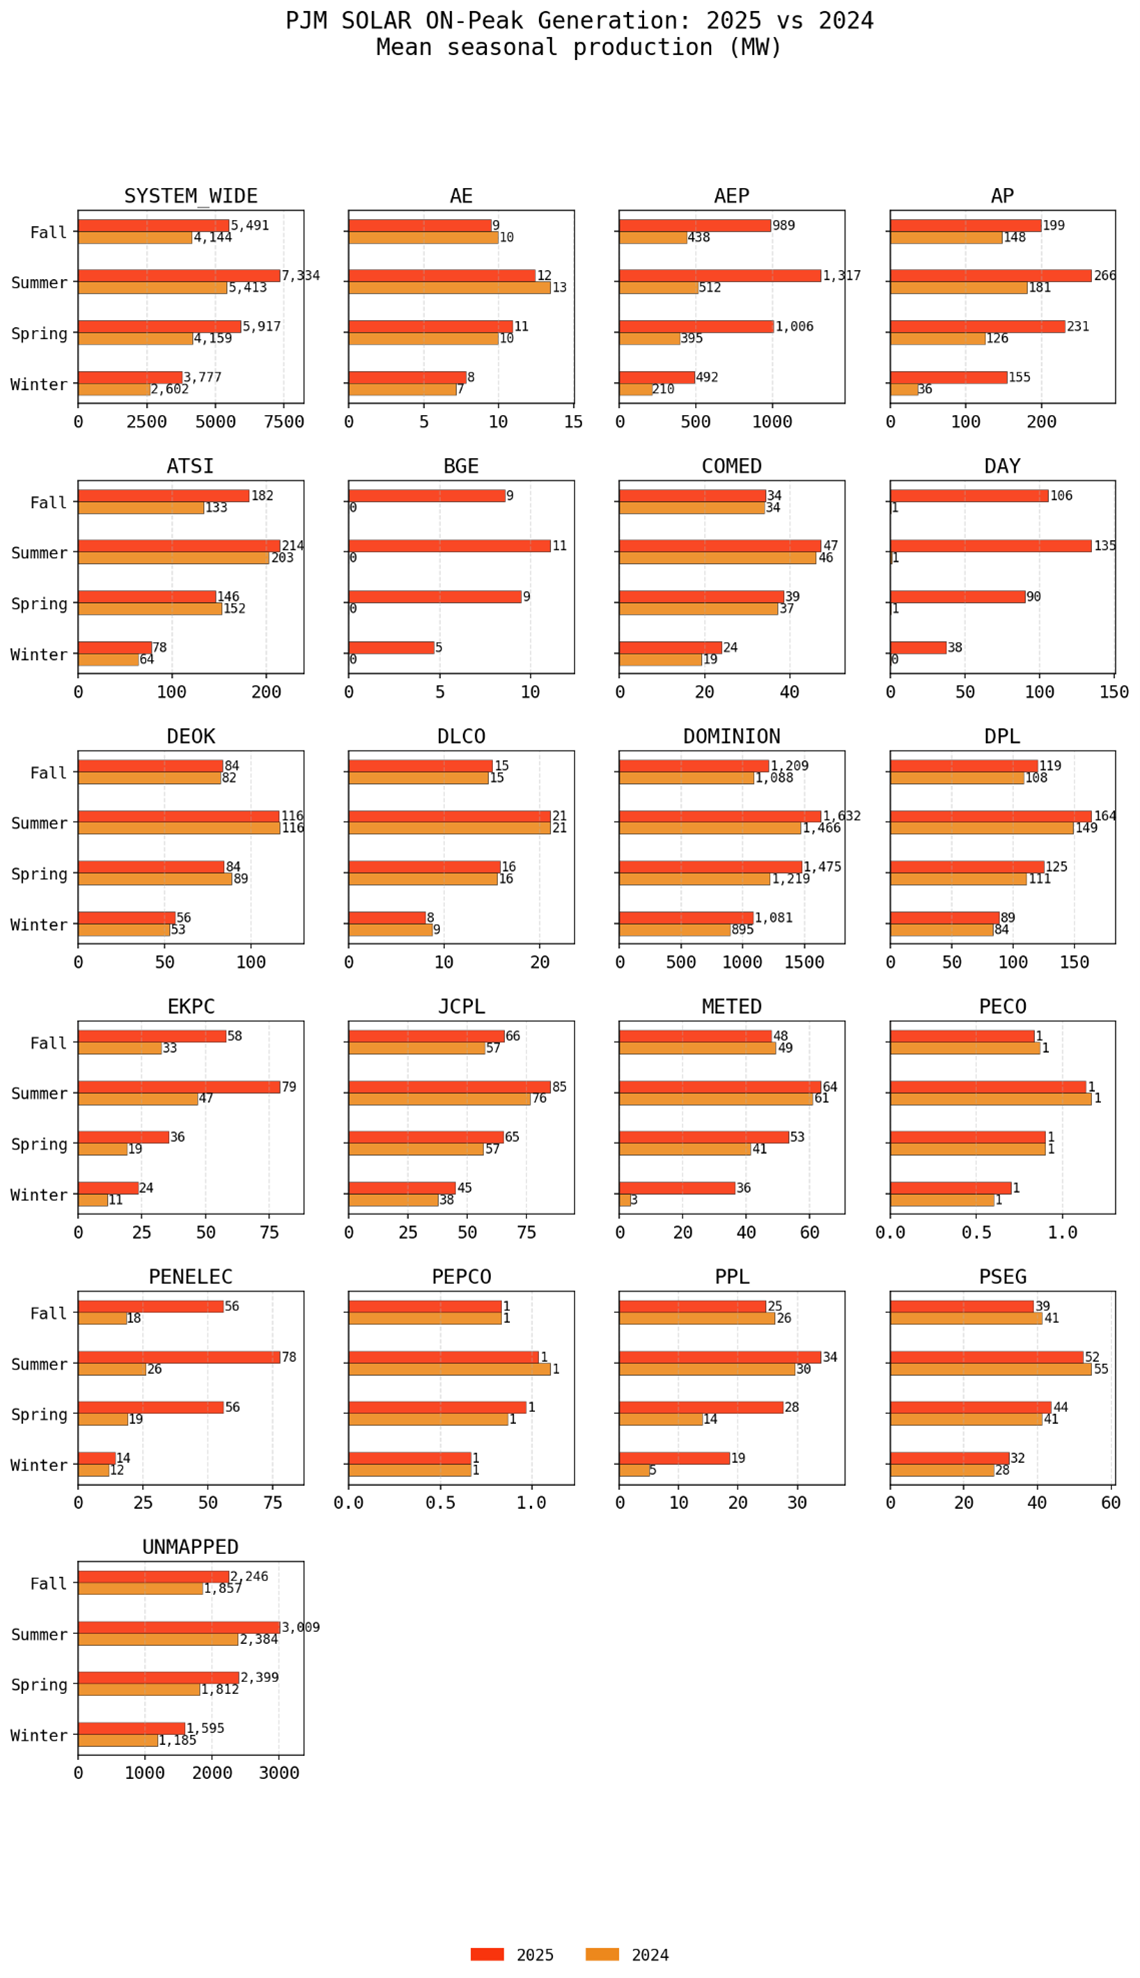
When looking at yearly zonal generation, the long-term trend shows clear divergence between wind and solar. Wind growth has been gradual and geographically concentrated. COMED remains the structural outlier with meaningful wind production, reflecting its Midwestern geography and stronger resource base. Outside of that region, additions have been modest, and 2025 does not materially alter that trajectory.
Solar, in contrast, has expanded rapidly over the past several years, with 2025 marking another step higher. Dominion and AEP stand out among mapped zones, while the “Unmapped” category shows significant growth, highlighting the speed of additions that are distributed or not yet fully zonally attributed.
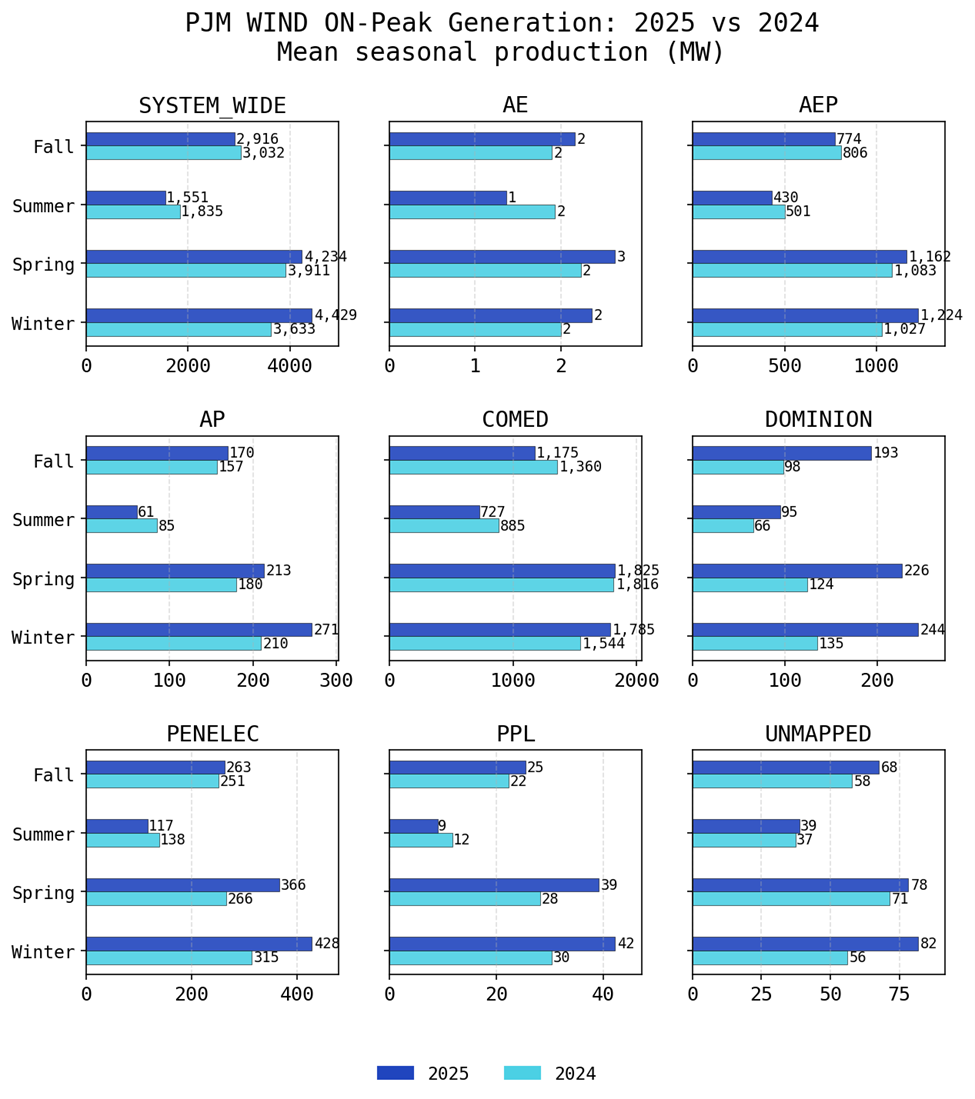
Year-over-year seasonal comparisons reinforce the divergence. Wind shows limited change across most zones, with Dominion and PENELEC posting some increases. Even so, mean seasonal wind output in these areas remains below 0.5 GW — small relative to zonal demand levels.
Solar shows stronger year-over-year increases, particularly in spring and summer. Spring solar growth coincided with already softer load, likely compressing midday net load. Summer additions increase daytime injection and may sharpen late-afternoon ramp dynamics, even if overall seasonal load growth was moderate.
Despite this acceleration, PJM remains well below renewable penetration levels seen in other ISOs that experience systematic net load inversions.
Our takeaway: Wind remains incremental and geographically constrained. Solar is accelerating and beginning to influence intraday dynamics, particularly in spring and summer. However, PJM in 2025 remained primarily demand-driven rather than structurally renewable-dominated.
PJM in 2025 was defined by seasonal rotation rather than compounding extremes. Winter cold reinforced demand across the footprint. Spring warmth muted shoulder stress. Summer heat concentrated peak sensitivity without sustaining prolonged strain. Fall load growth emerged even in the absence of strong weather signals.
Renewables added nuance but not transformation. Wind remained incremental. Solar continued to scale, increasingly relevant during daylight hours but not yet large enough to redefine seasonal net load dynamics.
For congestion markets, 2025 was less about a singular directional trend and more about timing, distribution, and zonal differentiation. Understanding where incremental demand and renewable growth intersected — and in which hours — likely mattered more than tracking annual averages alone.
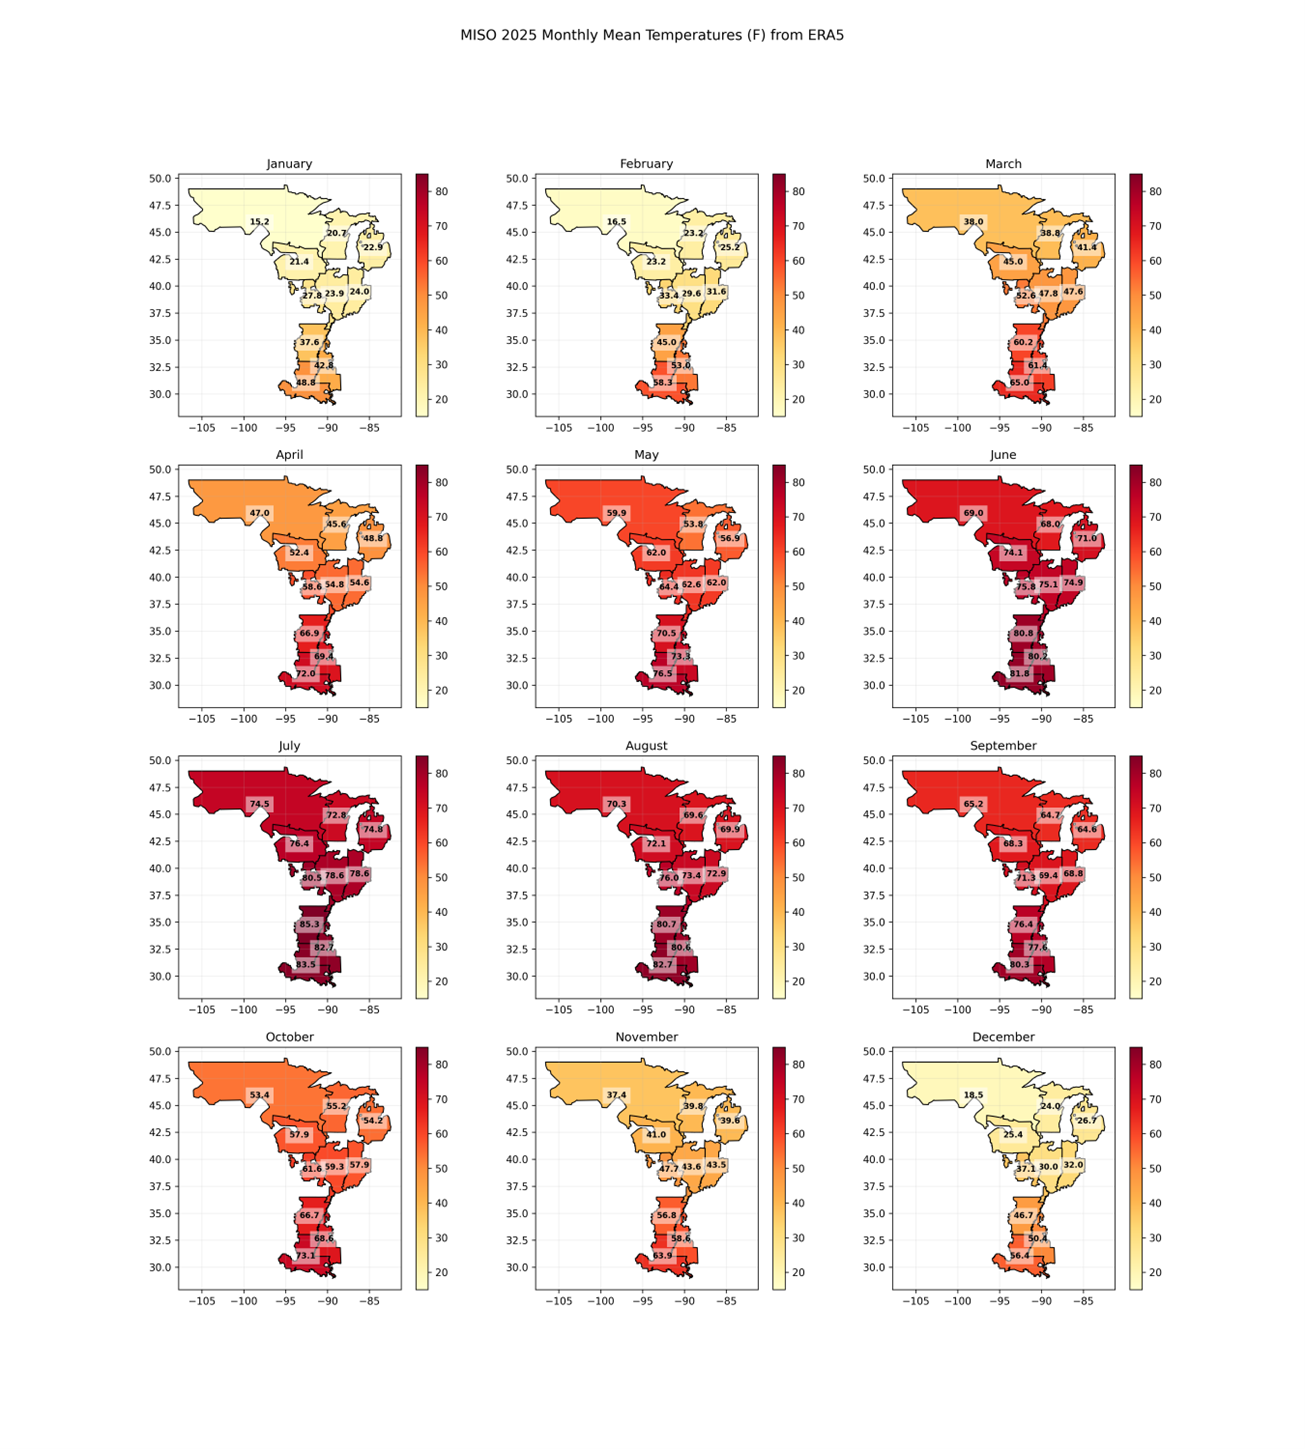
The 2025 temperature profile reinforces a key reality of MISO: system averages can obscure meaningful regional differences. With a footprint stretching from Minnesota to Louisiana, north–south gradients frequently drive divergent load and congestion outcomes across zones.
Monthly mean zonal temperatures in 2025 reflected familiar seasonal gradients, particularly in winter and fall. The year began with broad cold conditions across much of the footprint. Shoulder seasons were unusually warm, while summer was generally milder than average in many areas.
Importantly, each of the MISO Zones 1–10 exhibited distinct seasonal behavior. That variation underscores why zonal-level weather data is essential when evaluating historical congestion patterns rather than relying on ISO-wide averages.
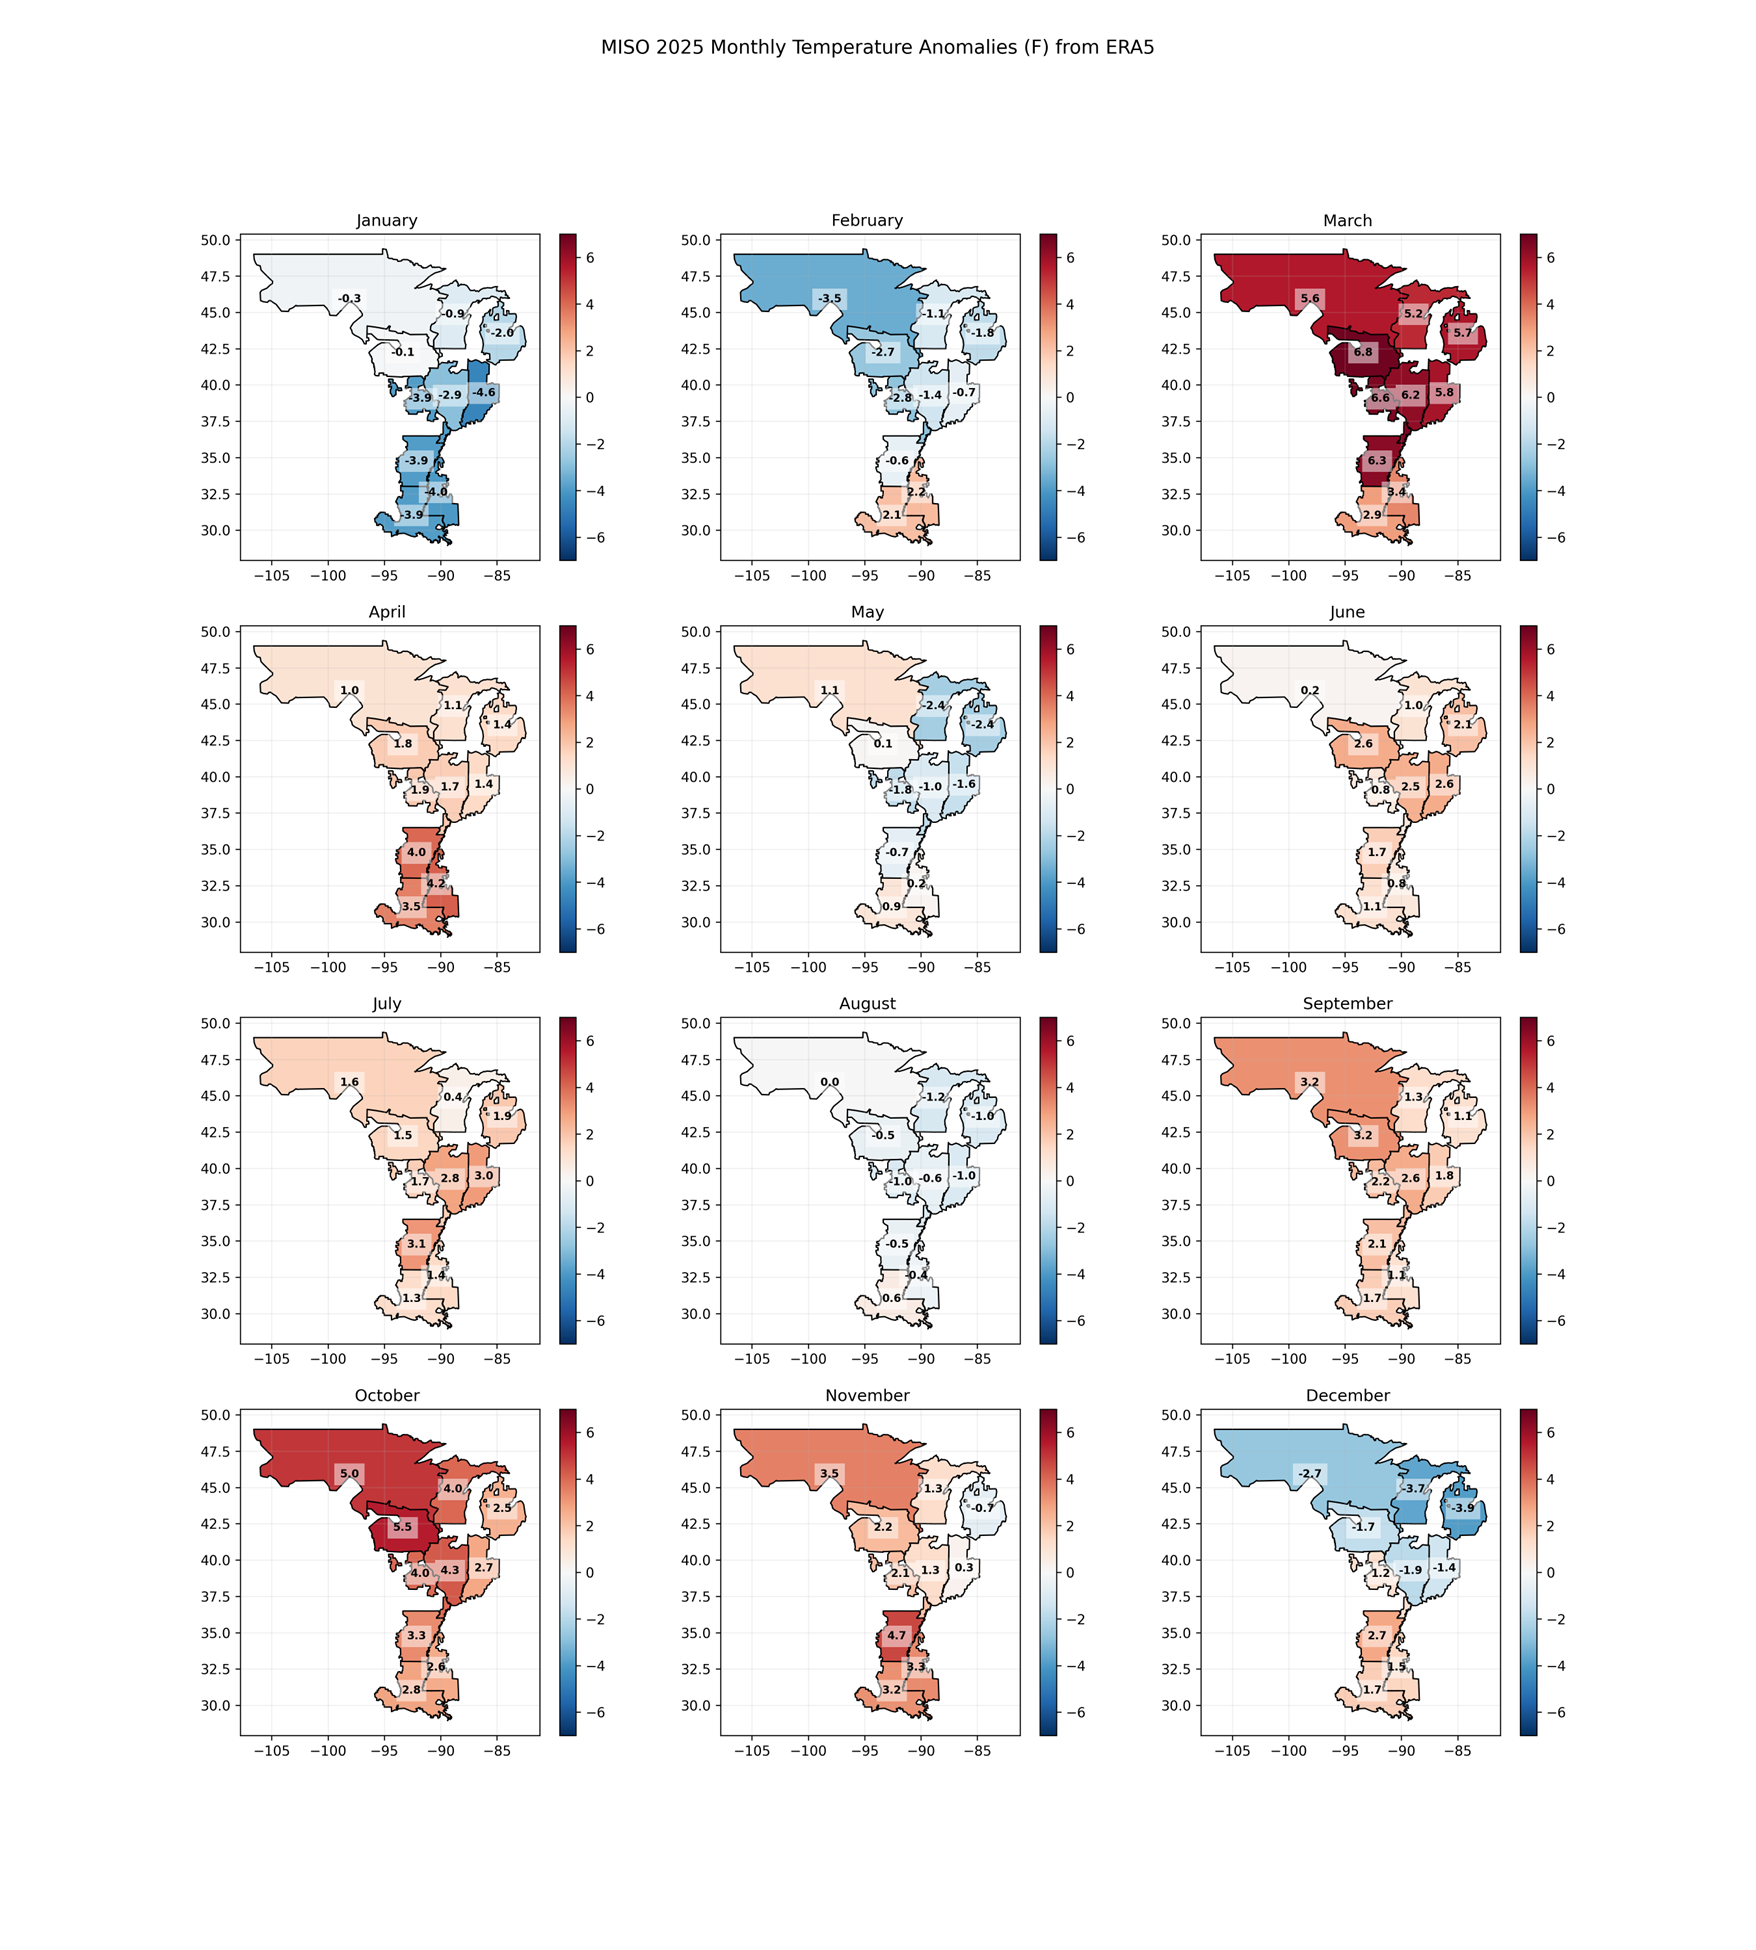
Temperature anomaly analysis adds further context by showing when and where 2025 deviated from climatology:
These swings matter because the spatial distribution of anomalies—not just the absolute temperature level—drives load asymmetry across regions.
A city-level view further illustrates the geographic nuance behind zonal averages:
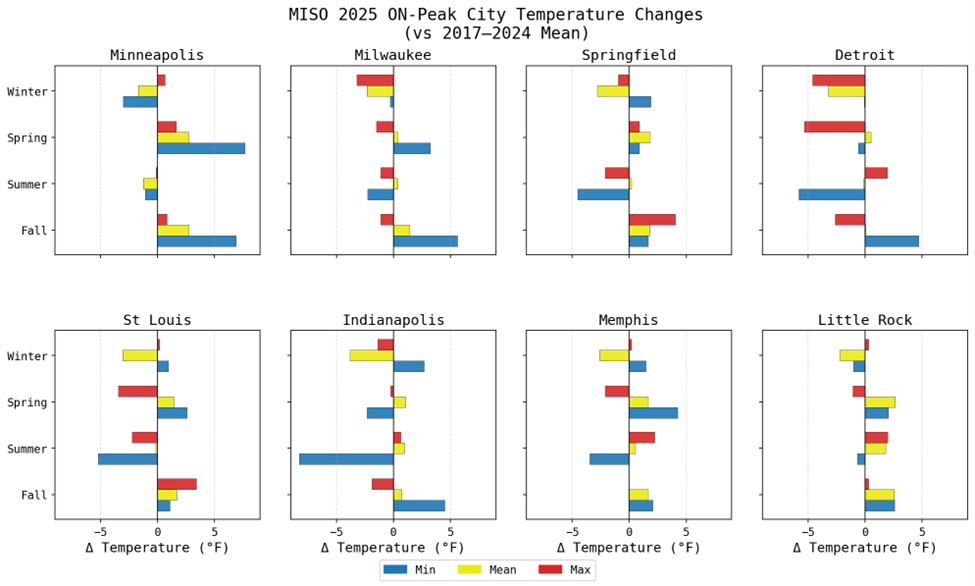
Our takeaway: MISO’s geographic breadth produces materially different regional weather outcomes within the same season. For congestion and basis analysis, these regional divergences are often more important than system-wide averages.
Persistent cold in one region, extended warmth in another, and mild shoulder seasons all shift load distribution and flow patterns differently. Understanding these zonal weather dynamics provides necessary context for interpreting historical congestion behavior and distinguishing structural patterns from weather-driven volatility.
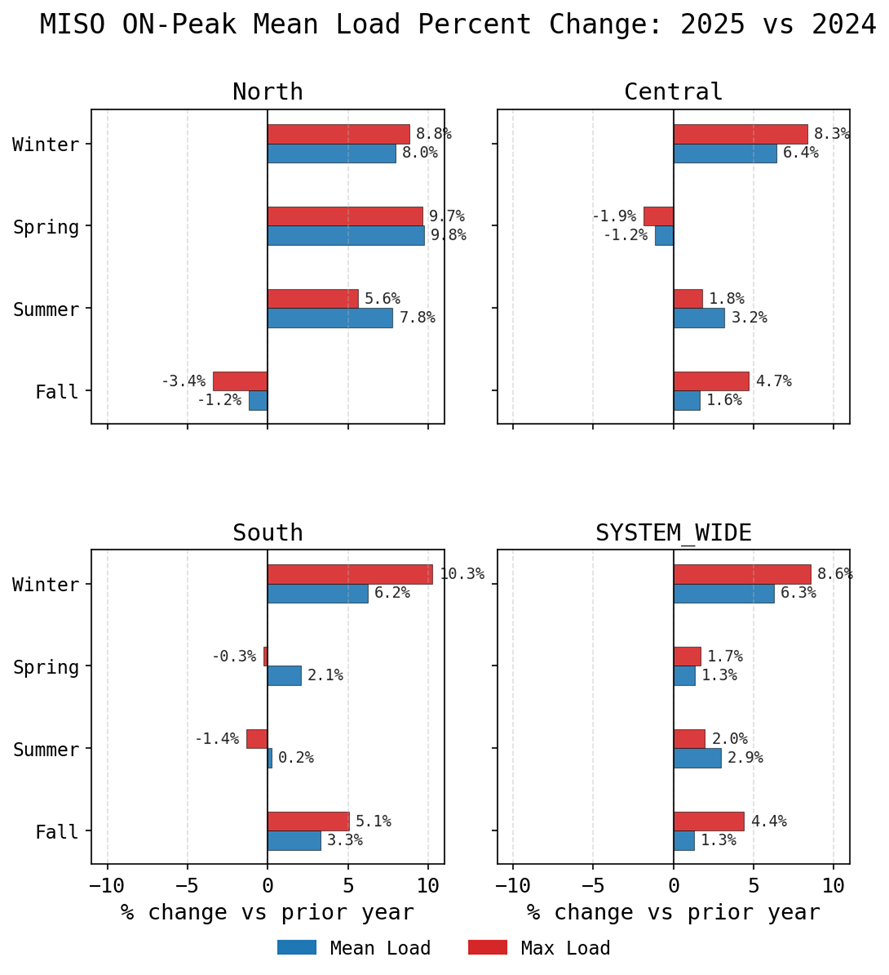
MISO load growth continued in 2025, with both mean and peak system-wide loads exceeding 2024 levels across all seasons. While weather played an important role in seasonal outcomes, the consistent rise in maximum seasonal demand points to an underlying structural growth trend.
System-wide load growth was most pronounced in winter, aligning with colder-than-average temperatures across much of the footprint. All regions posted meaningful winter demand increases relative to 2024.
The broader pattern highlights the interaction between weather variability and structural demand growth. Even in seasons where weather dampened average consumption, maximum seasonal loads continued to rise, an important signal for capacity stress and congestion risk.
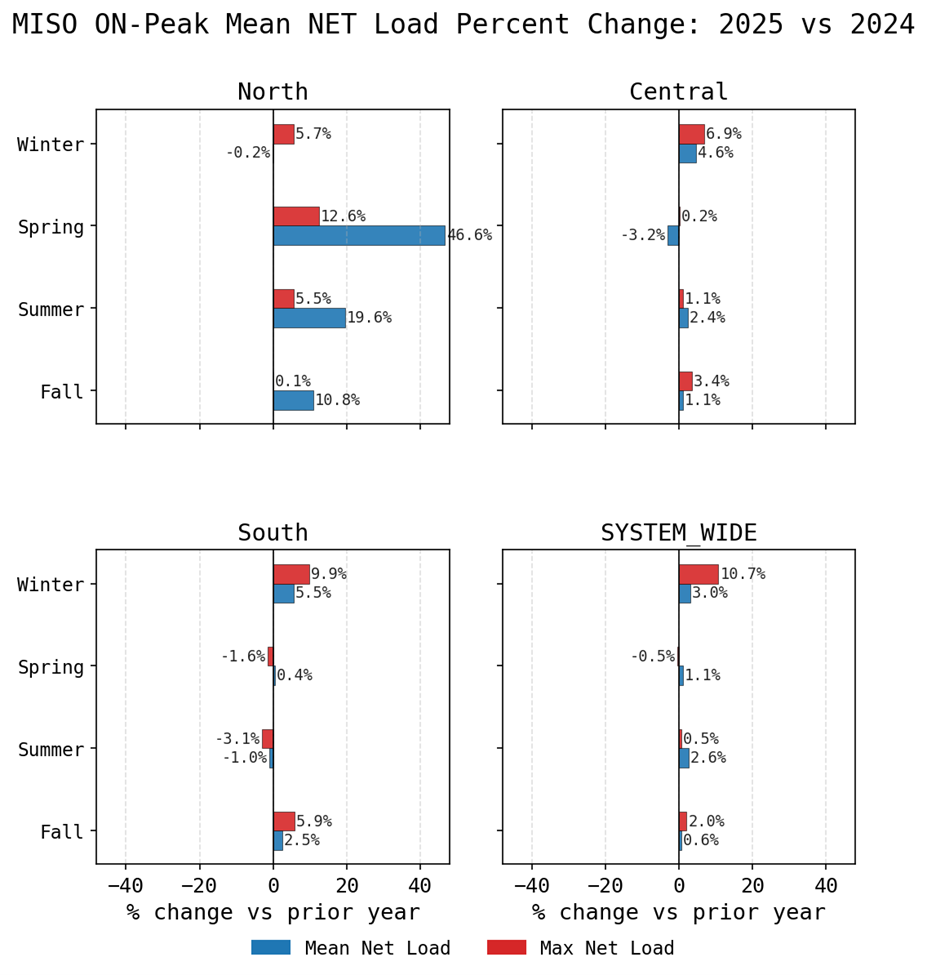
While gross load increased, net load dynamics told a more nuanced story.
Winter net load rose across all regions, reinforcing winter as a season where volatility may be increasing. On a system-wide basis, mean net load increased across all seasons. However, regional differences were significant:
These regional shifts underscore an important dynamic: load growth alone does not determine congestion risk—net load distribution does. Changes in the renewable stack can either amplify or dampen regional stress depending on technology mix and output variability.
Our takeaway: From a structural perspective, MISO demand continues to expand, as evidenced by rising mean and peak loads across seasons. However, net-load growth has not kept pace with gross load growth in every region, largely due to rapid solar adoption in the southern portion of the footprint.
The interaction between:
will be critical in understanding congestion patterns heading into 2026 and beyond. For traders evaluating historical basis and constraint behavior, isolating whether net-load shifts were demand-driven or renewable-driven is essential for determining persistence versus noise.
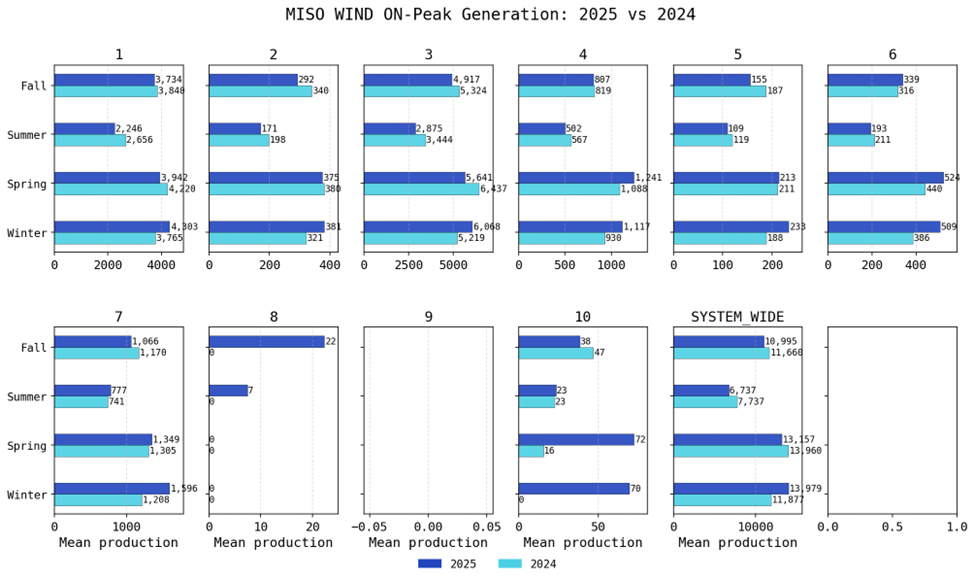
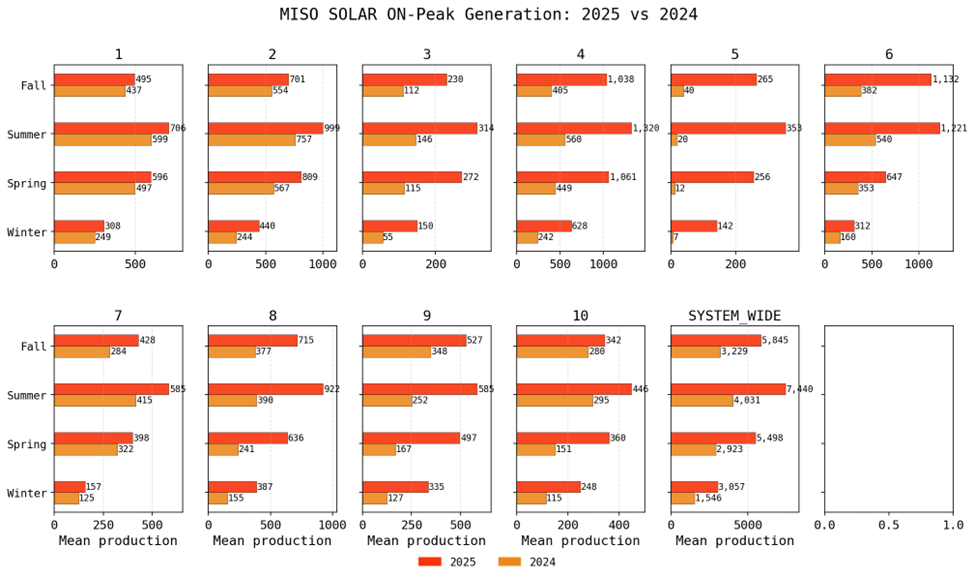
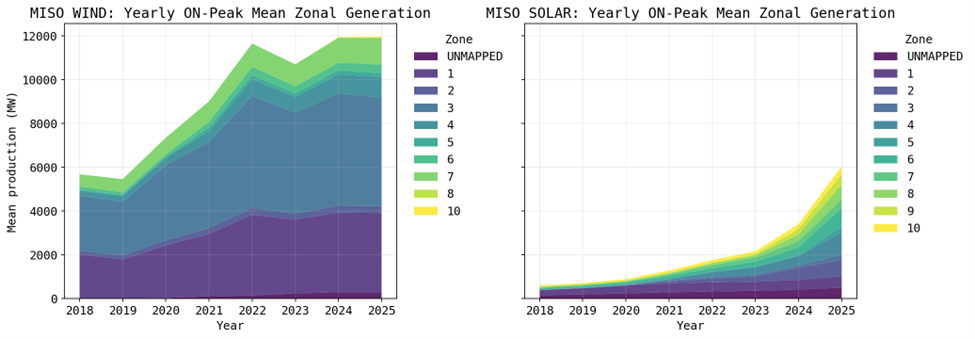
Renewable growth in MISO during 2025 was defined primarily by solar expansion. While wind remains a foundational component of the region’s supply stack, incremental renewable additions were overwhelmingly driven by new solar capacity, particularly in South and Central MISO.
Solar growth continues to reshape intraday supply dynamics, compressing midday net load and shifting ramp requirements into morning and evening hours. This effect is most visible in regions with concentrated buildout, where local solar penetration is beginning to influence not just system-wide net load, but zonal congestion patterns.
By contrast, the rapid wind buildout observed between 2018 and 2021 has moderated. Wind output remains structurally important, especially in northern MISO, but incremental capacity additions have slowed relative to prior years. As a result, year-over-year changes in renewable growth are increasingly solar-driven rather than wind-driven.
Another structural factor is co-location and grid-adjacent development. Solar additions are often clustered near available transmission capacity or load centers, meaning the geographic distribution of new build is becoming as important as total MW added. At the same time, battery deployments and data center growth are beginning to interact with solar-heavy regions, further reshaping localized supply-demand balances.
Our takeaway: The most meaningful change in the 2025 renewable stack was the acceleration of solar. Unlike wind, which tends to be concentrated in northern export-heavy zones, solar growth is more geographically dispersed, with particularly strong additions in South and Central MISO.
For market participants analyzing congestion and basis behavior, this shift matters because:
Going forward, continued solar growth is likely to be the dominant driver of renewable-driven congestion shifts within MISO. Understanding where capacity is being added—not just how much—is becoming increasingly important when evaluating historical trends and projecting future structural impacts.
In 2025, MISO experienced continued structural load growth alongside an accelerating shift in its renewable generation mix. Mean and peak system-wide loads increased across all seasons relative to 2024, with winter showing the strongest gains due to colder-than-average conditions, while regional differences reflected localized weather patterns. Net load also rose on a system-wide basis, particularly in North MISO, where weaker year-over-year wind output amplified demand growth. At the same time, rapid solar expansion, concentrated in South and Central MISO, tempered net-load growth in solar-heavy regions and increasingly reshaped intraday supply dynamics. Together, steady demand growth and solar-driven changes in the renewable stack made 2025 represent evolving structural shifts in regional supply-demand balance.
By contrast, the rapid wind buildout observed between 2018 and 2021 has moderated. Wind output remains structurally important, especially in northern MISO, but incremental capacity additions have slowed relative to prior years. As a result, year-over-year changes in renewable growth are increasingly solar-driven rather than wind-driven.
Another structural factor is co-location and grid-adjacent development. Solar additions are often clustered near available transmission capacity or load centers, meaning the geographic distribution of new build is becoming as important as total MW added. At the same time, battery deployments and data center growth are beginning to interact with solar-heavy regions, further reshaping localized supply-demand balances.
Advanced grid insights with accurate load forecasts and extensive monitoring enhance trade execution and profitability.
Quickly identify grid opportunities and risks with high-quality mid-term forecasts, expert analysis and streamlined grid analysis.
Confidently shape your investment strategy, identify optimal power asset locations and optimize utility scale PV project profitability—all in minutes.
With Enverus Instant Analyst™, you receive answers you can trust, delivered in seconds. Sourcing from 25+ years of vetted data and research on the most trusted SaaS platform designed exclusively for energy.
Site your next data center 4x faster with Enverus. Enverus helps you cut costs, reduce risk and site with confidence.
Scenario-based forecasts that look 20 years into the future. Confidently plan around evolving grid dynamics, identify profitable opportunities and support strategic decisions with the most trusted long-term view in power.
Arm yourself with the knowledge to inform strategic decisions and grow your business with one source for insights across oil and gas, renewables, carbon capture and ESG.
Design PV Plants & Battery Storage Systems 90% Faster with Our Advanced Solar & Battery Software.
SUGAR™ helps grid operators and utilities manage increasing interconnection queue volumes by accelerating modeling and simulation studies, with up to 2x reduction in time-consuming study processes.
Unlock returns of electron and molecule-based energy transition technologies with deal insights, from power generation assets to CCUS and hydrogen.
Tune out the noise, get unbiased evaluations and uncover hidden opportunities with advice you can trust from experienced energy and power intelligence advisors.
Comprehensive coverage of power markets and insights into emerging energy technologies and project economics.
Interconnect offers developers certainty throughout the interconnection lifecycle, providing scenario analysis and risk assessment capabilities to improve the chances of deploying new projects.
Let’s get started!
Let’s get started!
We’ll follow up right away to show you a quick product tour.
Ready to Subscribe?
Ready to Get Started?
Ready to Subscribe?
Sign Up
Power Your Insights