[contextly_auto_sidebar]
CRUDE OIL
- US crude inventories declined by 2.5 MMbbl the week that ended Jan. 10, according to last week’s report from the US Energy Information Administration. Gasoline and distillate stocks increased by 6.7 MMbbl and 8.2 MMbbl, respectively, resulting in a very large increase of 14.5 MMbbl for total petroleum inventories. Inventory builds across the complex were largely attributable to depressed export volumes and seasonally weak demand for motor fuels. Crude runs last reported at 16.973 MMbbl/d, will likely decline in the coming weeks as margins come under pressure.
- Crude oil futures consolidated last week with the signing of the Phase 1 trade agreement between the United States and China. With the details of the agreement now public, market participants are able to assess the impact of the deal on energy markets and the world economy more broadly. Despite the recent easing of trade tensions between the world’s two largest economies, the International Monetary Fund revised its outlook for 2020 global GDP growth downward again, bringing its latest outlook to 3.3%. Indeed, China’s GDP expanded by its slowest pace in 29 years in 2019 at 6.1% and the US manufacturing sector remains in recession. The International Energy Agency forecasts global petroleum liquids demand growth of 1.2 MMbbl/d this year, but this outlook was based on the IMF’s previous forecast of 3.4% global GDP growth. First quarter demand remains weak.
- The Commodity Futures Trading Commission report released Friday for positions on Jan. 14 showed a liquidation of many of the Managed Money long positions, which was reduced by 54,304 contracts. Managed Money short positions increased by 19,174 contracts.
- Market internals continued to have a neutral to bearish bias as WTI futures consolidated into a narrow $1.91/bbl range. WTI will likely continue trading in this narrow range over the upcoming week, with last week’s low of $57.36/bbl as first support. Further declines may test the next level of support at $55/bbl. Rallies will be sold from last week’s high of $59.27/bbl up to $62.50/bbl.
NATURAL GAS
- US Lower 48 dry natural gas production decreased by 1.17 Bcf/d last week, based on modeled flow data analyzed by Enverus, while Canadian imports fell by 0.73 Bcf/d. Demand was down across the board, decreasing 0.38 Bcf/d for the Res/Com sector, 0.17 Bcf/d for power, 0.04 Bcf/d for industrial, 0.25 Bcf/d for LNG export and 0.12 Bcf/d for export to Mexico. Overall, the market dropped 1.90 Bcf/d in total supply and 1.04 Bcf/d in total demand.
- The EIA storage report last week showed a withdrawal of 109 Bcf exceeding the expected 94 Bcf draw. Total inventories are now 494 Bcf higher than at this time last year and 149 Bcf above the five-year average for this time of year. Current weather forecasts from the National Oceanic and Atmospheric Administration’s Climate Prediction Center are bearish for the coming week, showing above-average temperatures throughout the US, except for the Gulf Coast where normal temperatures are expected. In the eight- to 14-day forecast, most of the US shows normal to above-normal temperatures.
- The CFTC report released Friday, showing positions as of Jan. 14, had the Managed Money shorts increasing positions by 28,258 contracts, while the Managed Money long sector increased by 8,882 contracts. This short position is approaching record levels within the speculative trade.
- Market internals returned to a bearish bias as prices fell below the key $2.00 area with strong gains in volume and open interest. Prices are now entering territory not seen for four years. Expect additional declines with the bearish weather forecasts, taking prices down to the lows of April and May 2016 in the $1.870-$1.909 range. Beyond those lows is the March 2016 low at $1.611. The opening last night has now created a small gap in prices from Friday’s low at $1.994 and todays current high at $1.970. Rallies will need to close that gap this week to mitigate the damage of the declines. Should prices break beyond that gap, the next move up is to test the area of $2.08-$2.10, which had held declines until last week.
NATURAL GAS LIQUIDS
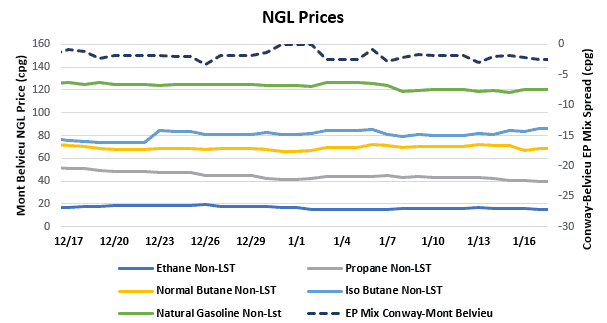
- Purity product prices moved both up and down this week. Ethane was flat on the week at $0.157/gallon, while isobutane gained $0.021 to average $0.834/gallon for the week. Propane decreased $0.028 to average $0.410/gallon, while normal butane fell $0.006 to $0.700/gallon and natural gasoline fell $0.024 to $1.193/gallon.
- Fog around the Gulf Coast limited shipping capabilities last week, causing downward pressure on butane and propane prices as export volumes were limited. As shipping ramps back up to normal levels, expect prices to rebound. Propane is also being pressured by inventory levels that are more than 20 MMbbl higher than this time last year because of very mild winter weather and, consequently, less heating demand. Ethane prices were flat on average from the previous week, although they opened higher last Monday and fell throughout the week with declines in natural gas.
- The EIA reported a draw in propane/propylene stocks for week ending Jan. 10, with inventories falling 947,000 bbl. Stocks now stand at 87.94 MMbbl, which is 20.44 MMbbl higher than during the same week in 2019 and 29.93 MMbbl higher than the same week in 2018.
SHIPPING
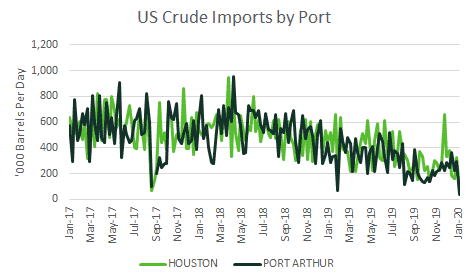
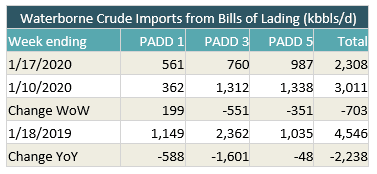
- US waterborne imports of crude oil fell for last week, according to Enverus’ analysis of manifests from US Customs and Border Patrol. As of today, aggregated data from customs manifests suggest that overall waterborne imports fell by more than 700,000 bbl/d compared with the previous week. The decrease was driven by a drop in imports to PADD 3 and PADD 5. PADD 3 imports fell by 551,000 bbl/d to 760,000 bbl/d, the lowest level observed to date. PADD 5 imports fell by 351,000 bbl/d while PADD 1 imports rose by nearly 200,000 bbl/d.
- Weekly imports to Houston averaged 72,000 bbl/d. That’s significantly below average and likely caused by fog, which resulted in closures along the Houston Ship Channel last week. Imports to Port Arthur were also much lower than normal, with fog closing the Sabine Neches waterway. The fog also impacted Freeport.