Click the image to explore Market Price Indices with our interactive experience.

With increased focus on fiscally responsible operations and more efficient teams across the industry, it has become more important than ever to streamline efforts and gain visibility into your spend in different markets. Traditional industry KPIs alone – the movement of permits, rig counts, the number of completions – can’t help you drive a fiscally sustainable supply chain strategy because they don’t inform you on pricing trends. Additionally, a blind or blanket discount strategy is no longer sustainable due to leaner teams and a stressed supplier market. Therefore, the need for a platform that streamlines supply chain management strategies and creates a win-win situation for buyers and suppliers has become crucial.
Stop flying blind
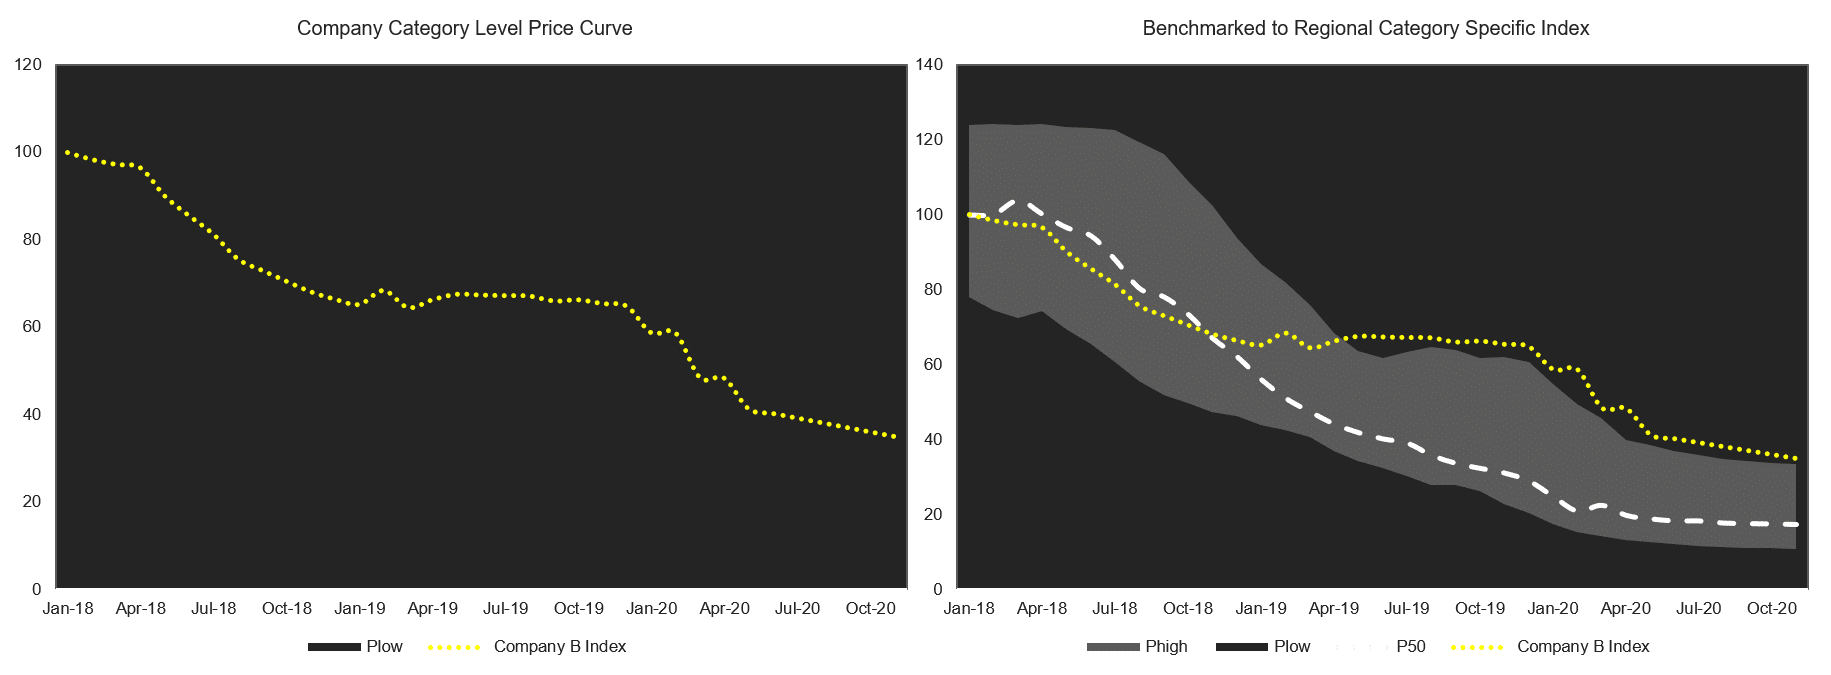
The example below demonstrates why the “blind” approach to supply chain strategy doesn’t work. When you only look at Company B’s price curve over two years (left), a price drop of 60% looks favorable. But data shows that the aggregated market price index dropped by 80% during this same period. The comparison of Company B’s prices with the market (right) demonstrates that there is room for additional cost savings, as it is still overspending compared to the market.
Single Company Category Level Price Curve Compared to a Category Level Market Index Price Curve
New Enverus Market Price Indices solve this problem by combining the nearly $200 billion of annual spend flowing through the OpenInvoice network with Enverus activity-based metrics. Now companies can compare their own pricing on various categories of goods or services to market indices in a specific region. Unlike other solutions that are based on assumptions and “black box” models, the indices are based on actual, anonymized, analytics-grade spend data that is frequently refreshed for the most current insights.
With these insights, buyers can see deviation from market trends, understand the economic impacts of pricing, uncover specific opportunities for additional cost savings, negotiate win-win agreements with suppliers and forecast future trends. This helps maximize the value generated from this analysis and also acts as a prescriptive system, driving strategies in poor performing areas.
Market Price Indices reveal opportunities and market signals for suppliers
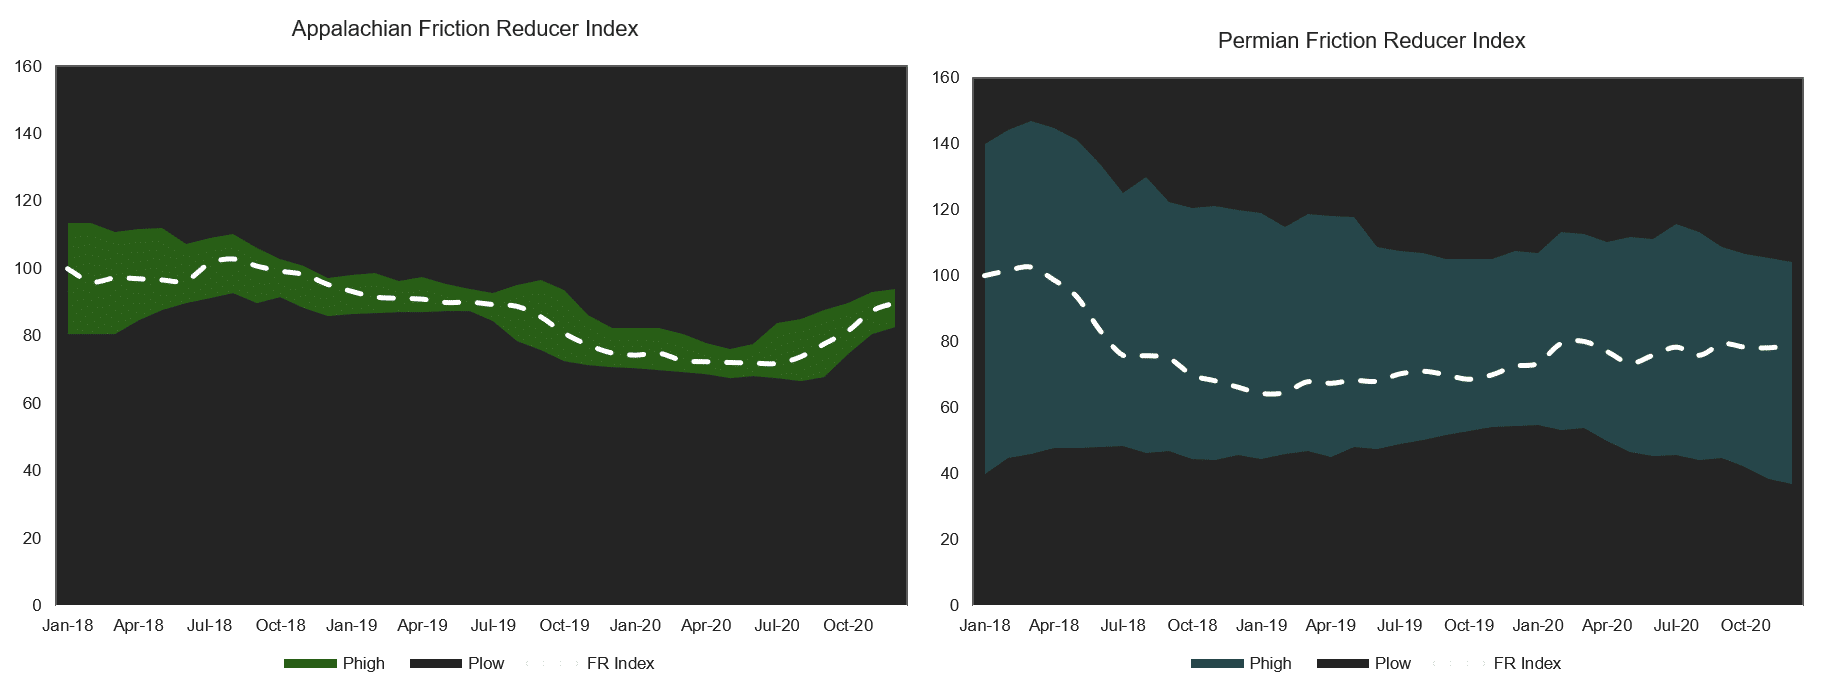
Accurately understanding market and pricing trends is not simply beneficial for buyers. Suppliers can gain significant competitive advantages by accurately understanding how trends are changing in an area. A market pricing comparison of friction reducers in the Permian Basin to the Appalachian Basin is a perfect example of how both buyers and suppliers can benefit from regional price trend analysis. The price variation in the Appalachian (left) is much smaller than the Permian. This is because, while both areas have high activity, Appalachia is a very tightly controlled market with fewer supplier options for downhole. The Appalachian market index indicates there may be additional opportunity for suppliers, compared to a market that might be oversaturated, like the Permian. For operators, the wider variation in the Permian price index indicates a potential opportunity to drive frac costs down while negotiating a win-win price agreement with suppliers.
Appalachian Friction Reducer Price Index Compared to the Permian Price Index
Leveraging market price indices is extremely important for both buyers and suppliers because current price strategy can have a huge influence on having a balanced perspective, now and in the future. Market Price Indices provide visibility into the impact of price changes on individual parts of complex services in different regions, making it much easier for buyers to find opportunities for balanced, sustainable cost savings and improve strategic sourcing. For suppliers, understanding how trends are evolving in various markets can reveal new business opportunities and signal market changes. Only Enverus can offer these unique insights. Because Market Price Indices are part of a centralized ecosystem, price analysis is easy and sustainable. Our world’s energy supply relies on buyers and suppliers working together with maximum efficiency to extract resources. Enverus is committed to providing insights that assist both sides to strengthen their business, while creating win-win working relationships that drive our industry forward.
About Enverus Market Price Indices
Enverus Market Price Indices compare your pricing to the market by region or basin, providing true visibility to specific company performance. With these insights, you discover your deviations from market trends, the economic impacts of your pricing, find specific opportunities for additional cost savings, and forecast future trends.
To learn more, contact businessdevelopment@enverus.com, or request a tour by filling out the form below.