Are you struggling to find substations with real injection potential? In this blog, you’ll learn how developers use planning models and historical ATC data in PRISM to identify viable POIs, avoid costly surprises in the queue and confidently move forward with high-potential projects.
First off, what is available transfer capacity (ATC)?
ATC refers to the remaining power transfer capability from a particular substation to the transmission network. It represents the maximum amount of power that can be transmitted over a transmission line without compromising grid reliability and stability.
Why is ATC important for power project and large load developers?
With the increasing demand for electric power and the integration of renewable energy into the U.S. power market, the process of adding new power to the grid and navigating interconnection has become more complex. Historically, fossil fuel plants have been built in centralized locations, simplifying interconnection to the grid. However, an influx of renewables as well as large load centers in the U.S. power market is resulting in a decentralized grid, creating a more complex interconnection process.
How does ATC impact injection studies during the interconnection process?
The rapid growth of renewable development has created a competitive landscape for developers seeking ideal project sites and interconnection points. During the lengthy study process to reach project interconnection, developers may incur significant costs to complete the process. To mitigate study costs, developers now seek ways to assess their projects’ impact on the grid early in the site selection process. Understanding the available capacity of substations within the grid is crucial for this purpose.
How can Enverus Power & Renewables ATC solutions help you with your injection study?
Enverus Power & Renewables offers ATC solutions to help developers screen for substations with available capacity early in the project siting process. Using the PRISM application, developers can track both planning case ATC values and historical state estimator ATC values from the ISO at the substation level to identify substations with feasible injection capabilities for their future power plants.
What is a planning case?
A planning case is a forward-looking model used by grid operators and planners to simulate future grid conditions under various scenarios. It incorporates assumptions about load growth, generation additions, retirements and transmission upgrades to evaluate how the power system might perform in a specific future year and season. These models help identify potential constraints, assess system reliability and guide infrastructure investment decisions. For developers, planning cases offer critical insights into where future injection capacity may exist, helping to inform site selection and project feasibility.
What is State Estimator ATC?
State Estimator (ATC) is a real-time or near-real-time measure of how much additional power can be transferred through the grid without violating operational limits. Derived from actual system conditions using state estimation tools, it reflects the dynamic nature of the grid, including current flows, outages and system constraints. Unlike planning cases, which are based on forecasts, State Estimator ATC provides a snapshot of the grid’s current flexibility. For developers, this data can reveal historical trends and operational bottlenecks, offering a practical perspective on how substations have performed over time.
Let’s take a look and see all this in action in PRISM
In ERCOT’s planning models, multiple scenarios across different seasons and year timeframes are built to assess future changes in the grid. Knowing how the ISO will judge projects in the interconnection process is crucial for developers who are attempting to find the least costly solutions to building projects.
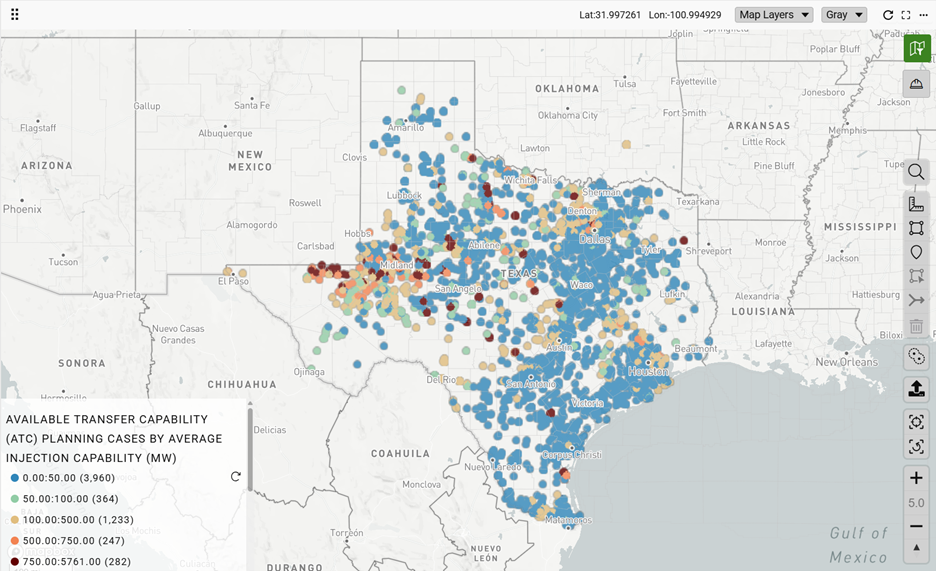
To start the screening process across all of Texas to find a potential point of interconnection (POI) with the capacity to support new projects, developers will focus on the worst-case scenario which is likely the High Peak Load Summer five to six years out. Figure 1 depicts the expected injection capacity across all 345kv+ buses in ERCOT in a high peak load scenario in the summer of 2031.
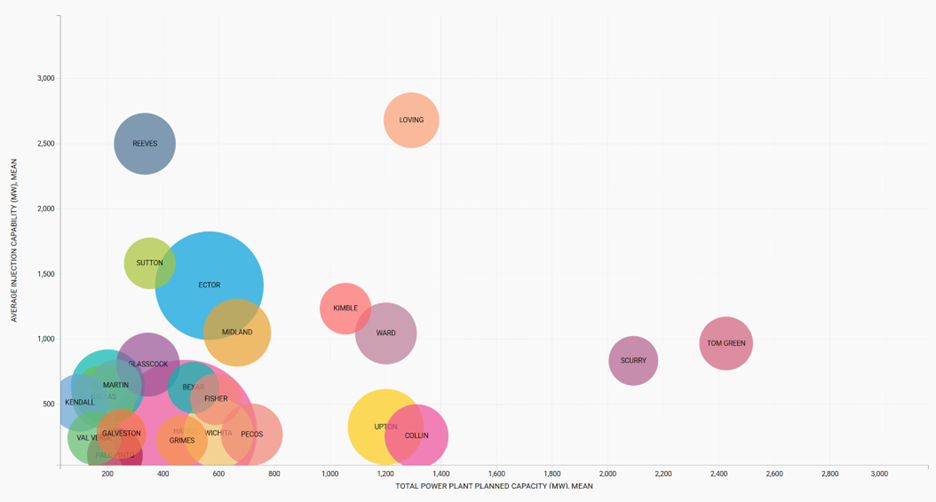
The ERCOT planning models include a multitude of assumptions about the future state of the grid including the assumption that all power plants with an interconnection agreement in ERCOT will be operational by the given timeframe. Developers know that there is a lot ahead of them in the queue, which includes many projects that will reach commercial operations, and a few that will successfully provide power to the grid. In assessing the planning case outputs, it’s necessary to also consider, outside of just the projects in an Interconnection Agreement stage, what other capacity is planned at a point of interest. Figure 2 compares the Injection Capability in MWs to the total planned capacity by county in this high peak load summer 2031 planning model. Counties like Tom Green and Scurry may show relatively high injection capability values, but the amount of capacity ahead in the queue may deter a developer from considering these areas for future interconnection.
There are two 345 kV substations located in Reeves and Sutton counties that, according to the Summer 2031 peak load planning model, each have over 1,000 MW of potential injection capacity. However, both currently have less than 400 MW of total planned capacity. This suggests that these substations could support large-scale solar or wind projects, especially given the relatively low capacity already ahead of them in the interconnection queue.
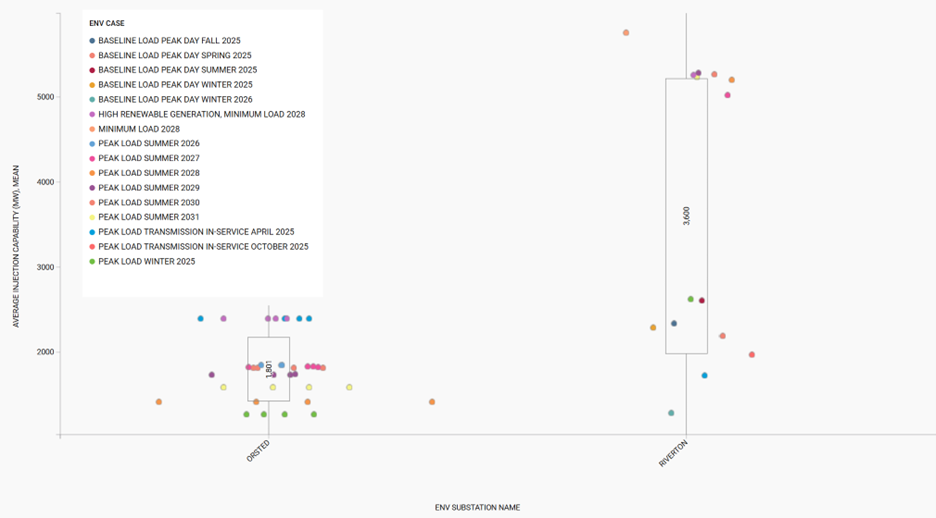
While the ISO is likely to evaluate projects based on worst-case scenarios, it’s also important to consider the full range of potential capacity at each substation across different planning models. If a substation is overloaded in any scenario, it indicates that certain grid conditions could prevent additional injection without requiring significant grid upgrades.
Figure 3 illustrates the variation in injection capacity across all modeled scenarios in the ERCOT 2025 planning model. For example, Orsted shows a relatively narrow range of injection values across scenarios, whereas the Riverton substation exhibits a much wider range from approximately 1,300 MW to more than 5,000 MW, highlighting the variability and potential uncertainty in available capacity.
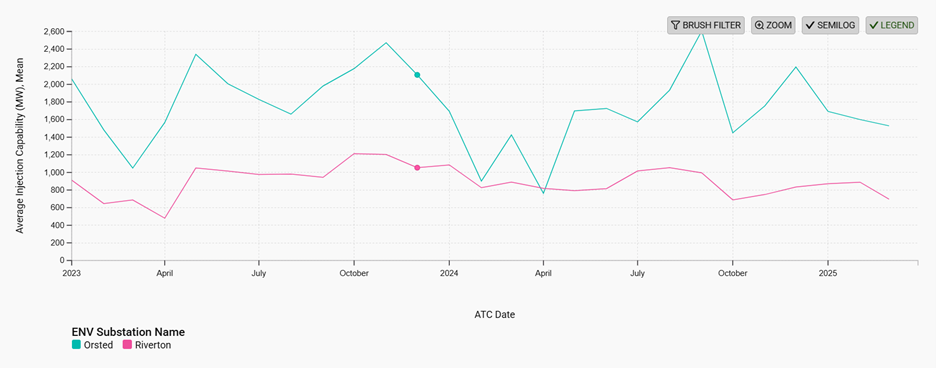
Given the variability in potential injection capacity across different planning scenarios, developers may also want to examine historical trends at these substations. By leveraging the Historical (ATC) data available through PRISM, users can analyze the monthly average injection capacity over the past two years. This historical perspective can provide valuable context for understanding how each substation has performed under real-world conditions.
Figure 4 illustrates the injection capability over time for each substation, offering insight into seasonal patterns, consistency and potential constraints.
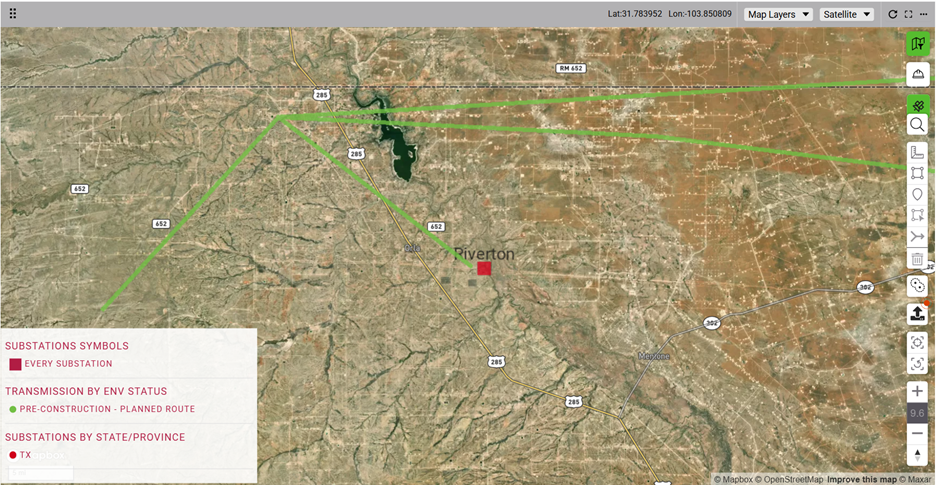
Interestingly, the historical injection capacity at both the Orsted and Riverton substations has been lower than the ranges projected in the planning models. Figure 5 highlights the actual routes of planned transmission lines, as digitized by the Enverus GIS team, which ERCOT has identified in its most recent planning model. While historical data may reflect limited injection capability, the addition of these new transmission lines is expected to enhance capacity in this region, potentially unlocking greater injection potential soon.
With a clearer understanding of the modeled injection capacity at key substations, developers can begin evaluating other critical project siting factors, such as land suitability, to advance their development plans. The modeled capacity provides confidence in exploring areas near the Riverton and Orsted substations for potential projects.
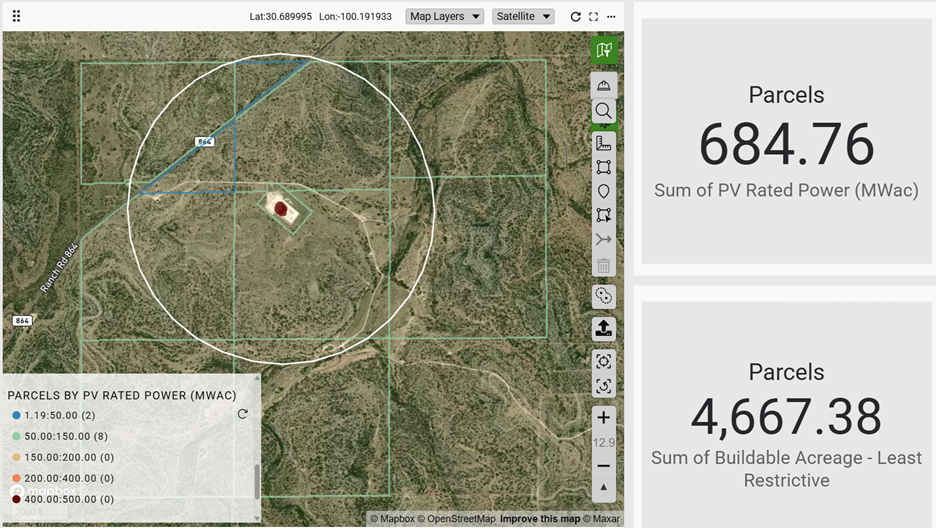
Focusing on a 1-mile radius around the Riverton substation, Figure 6 illustrates the total MWac of solar power that could be generated across all parcels within that area. This estimate is based on PRISM’s buildable acreage calculations, integrated with RatedPower’s design tools to model expected power output. The analysis suggests that this area could potentially generate nearly 685 MWac of solar power positioned near a substation modeled to support more than 1,000 MW of injection capacity even under worst-case grid conditions projected for 2031.
Ultimately, developers need to understand the available capacity to interconnect to the grid prior to other steps in their project siting process to ensure successful interconnection and reduce injection study costs and potential upgrade costs further down the line. PRISM assists developers in quickly finding substations with available capacity per ISO planning models and historical state estimator values, and subsequently the land to support projects around those sites.
About Enverus Power & Renewables
Enverus is the largest energy-only focused software company in the world. More than 6,000 businesses use our solutions, including more than 1,000 in electric power markets. Every day, 7,500+ users utilize our solutions to develop and design projects, manage the grid, trade power, and buy and sell assets.
Our differentiation stems from the fact that not all data and platforms are created equal. We collect and connect thousands of disparate, disorganized data sets to provide the most comprehensive analytics-ready data on power markets. We have a 25-year head start on the market and have made more than $200 million of acquisitions focused on power. We collect more data, cover more projects and provide value across more of the asset lifecycle than any competitor. We have invested more than $3 billion in our platform so we can deliver it all in the most modern and capable software platform custom built for energy.