IMPLEMENT STRUCTURED
SPEND MANAGEMENT

lap-top-analysis

To realize economies of scale, you also need holistic spend understanding across the newly formed company for more structured spend management.

In this chapter, we demonstrate why spend analytics are the key to an optimized supply chain and discuss specific examples of how to uncover pricing best practices through spend analysis to maximize cost savings.

DIFFERENCES IN TRANSACTION REPORTING MAKE SPEND UNDERSTANDING CHALLENGING

Historically, due to the way companies report transactions, apples-to-apples price analysis and price benchmarking is impossible because companies report transactions in completely different ways. The example below shows an example of different levels of granularity captured by the GL process. Company A (left) shows the type of commodity being used and how it’s being used. This is much more detailed than Company B (right).
gl_code-strcuture-company-2

NORMALIZED SPEND DATA: THE SECRET TO SPEND
UNDERSTANDING

The first step to gain spend understanding between two different organizations is normalizing the spend data of both companies so you can compare apples to apples. Recognizing this as an industry-wide issue, Enverus took the $200 billion per year in spend data flowing through OpenInvoice and normalized, categorized and attributed it in granular level detail, standardizing the process across the entire network. This means that Company A and B’s spend, irrespective of their disparate coding showed in the example above, would be properly categorized. 

In OpenInsights, the Enverus spend analytics solution, data is divided into:

  • Categories: Goods and services are divided into “buckets”. 
  • Attributes: Categories are divided into 40 million different attributes. This creates a data set that is much more usable and reliable.With OpenInsights, meaningful, actionable insights are a few clicks away. It’s this ease of use and speed of access that helps companies realize economies of scale faster.


Below is an example of categorized, attributed pipe data.

attributes

When two companies merge, the vendor network grows. The first chart below shows a view of Company A (left) and Company B’s supplier distribution (right) as seperate entities. The distribution indicates Company A and B both have fairly integrated supply chains. but Company B is more consolidated.

The second chart shows supplier distribution of the new entity when Company A and B are combined. These insights help companies use price analysis between suppliers to consolidate the supplier network and define preferred vendors.

Without this intelligence, the larger company or “acquirer” company’s supply chain management might prioritize their supplier relationships when the smaller company, or the acquired company, is getting much better prices on the same product. 

PRICE ANALYSIS EXAMPLES

Use Case 1: Vendor Consolidation

Supplier Distribution of Company A and B.

supplier-a-and-b-consolidation

Combined Supplier Distrubtion of Company A and B

Vendor consolidation isn’t just about choosing the lowest-cost provider because the cost that you’re paying a vendor for a product or service is a combination of the quality of the product and the services provided. Some companies are willing to pay extra over the price of the product because a supplier works seamlessly with them.

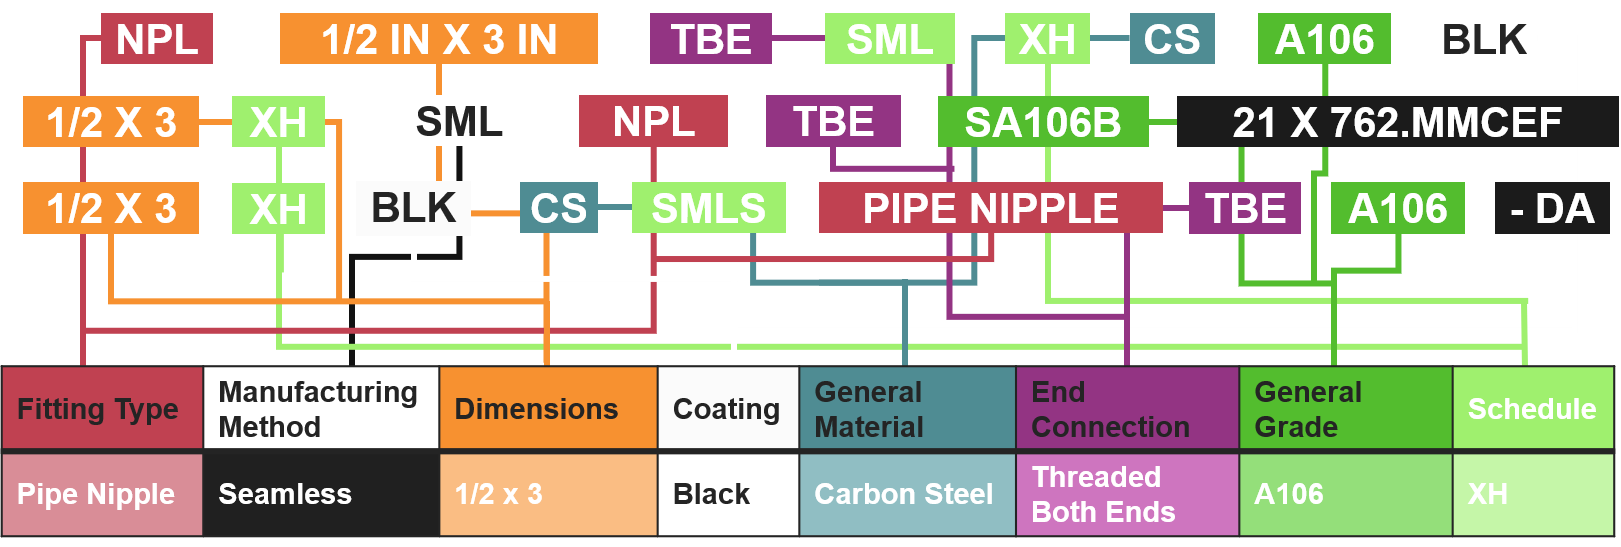
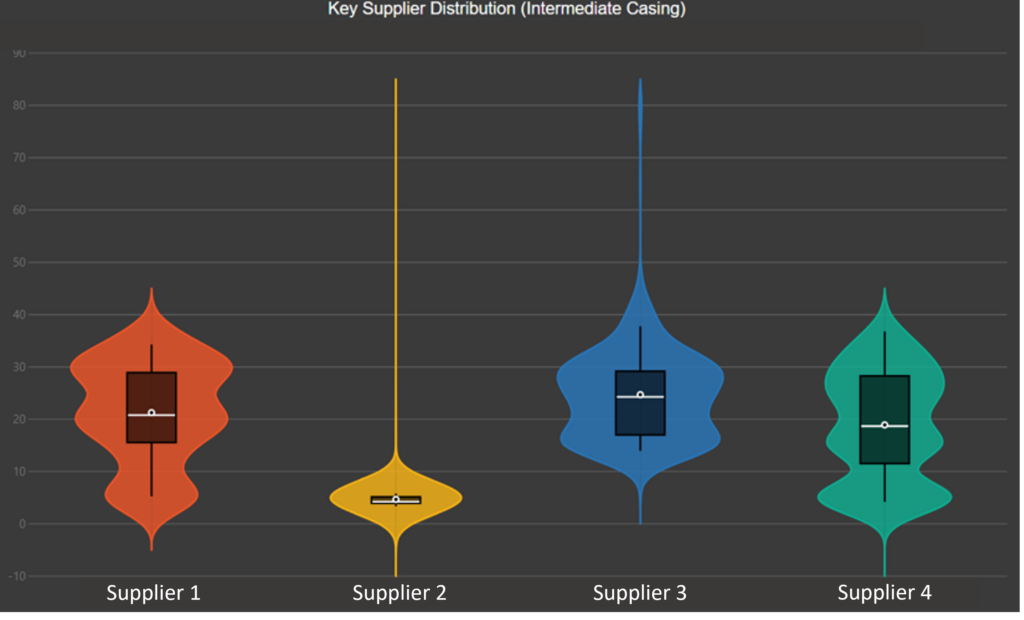
Using OpenInsights, the example below shows price distribution for intermediate casing with a combination of specific attributes, or a taxonomy, across four suppliers. There’s so many different properties that define a pipe–the grade, the weight, the range, the end connection, the material, the coating. If you select five and a half inch casing and try to look at the distribution of prices, it’s going to be a huge range. On the other end, if you go too specific, then you might not look at all of your pipes. 

Taxonomies in Openinsights are a powerful way to view price discrepancies because they leverage analytics and machine learning in-house to help operators find the variables they need.

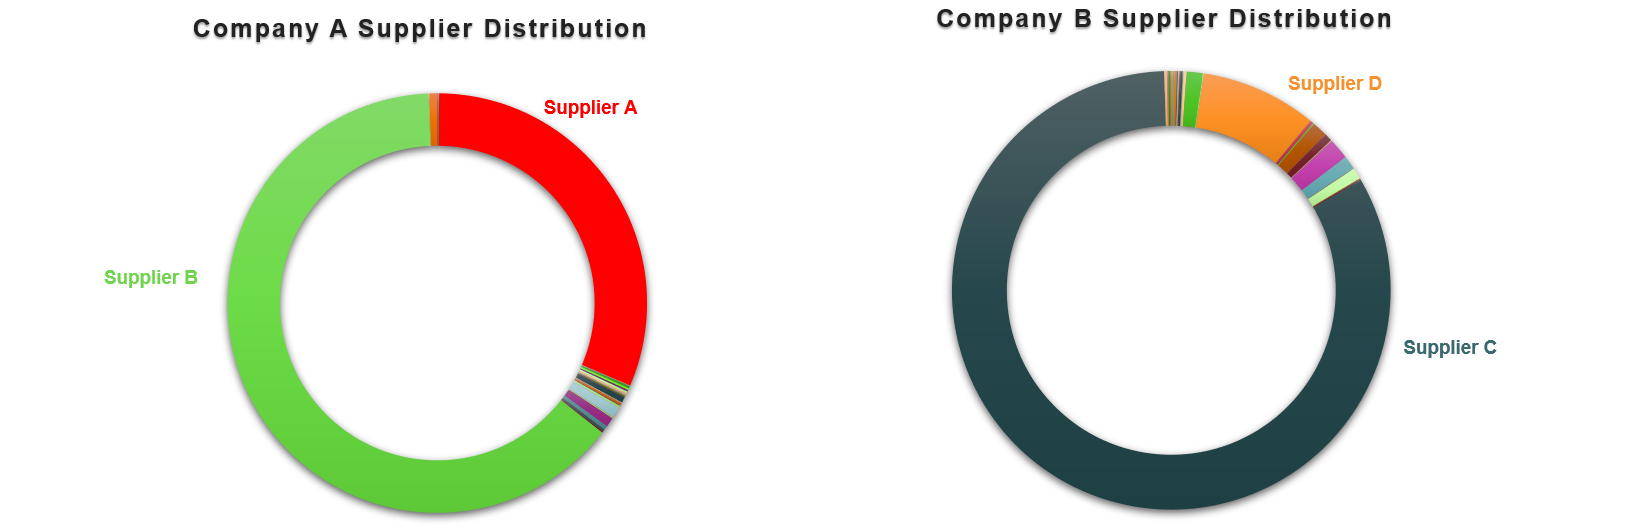
Note that Supplier 1 (red) and 4 (green)  are selling at three different prices. Supplier 3 (blue) is selling at two different prices and Supplier 2 (yellow) has the most consistent pricing for intermediate casing. Having a company with highly varied pricing isn’t ideal. You want to see much tighter price grouping, like that of Supplier 2.

Insights like these can help you choose preferred vendors and negotiate long-term contract pricing. 

Use Case 2: Select Preferred Vendors

price-rationalization-for-suppliers

Enverus also offers regional market price indices for every category—chemicals, proppant types, mesh sizes or OCTG. You can use these market indexes to gain an understanding how the two companies have performed in different categories compared to the market.

In Category A, the market price (white dotted line) is consistent. The variability zone (gray) is shrinking for this particular product. But Company A’s prices (red) started lower, similar to Company B (yellow), but then steadily increase. You might assume that Company B has better best practices and adopt this strategy across the board. But when we did the same analysis with Category B, Company A  (red) is more consistent. This shows there’s room to save money. Company A can negotiate lower pricing on Category A and Company B with Category B. 


Use Case 3: Determine Pricing Practices From Regional Price Indices

comparison-2

CONCLUSION

Identifying and realizing economies of scale, is almost impossible unless you have a much more structured, individualized supply chain process in place. Digitalization across your supply chain ecosystem allows for leveraging spend analytics to compare your spend to the rest of the market and really drive decision-making processes and help identify cost savings and strategies moving forward. Successful digitalization of processes across the spend team and providing spend analytics that are just a few clicks away, provides more successful M&A analysis and best practice evaluation.


READY TO UNLOCK SUPPLY CHAIN SPEND
INSIGHTS?

Let’s get started!

We’ll follow up right away to show you a quick product tour.

Let’s get started!

We’ll follow up right away to show you a quick product tour.

Register Today

Sign Up

Power Your Insights

Connect with an Expert

Access Product Tour

Speak to an Expert