A strategic workflow for understanding real runway around your assets.

For most midstream systems, the critical question is no longer how much infrastructure was built – it’s how long that infrastructure will generate durable volume.
Remaining well inventory is one of the most important inputs in midstream planning. System longevity, commercial negotiations, capital allocation, competitive positioning and M&A all depend on understanding what development remains around your assets.
Teams need clarity on:
Most organizations still rely on spreadsheets, shapefiles or static reports to answer these questions. Those views are outdated the moment they are created. Assumptions shift. Spacing evolves. Wells are drilled every day.
What midstream teams need instead is a dynamic, repeatable way to understand what is left around their systems and what that remaining runway is worth.
This guide outlines a proven workflow that creates a living view of remaining inventory around any midstream asset.
Using consistent inventory logic, economics and infrastructure attribution, this approach allows teams to:
The result is a clearer foundation for planning, commercial strategy and M&A conversations.
Asset-level clarity prevents basin-level overconfidence – a common source of capital misallocation.
Midstream decisions should start with the asset, not the basin.
Rather than beginning with a county or play boundary, this workflow centers the analysis on a specific gathering or transportation system. That system defines the footprint that matters.
By placing the asset at the center of the map, every question that follows is grounded in real infrastructure rather than abstract geography.
Why this matters: Decisions become asset-specific from the start, making the analysis immediately relevant to planning and commercial teams.
Not every well in the basin is relevant. Inventory only matters if it can realistically connect to your system.
A defined catchment area establishes the commercial boundary around an asset. This may be based on distance, terrain, historical tie-in behavior or internal commercial footprints.
Once defined, this catchment becomes the consistent lens for evaluating remaining inventory, economics and competition.
A map-based view makes this boundary visible and actionable.
Why this matters: The analysis now reflects how infrastructure is actually developed, not how basins are drawn.
Establishing a baseline view of remaining inventory is often the most time-consuming part of the process.
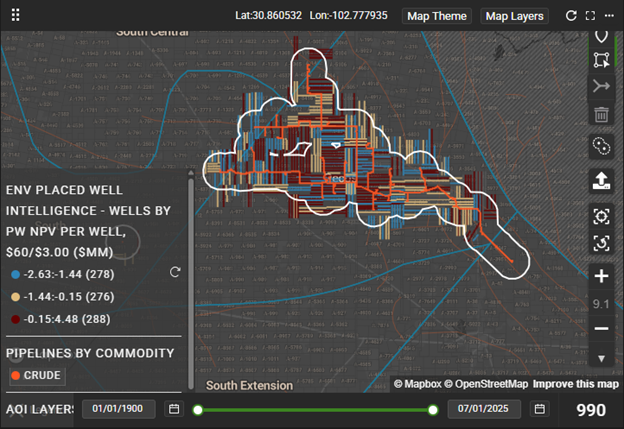
Automated analytics can quickly assemble this view by applying remaining inventory logic directly within the defined catchment. The resulting workspace typically includes:
This baseline provides immediate visibility into who controls the runway around your system.
Why this matters: Teams move from setup to insight quickly, allowing more time for interpretation and decision making.
Operator concentration risk directly impacts system stability and commercial leverage over time.
Most midstream conversations come down to two questions:
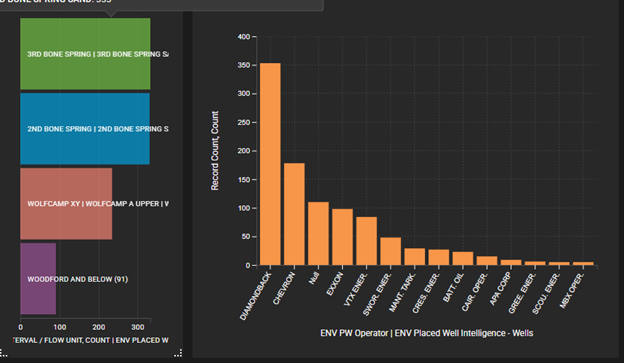
By organizing remaining inventory by operator and bench, teams can see how future development is likely to unfold around their assets.
This view reveals whether remaining activity is concentrated among a small number of operators or broadly distributed, and which benches will drive that activity.
Why this matters: Commercial and planning discussions become grounded in shared facts rather than assumptions.
Inventory that is technically drillable but economically marginal should not be valued as durable throughput.
Well count alone does not determine development order. Economics do.
Applying an economic lens to remaining inventory highlights:
This allows teams to move beyond “how much is left” to “what is likely to be developed.”
Why this matters: System longevity and volume timing can be evaluated under realistic economic conditions, not best-case assumptions.
Inventory shows opportunity. Throughput determines value.
Type curves allow teams to convert remaining locations into expected production profiles. When curves are built from comparable offset wells with similar spacing, intervals and operating practices, they provide a realistic view of how future wells will load a system.
Comparing profiles by operator and bench helps teams understand differences in early-time rates, decline behavior and cumulative volumes.
Why this matters: Future volumes can be discussed with confidence, supporting better planning and capital decisions.
Overestimating total basin inventory without understanding system-specific capture is one of the most common sources of midstream overconfidence.
This is where inventory analysis becomes commercial.
Remaining locations can be attributed to gathering systems based on existing infrastructure and connection patterns. This reveals:
This distinction is critical for understanding true system longevity and competitive position.
Why this matters: Teams can separate total opportunity in the area from the runway their system is actually positioned to capture.
A static inventory report informs a moment. A living inventory framework informs capital strategy.
The real value of this workflow comes from keeping it alive.
Saved as a reusable asset, the analysis updates automatically as wells are drilled, economics shift and inventory changes. The same structure can be duplicated across systems, ensuring consistency across the organization.
Over time, this becomes a trusted reference for planning cycles, commercial reviews and strategic discussions.
Why this matters: Inventory analysis evolves from a static report into an always-current decision tool.
Teams commonly use this approach to address questions such as:
Each question can be revisited using the same framework as conditions change.
A defensible view of remaining inventory is not just a planning tool – it is a strategic asset.
It determines which systems justify incremental capital, which assets warrant commercial defense, and where long-term volume durability truly exists.
By quantifying remaining inventory, attributing system capture, layering economics and translating runway into throughput, teams gain a clear, repeatable framework for decision making.
Inventory clarity allows midstream leaders to:
The result is more confident decision making across planning, commercial strategy and M&A.
Explore the workflow and see how a dynamic view of remaining inventory changes the conversation around your system’s runway.
Let’s get started!
Let’s get started!
We’ll follow up right away to show you a quick product tour.
Ready to Subscribe?
Ready to Get Started?
Ready to Subscribe?
Sign Up
Power Your Insights