Explore interconnection queue activity, utility strategies, and policy shifts shaping grid access and investment opportunities across ISOs
Research written by:
Enverus Intelligence Team
Investment advisory products and services provided by Enverus Intelligence® Research, Inc. Visit www.Enverus.com/disclosures for additional information.
Reviewed by:
Ryan Luther, Research Director, Enverus Intelligence® Research

To take advantage of federal tax credits, developers are accelerating solar deployments across all ISOs, while reliability driven market signals simultaneously drive gas and battery development.
Figure 1 | Queued Capacity and Status
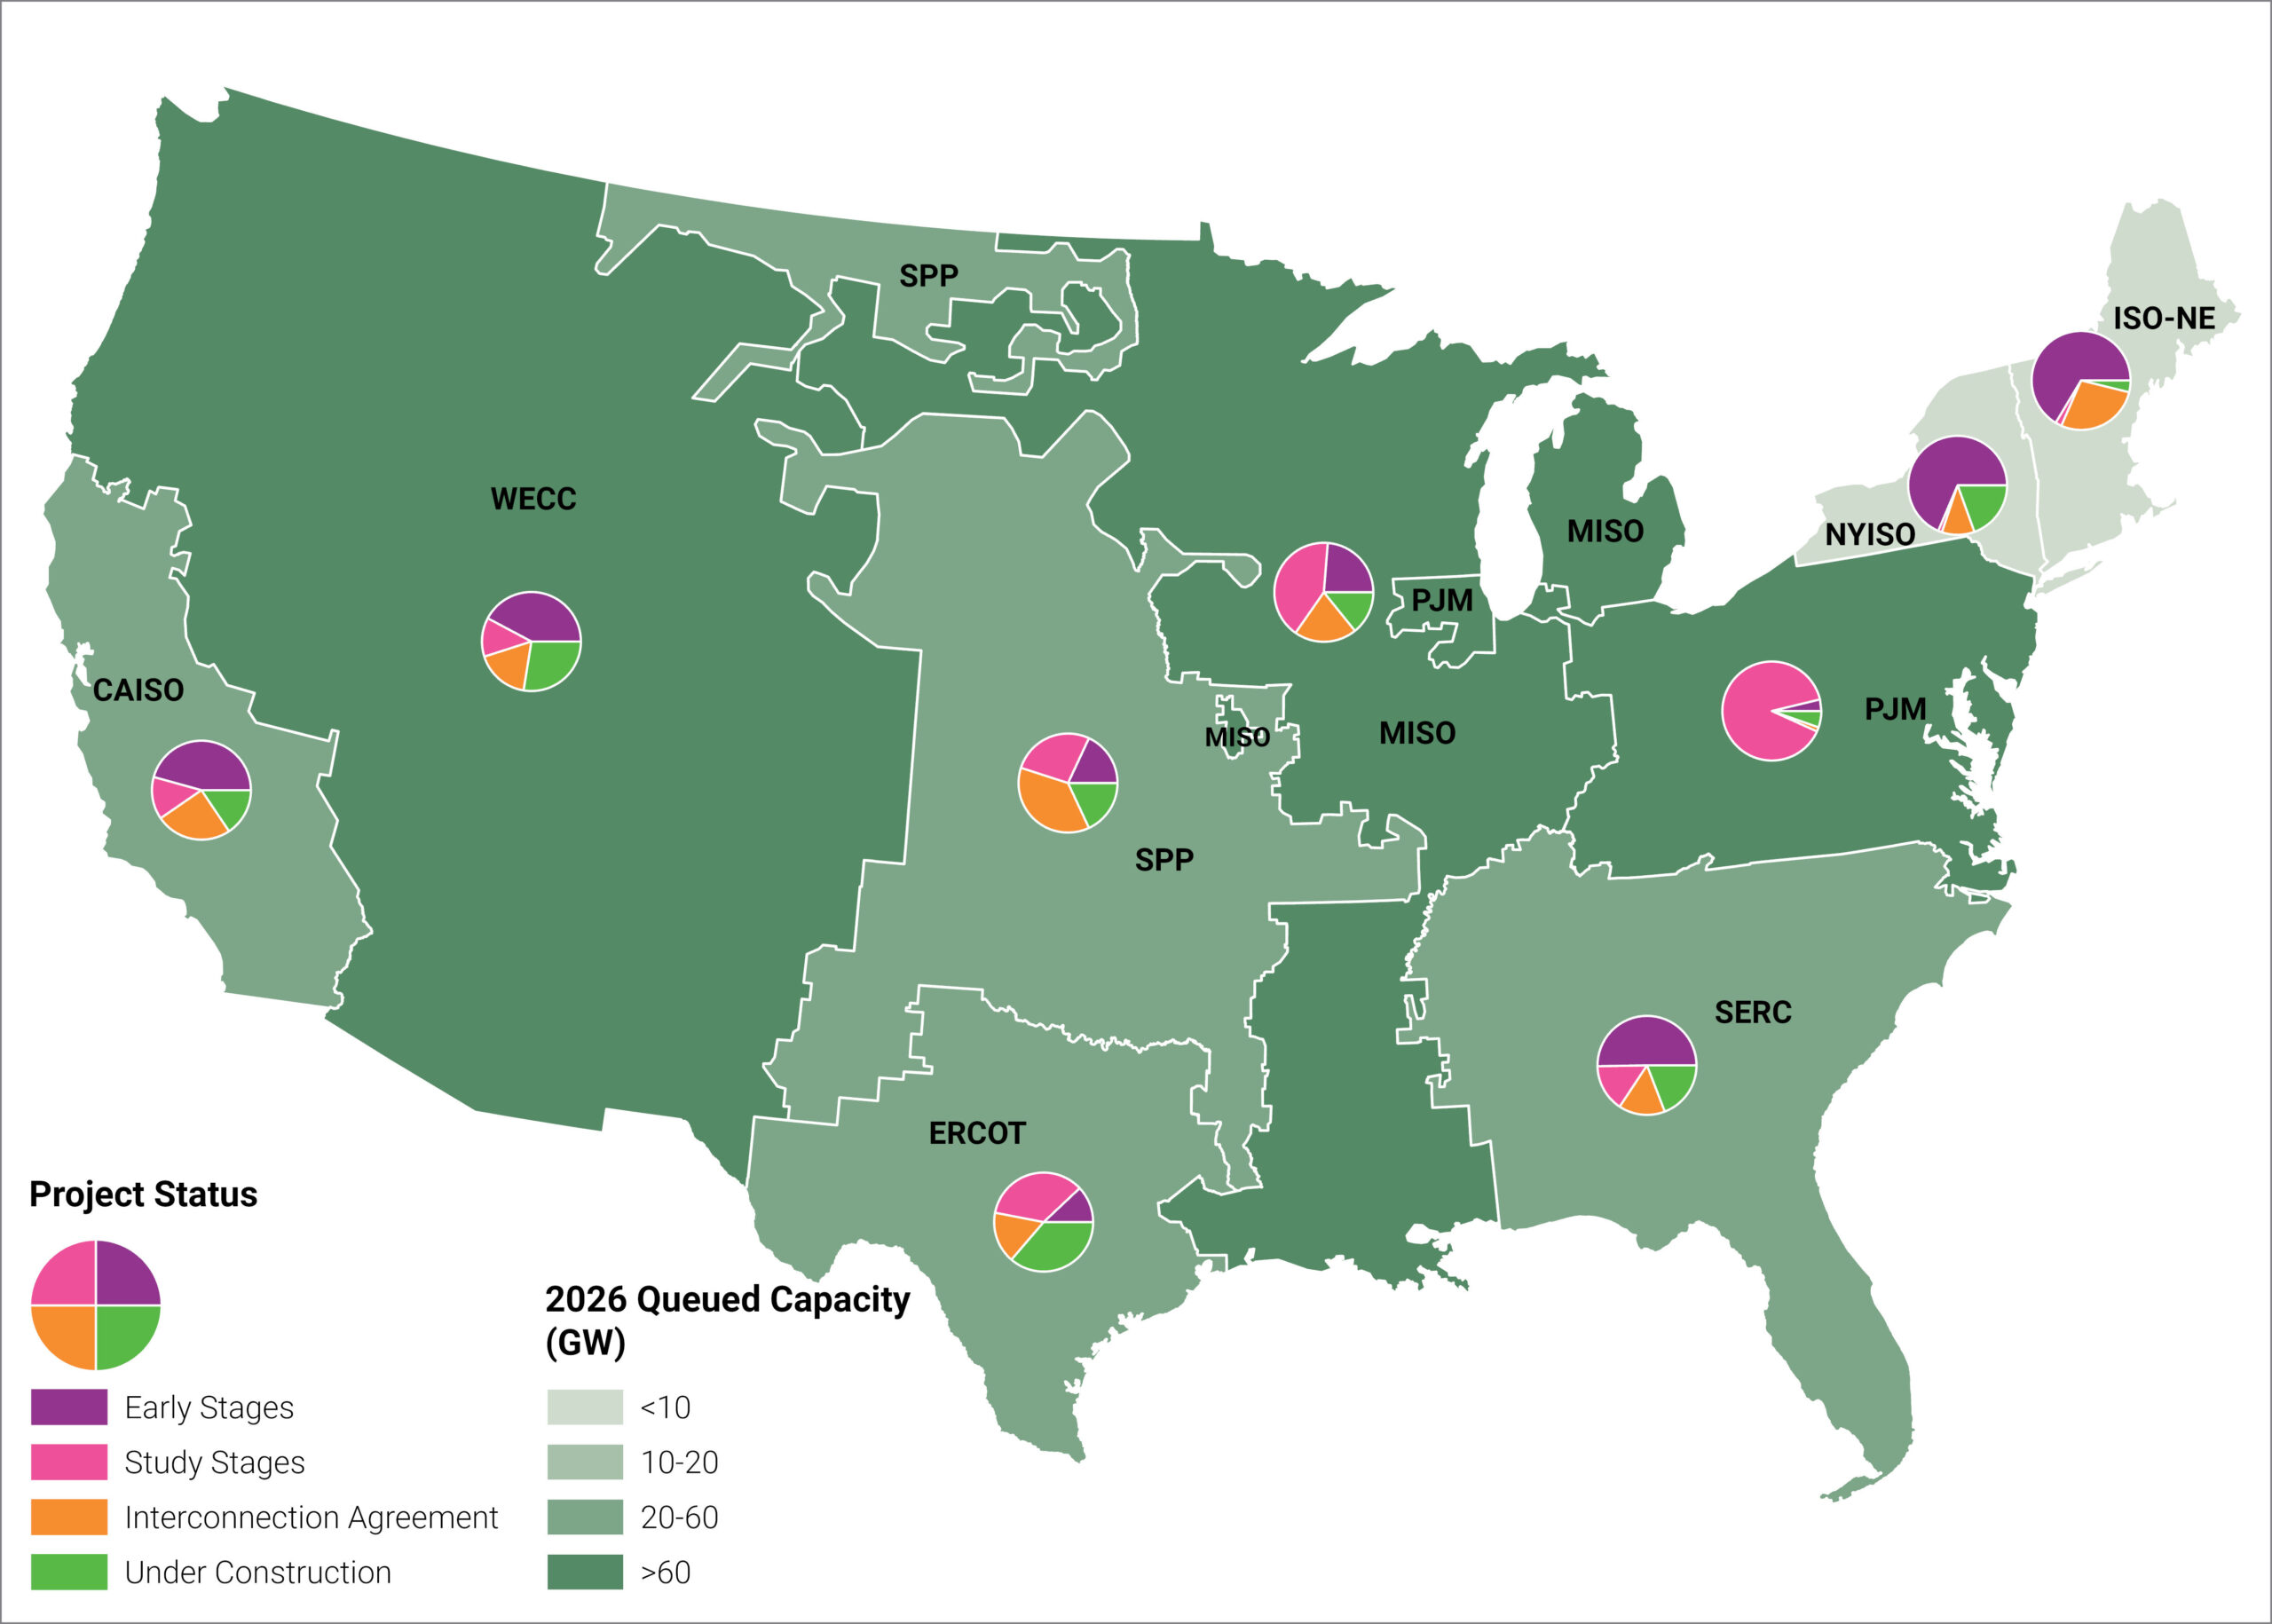
Source | Enverus Power & Renewables, Project Tracking Analytics
Expiring federal tax incentives, queue backlogs, and new reliability-focused policies accelerate solar and storage development in the short run while constraining longer-term renewable growth. Across ISOs, only a fraction of the hundreds of gigawatts targeting 2026 are likely to reach operation, with faster-moving regions like ERCOT contrasted by slower, transmission-constrained markets. We will see gas and batteries gaining strategic importance as grid reliability and large-load growth take center stage; however, supply chains and interconnection timelines will constrain how much front-of-the-meter gas generation can be added.
The passage of the One Big Beautiful Bill Act (OBBBA) in July of 2025 triggered the phase-out of Inflation Reduction Act (IRA) tax credits. While the IRA originally provided a long runway for renewables, the OBBBA requires wind and solar projects to be placed in service by December 31, 2027, to remain eligible for the PTC and ITC tax credits. Projects failing to demonstrate they have begun construction, using the physical work test or the 5% safe harbor, by July 4, 2026, or the 2027 service deadline will lose access to these federal incentives. ITC remains available for grid-scale batteries through 2036.
OBBBA is expected to have a two-phase impact on renewable development. In the near term, solar development is likely to accelerate as projects rush to meet safe harbor requirements; solar is projected to lead 2026 capacity additions and project counts across most U.S. regions (Figure 1). Over the longer term, however, renewable development is expected to decline more significantly as federal incentives diminish. In markets with Renewable Portfolio Standards, or in energy-constrained areas, these dynamics are likely to result in higher Power Purchase Agreement (PPA) prices and an increase in renewable projects paired with energy storage.
To see how OBBBA shifts are impacting project valuations and queue survival rates, you can explore detailed economic modeling and regional viability analysis in the reports linked below:
You must be an Enverus Intelligence® subscriber to access these reports.
Figure 2 | ISO Queue Planned and Operating Capacity
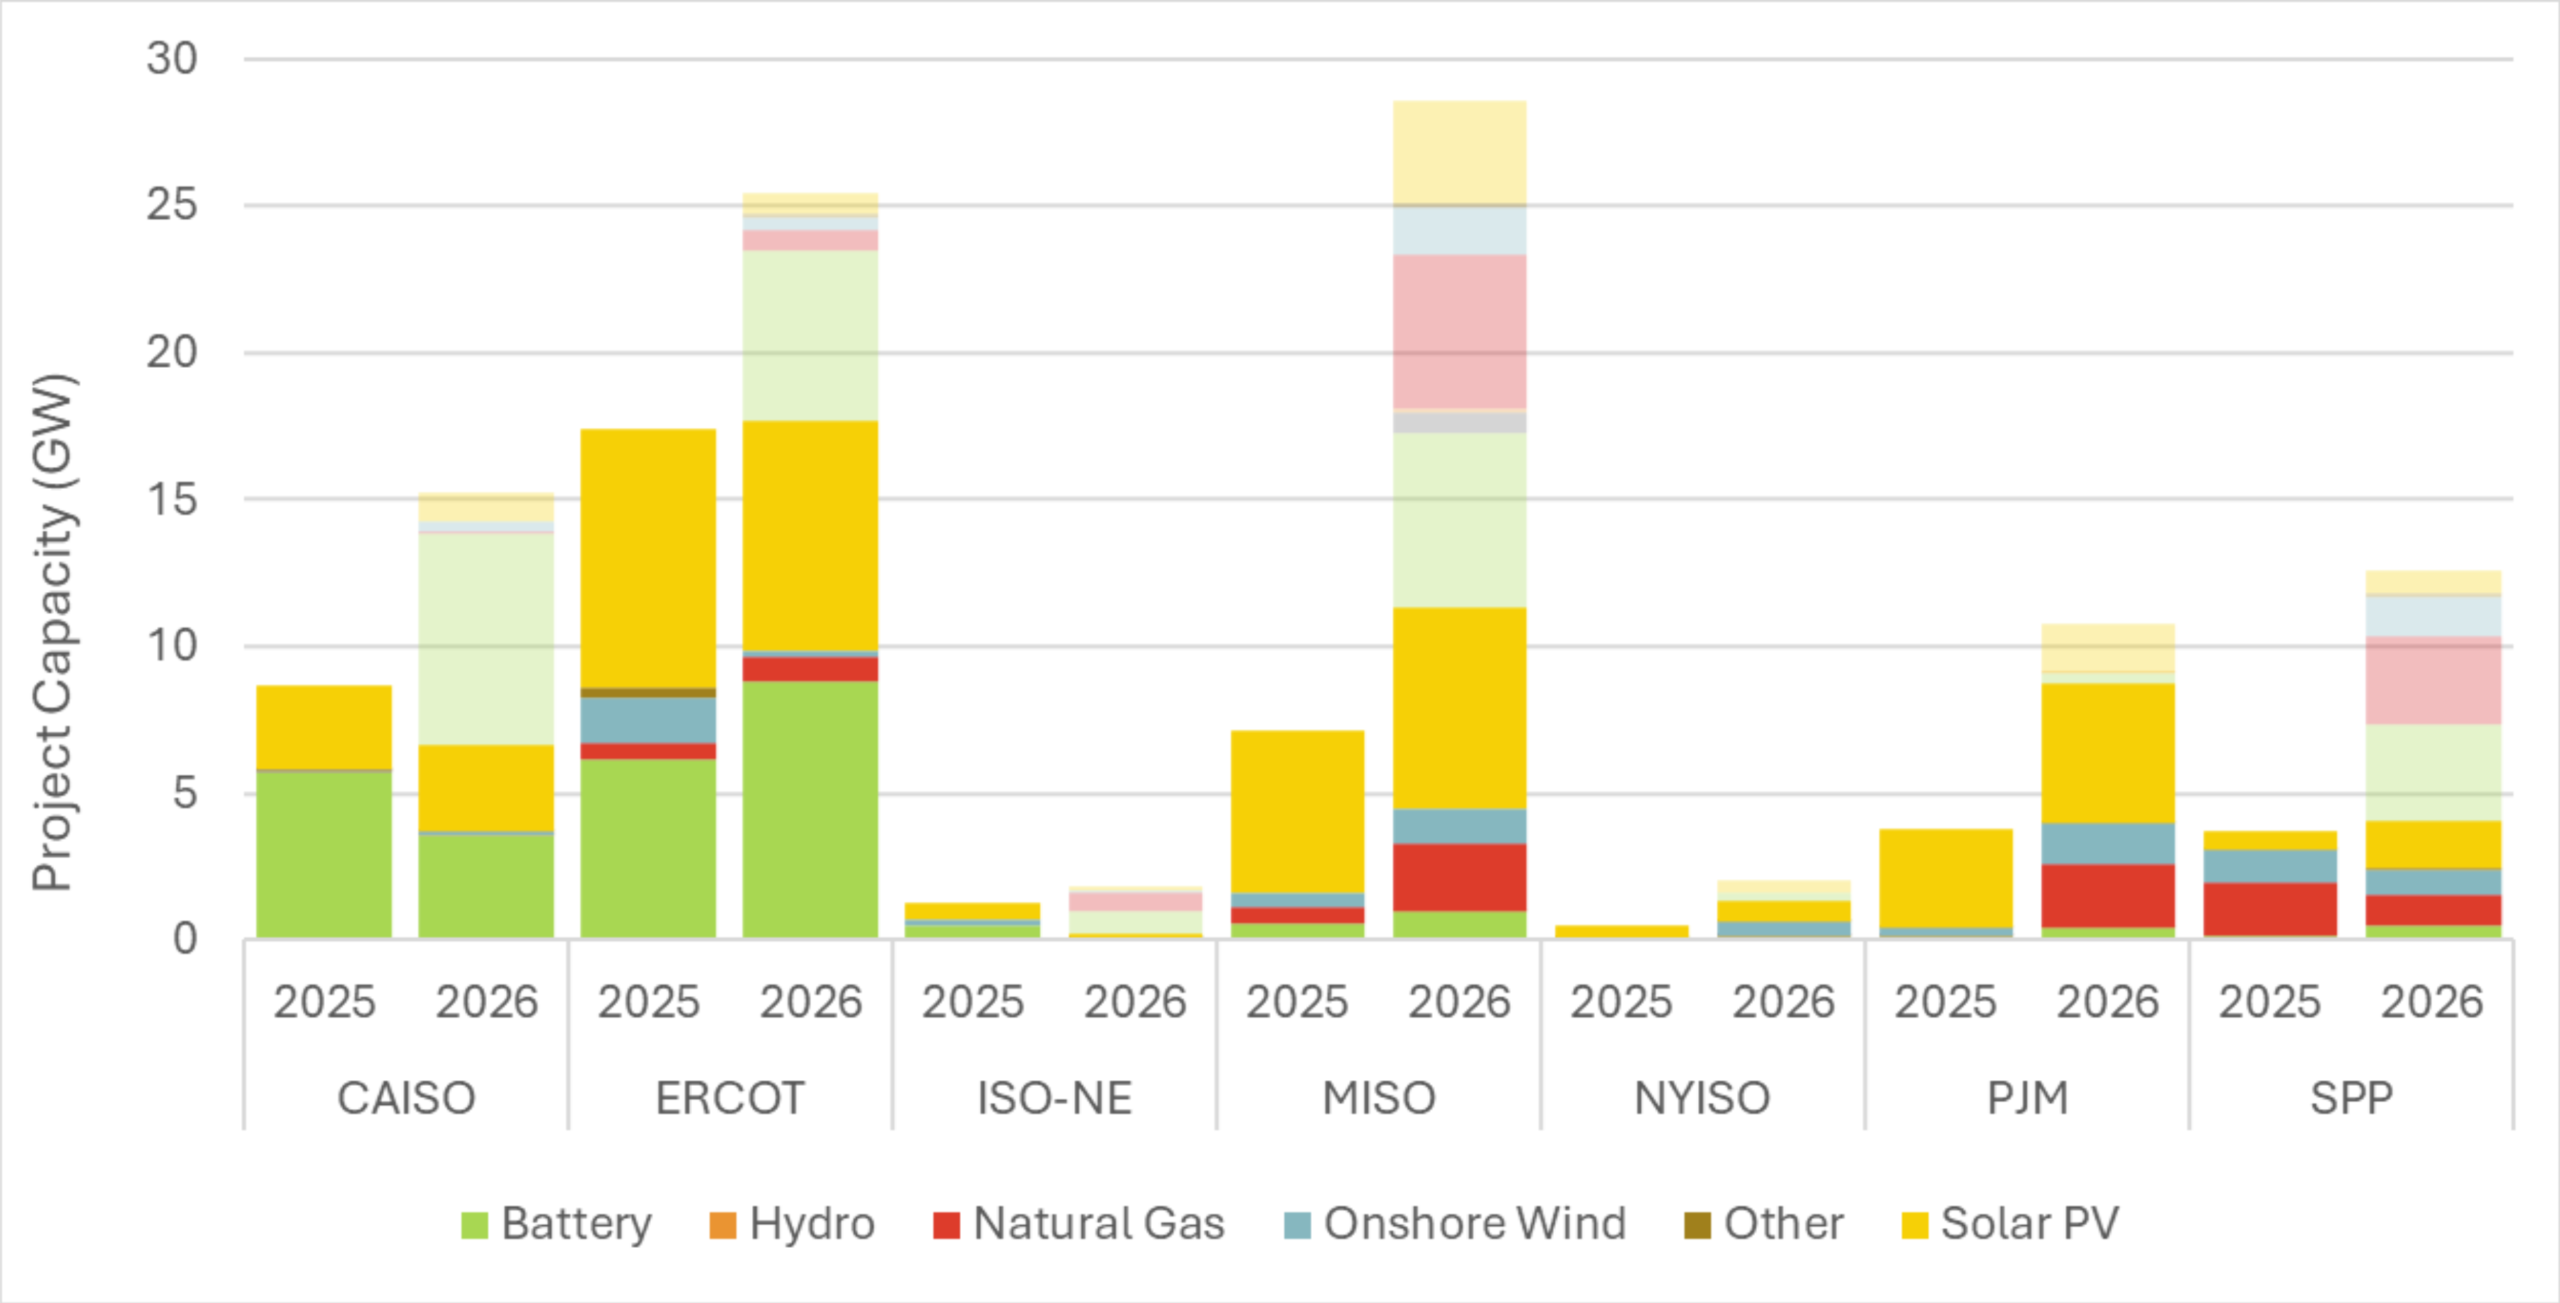
Source | Enverus Power & Renewables, Project Tracking Analytics
The shift in the energy landscape from renewable to dispatchable power is punctuated by Congress passing the Guaranteeing Reliability through the Interconnection of Dispatchable Power (GRID) Act in September of 2025. The Act is designed to address queue backlogs by mandating FERC to improve interconnection timelines with an emphasis on dispatchable generation when a clear reliability need is demonstrated. Similar processes in PJM (Reliability Resource Initiative), MISO (Expedited Resource Adequacy Study), and SPP (Expedited Resource Adequacy Study) demonstrate that natural gas and battery storage are well positioned for greater market penetration in the second half of the decade as renewable expansion slows.
Yet, these processes must also contend with the supply chain issues; a recent Enverus Intelligence Research (EIR) report anticipates that smaller generating units, such as aeroderivative turbines, reciprocating engines and fuel cells, and uprates/retrofits on existing facilities will be the main beneficiaries of these new queue reforms and processes until supply chain issues clear. As a result, natural gas additions in 2026 remain low compared to renewables, so new firm capacity will come primarily from battery storage.
The years 2022 through 2025 were defined by multi-year application pauses across the nation’s largest grid operators as they transitioned to the FERC-mandated “first-ready, first-served” cluster study model. PJM began reviewing their interconnection processes in 2021 and started transitioning to a new cluster-study model. CAISO postponed its application windows in both 2022 and 2024 to manage the backlog from Cluster 15. Meanwhile, both NYISO and ISO-NE concluded their old processes and dedicated 2025 to studying the massive “Transitional Cluster” of existing projects, effectively pausing new queue entries until their subsequent cluster windows open in future years.
Collectively, these queue transitions have driven a nationwide slowdown in new queue additions (Figure 2). When combined with extended queue timelines and the resulting reduction in solar and wind project viability due to expiring tax incentives, 2026 is likely to represent a low-point in new queue additions.
Figure 3 | Queue Capacity Additions by Year and ISO
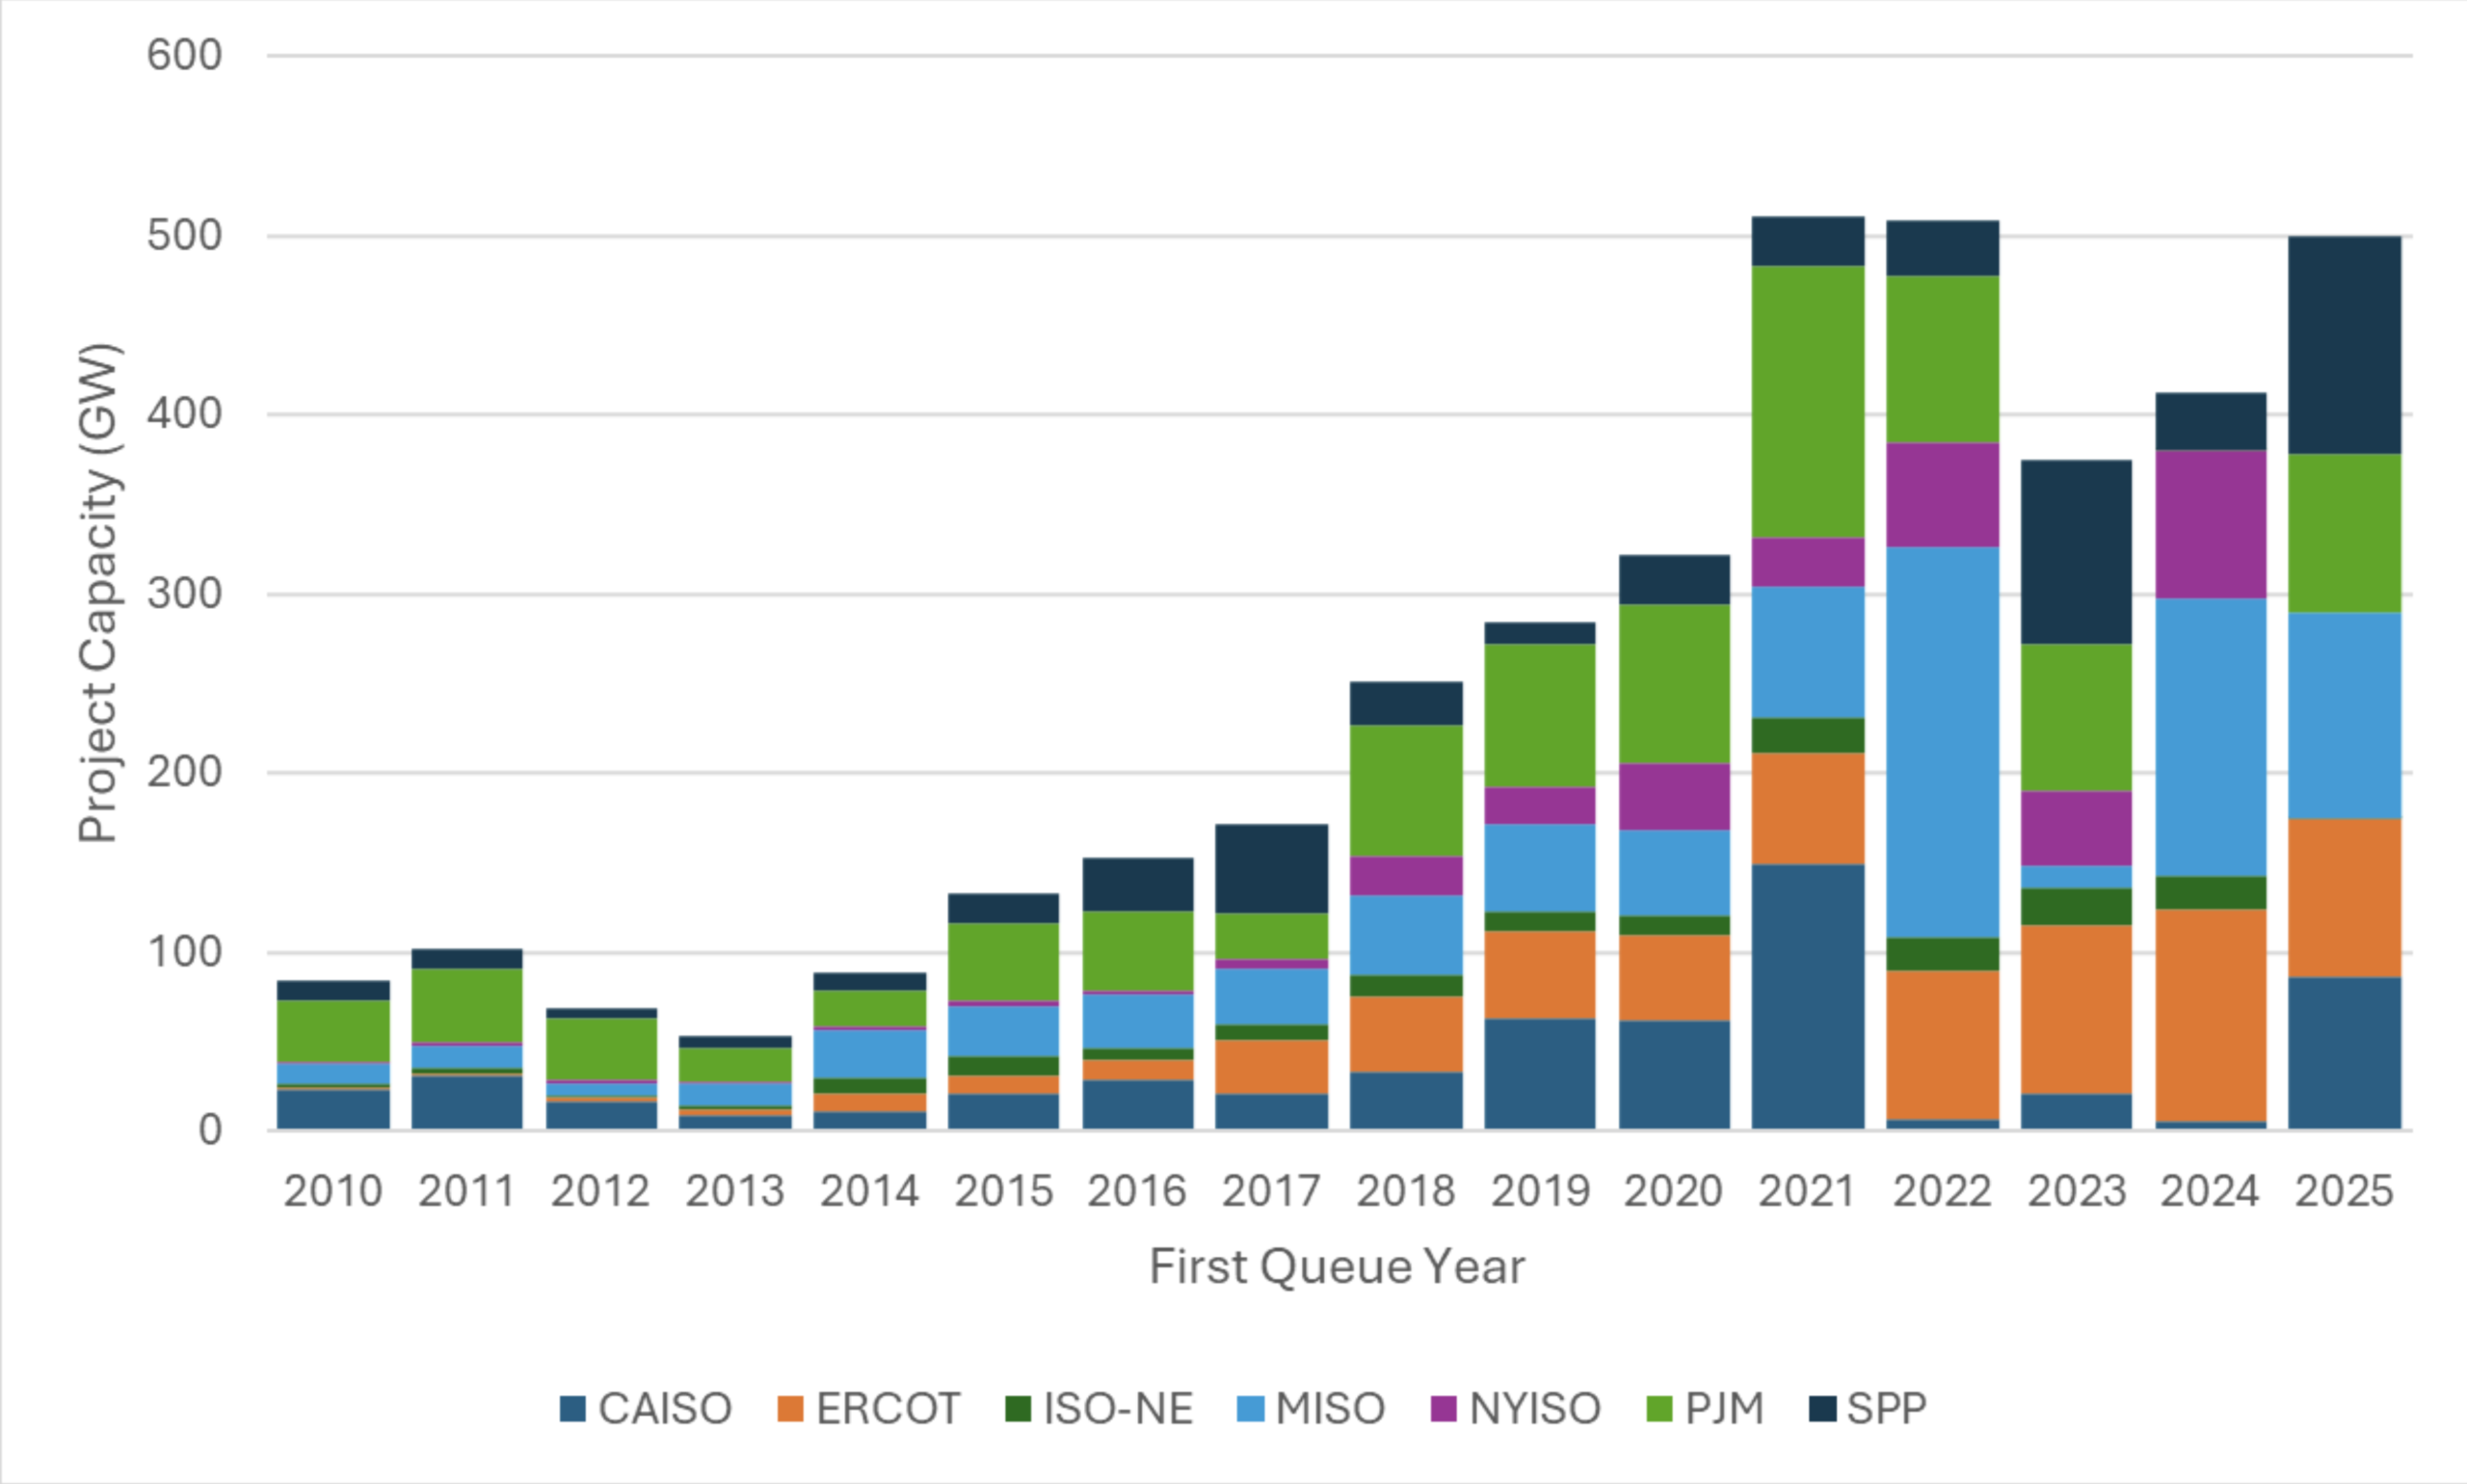
Source | Enverus Power & Renewables, Project Tracking Analytics
Nearly 600 GW of projects are slated for a 2026 first power date (Figure 3). However, projects that have not secured an interconnection agreement are unlikely to reach commercial operation within the year. Excluding these projects, we estimate that the 95 GW currently under construction are the most likely to come online in 2026, which is nearly double the 2025 additions.
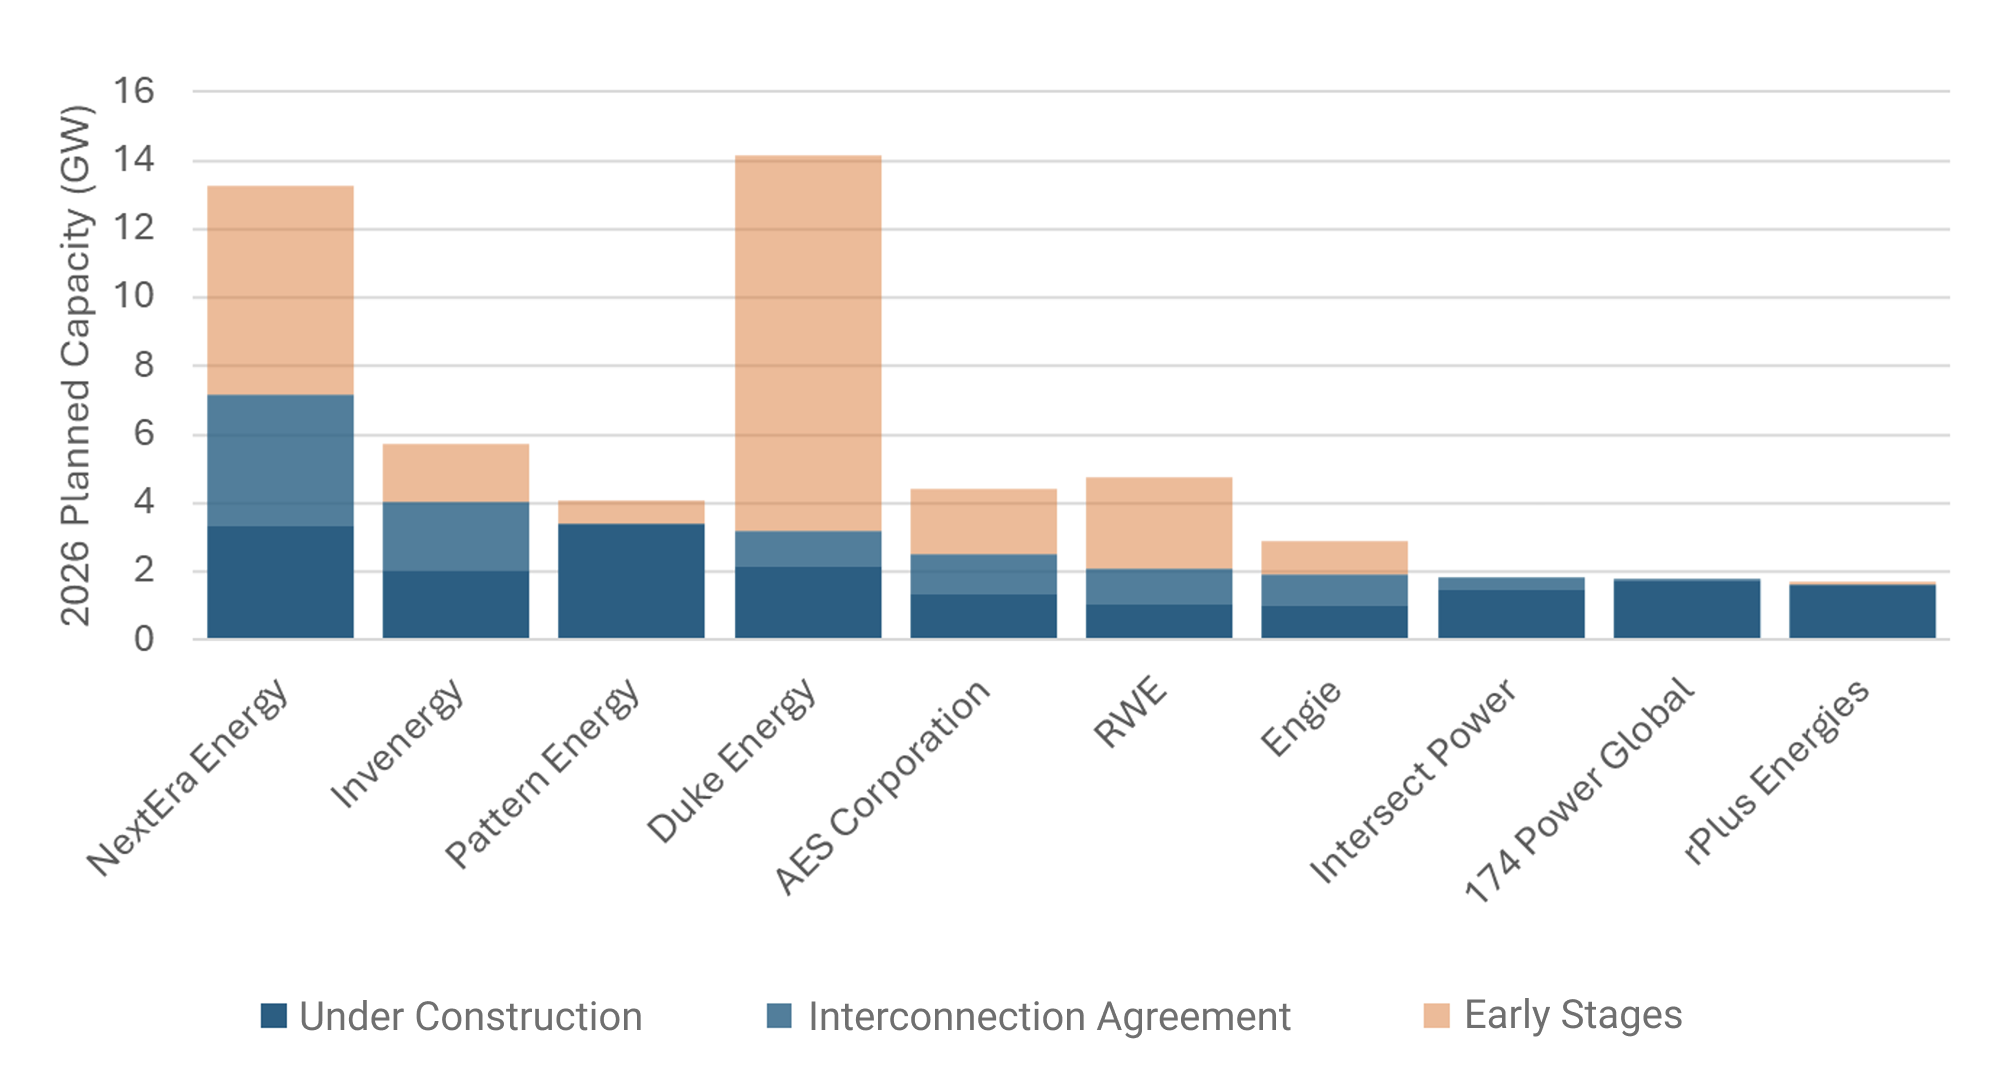
Figure 4 | First Power Date of Queued Capacity by Status
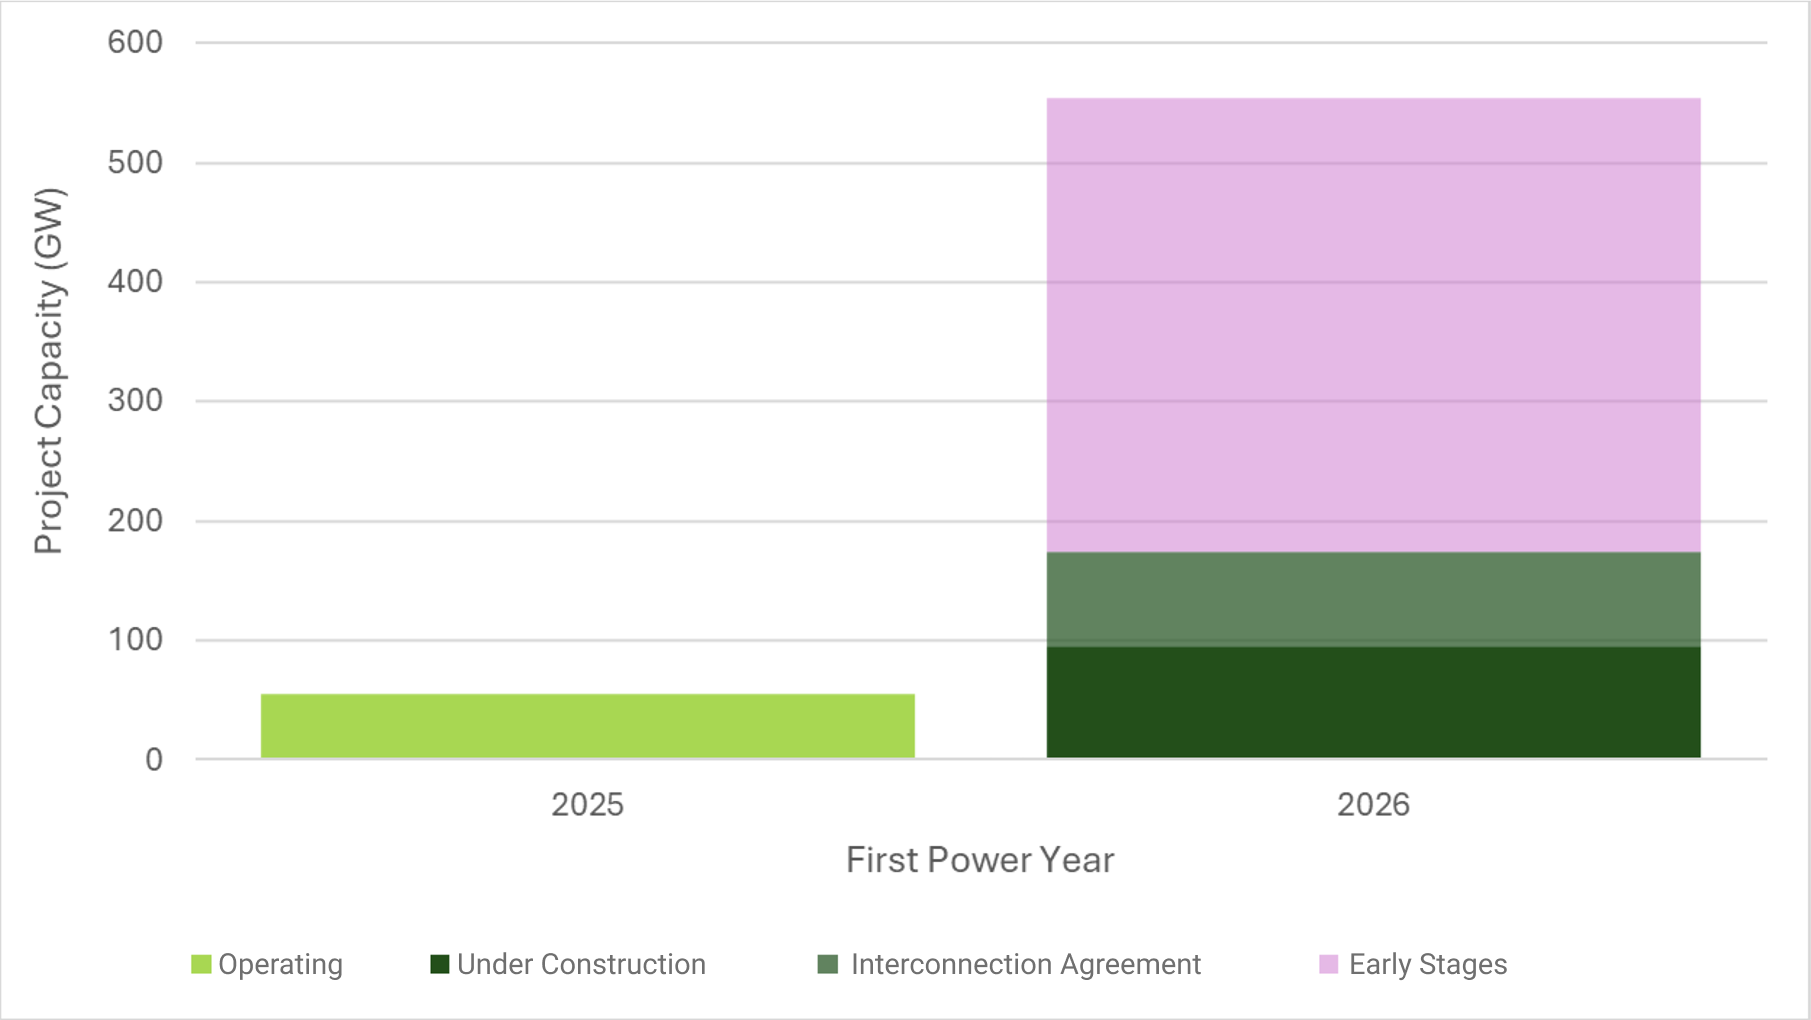
Source | Enverus Power & Renewables, Project Tracking Analytics
A similar pattern emerges at the developer level. NextEra has the largest volume of queued capacity targeting commercial operation in 2026, totaling around 13 GW (Figure 4). However, based on project maturity, we estimate that only around 3.3 to 7.1 GW of this capacity will come online in 2026. In contrast, Pattern Energy leads in under construction (high-likelihood) capacity at 3.4 GW, followed by NextEra Energy (3.3 GW) and Duke Energy (2.2 GW).
Figure 5 | Top 2026 Queued Capacity Developers
Source | Enverus Power & Renewables, Project Tracking Analytics
ERCOT remains the quickest region to advance projects through the interconnection queue, with an average timeline of 2.9 years for projects that reached construction in 2025. In contrast, CAISO and NYISO experienced lengthened timelines, with an average duration of over 7 years to construction each. Across the contiguous U.S., projects that reach construction or commercial operation in 2025 spent an average of 4.9 years in the queue.
Queue durations varied substantially by project type, with wind projects exhibiting the longest average timelines of 8 years and gas-fired generation the shortest at 3.4 years.
For projects with a 2026 first power date, 172 GW are in an early stage of the queue before clearing any studies, 291 GW are in the study stage, and 99 GW are currently under construction.
This report utilizes PRISM, our advanced analytics platform, to deliver in-depth insights into interconnection queues across various ISOs and utilities. As the leading energy-focused software company globally with more than 25 years of expertise, Enverus is trusted by more than 6,000 businesses to enhance decisionmaking capabilities, improve operational efficiency and secure competitive advantages in the dynamic power and renewables market.
Below, you will find a detailed list of the charts and graphs included in this e-book. Each entry includes a definition and an explanation of how the data was extracted using PRISM.
Enverus Intelligence® | Research, Inc. (EIR) is a subsidiary of Enverus that publishes energy-sector research focused on the oil, natural gas and power and renewable industries. EIR publishes reports including asset and company valuations, resource assessments, technical evaluations and macro-economic forecasts and helps make intelligent connections for energy industry participants, service companies and capital providers worldwide.
Enverus is the leading energy-focused software company globally, serving more than 6,000 businesses, including more than 1,000 players in the electric power markets. Each day, more than 7,500 users rely on our platform to drive decision-making in project development, grid management, power trading and asset management. Our advanced data integration sets us apart, transforming complex and scattered datasets into the most detailed, analytics-ready information on power markets.
With a legacy spanning more than 25 years and backed by strategic acquisitions totaling more than $200 million in the power sector, Enverus delivers unmatched insights through a state-of-the-art software platform. Our commitment to innovation is underscored by a $3 billion investment, ensuring we offer the most modern and effective solutions tailored for the energy industry’s dynamics.
Figure 6 | The Enverus Advantage
In 2025, renewable projects developed by Enverus clients outperformed the market showing:
Higher Buildability
Greater Injection Capacity
Lower Suspension Risk
Faster Interconnection
Source | Enverus Power & Renewables, Project Tracking Analytics
Build on the insights from this interconnection queue outlook with project siting strategies that will help you advance higher quality projects with confidence.
ISO Overview:
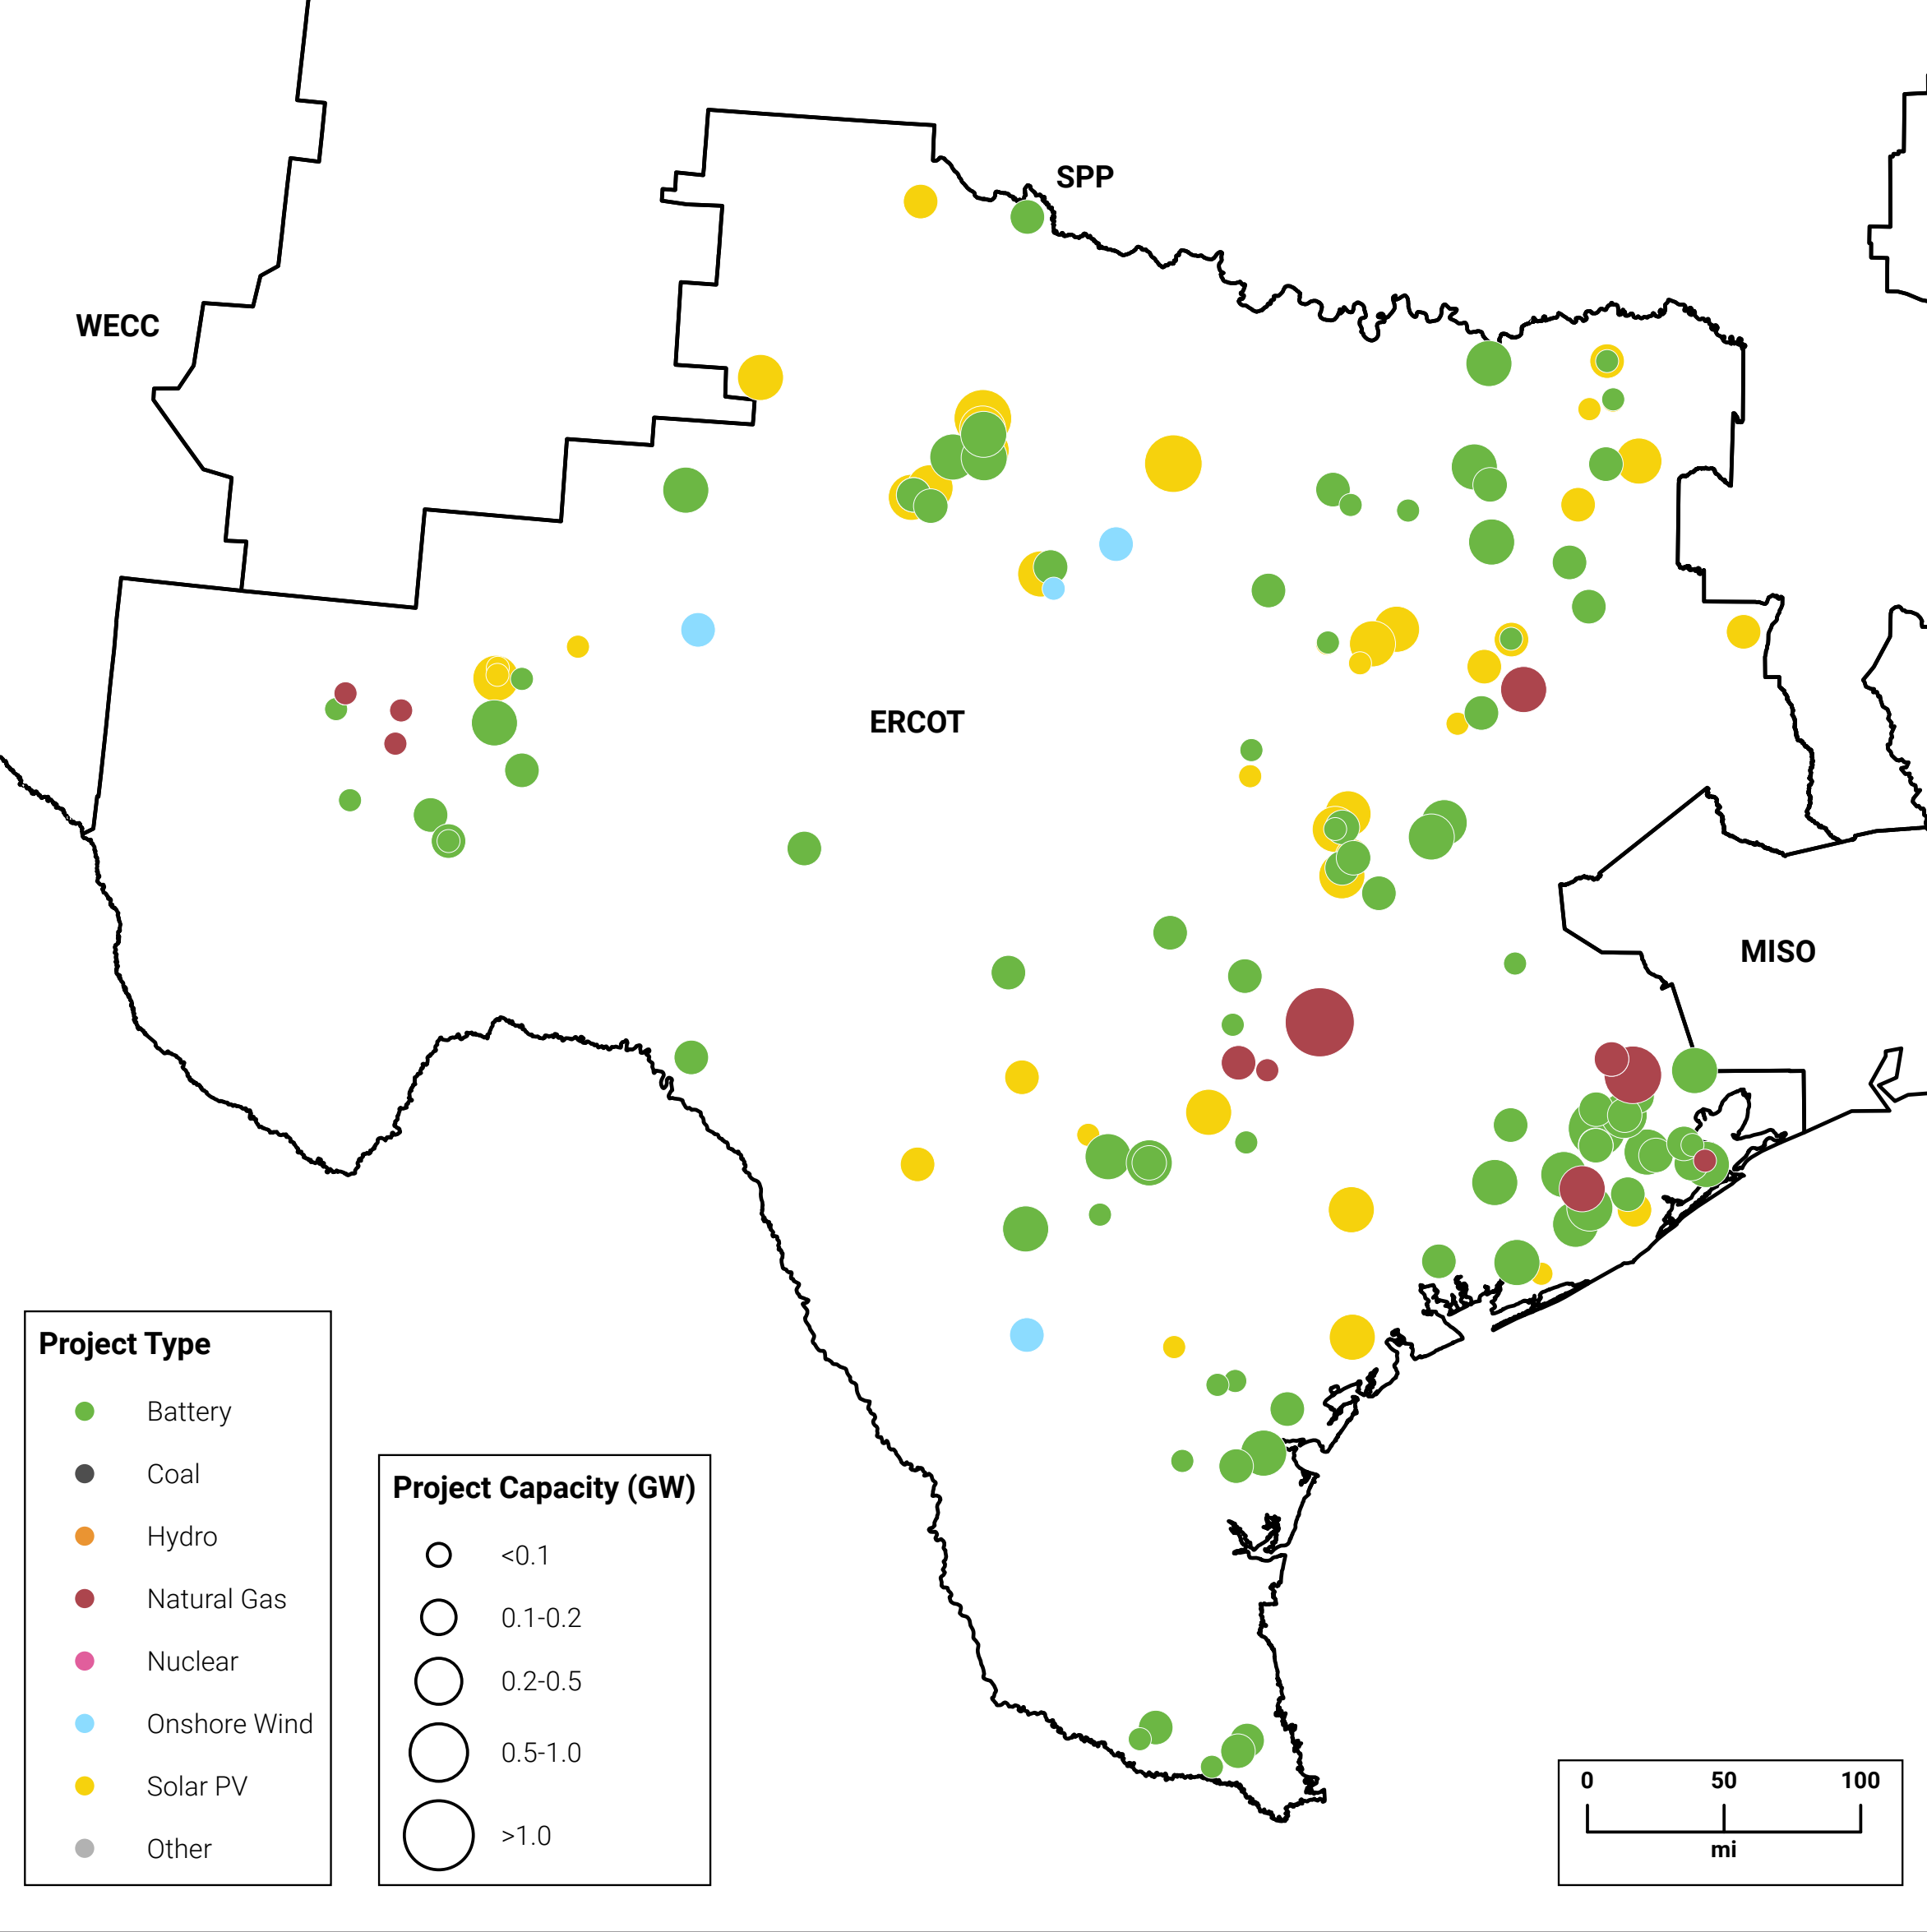
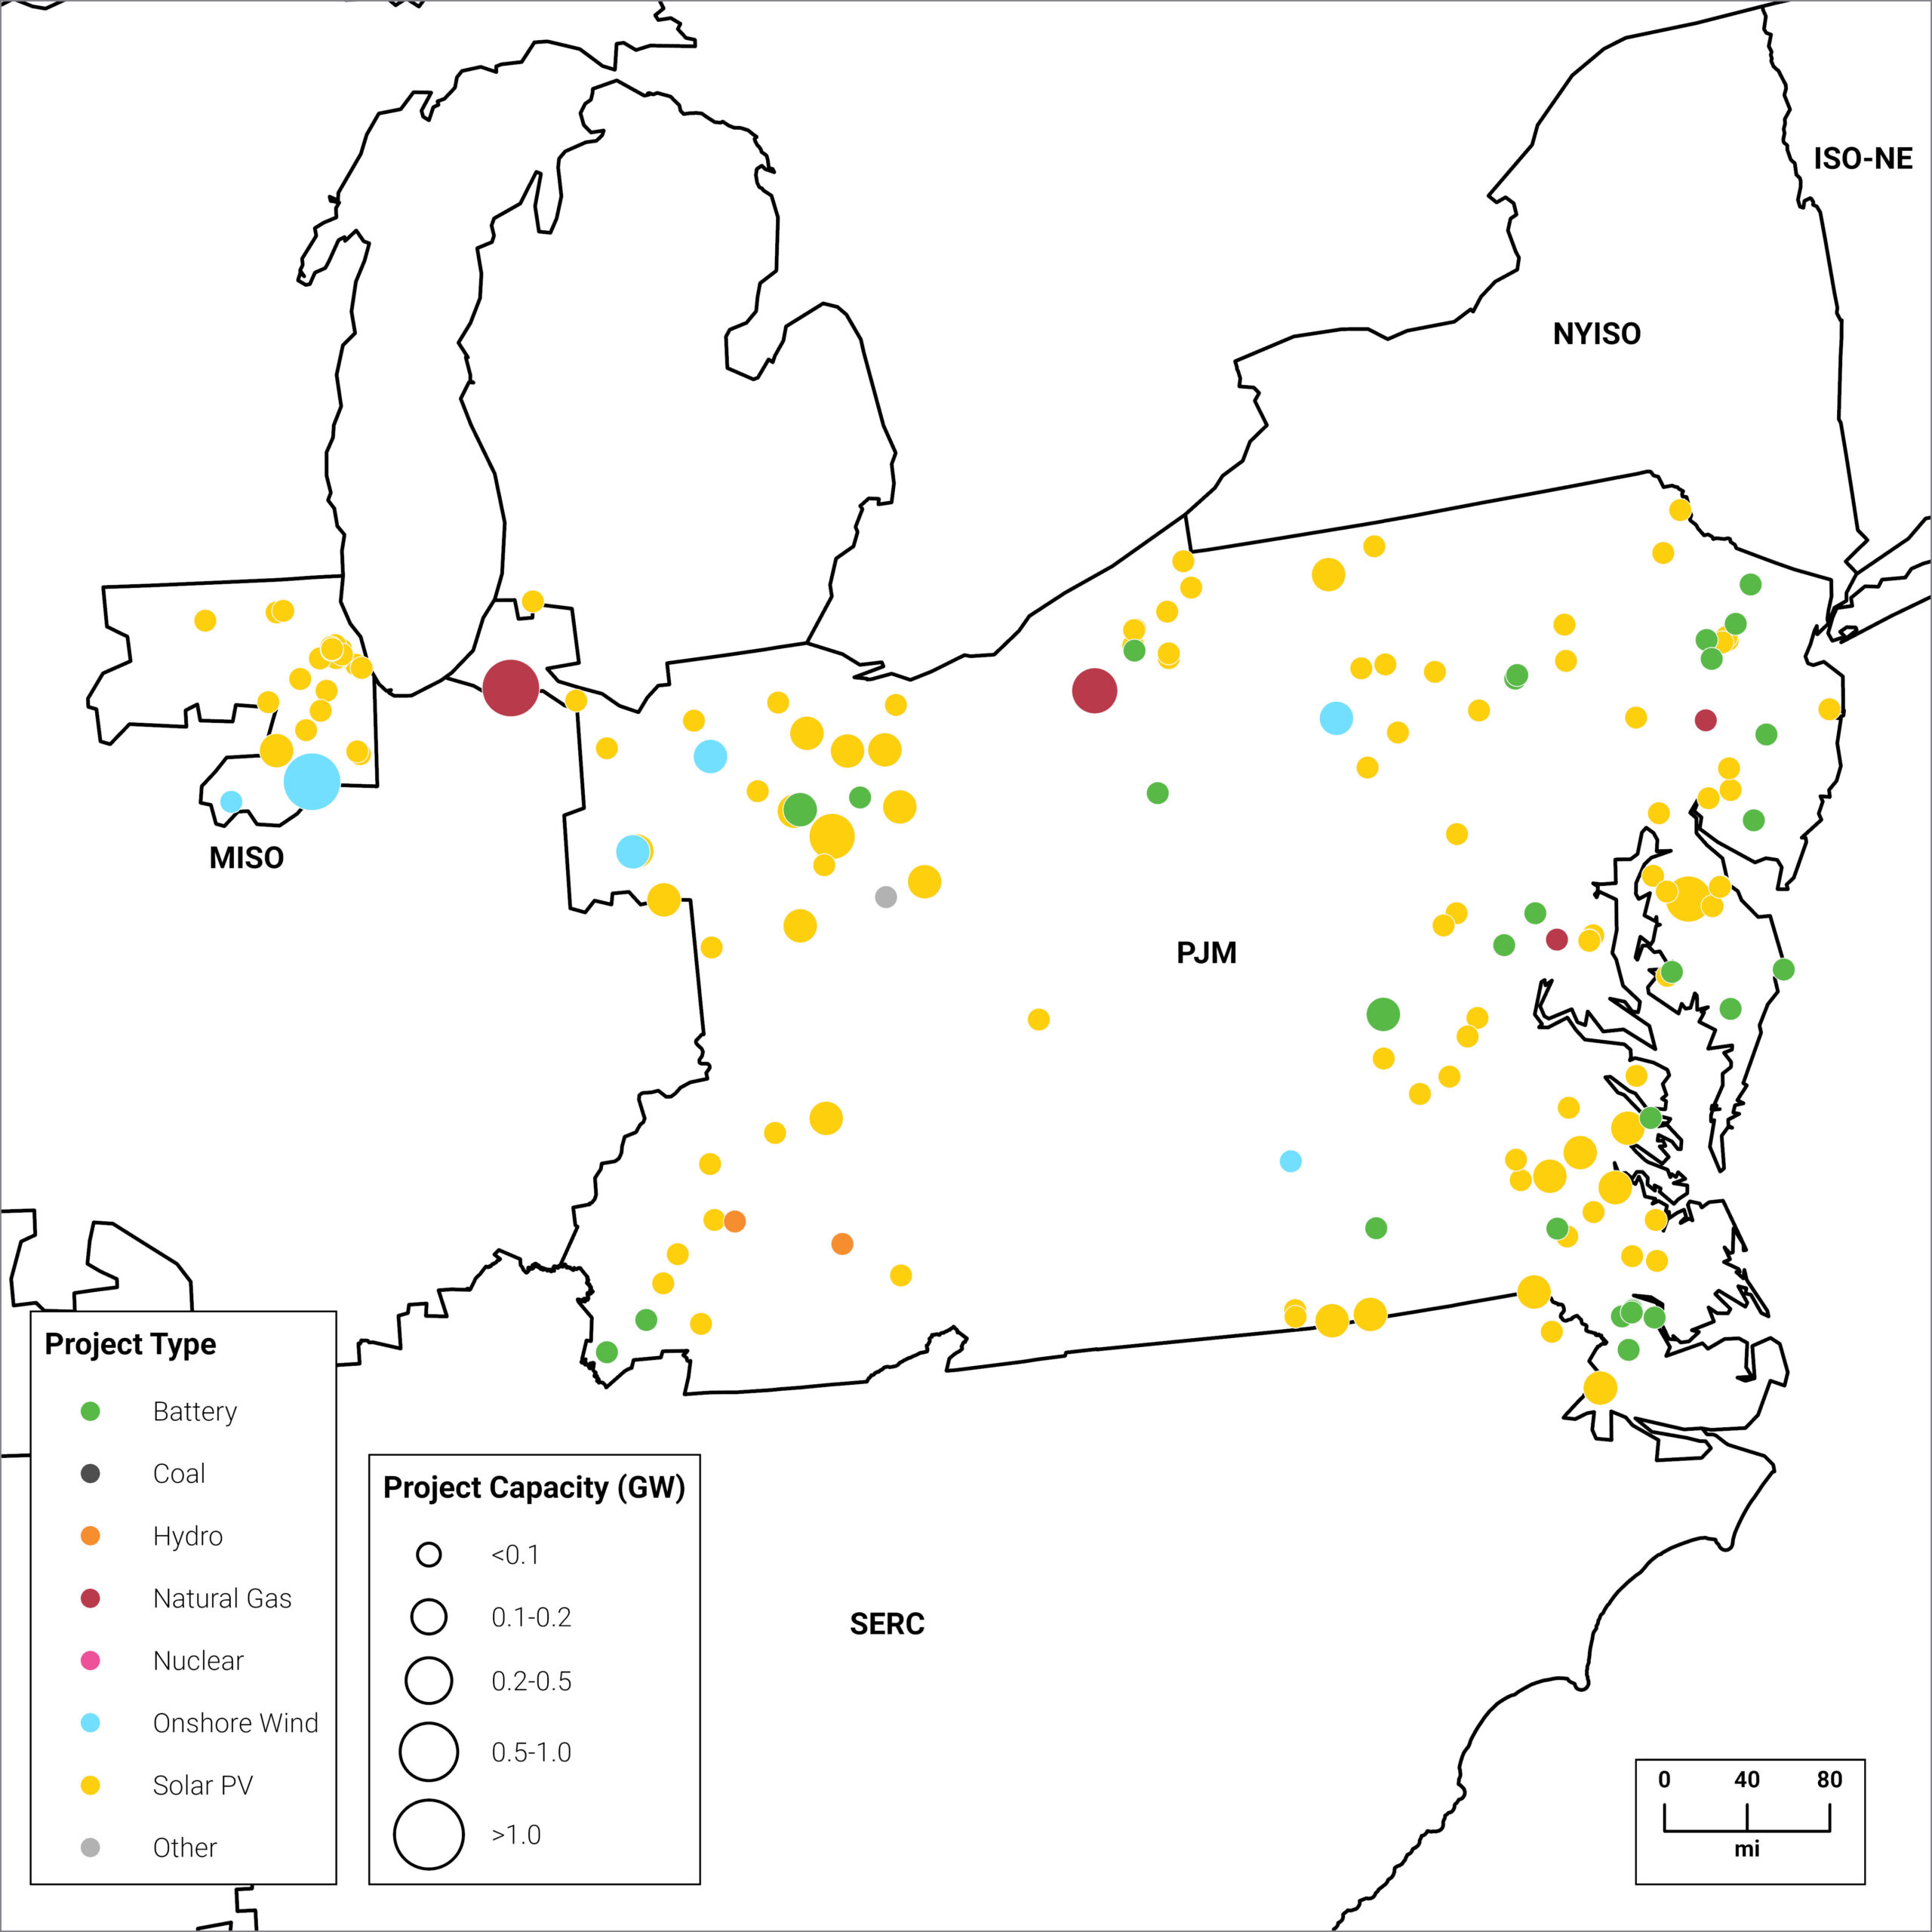
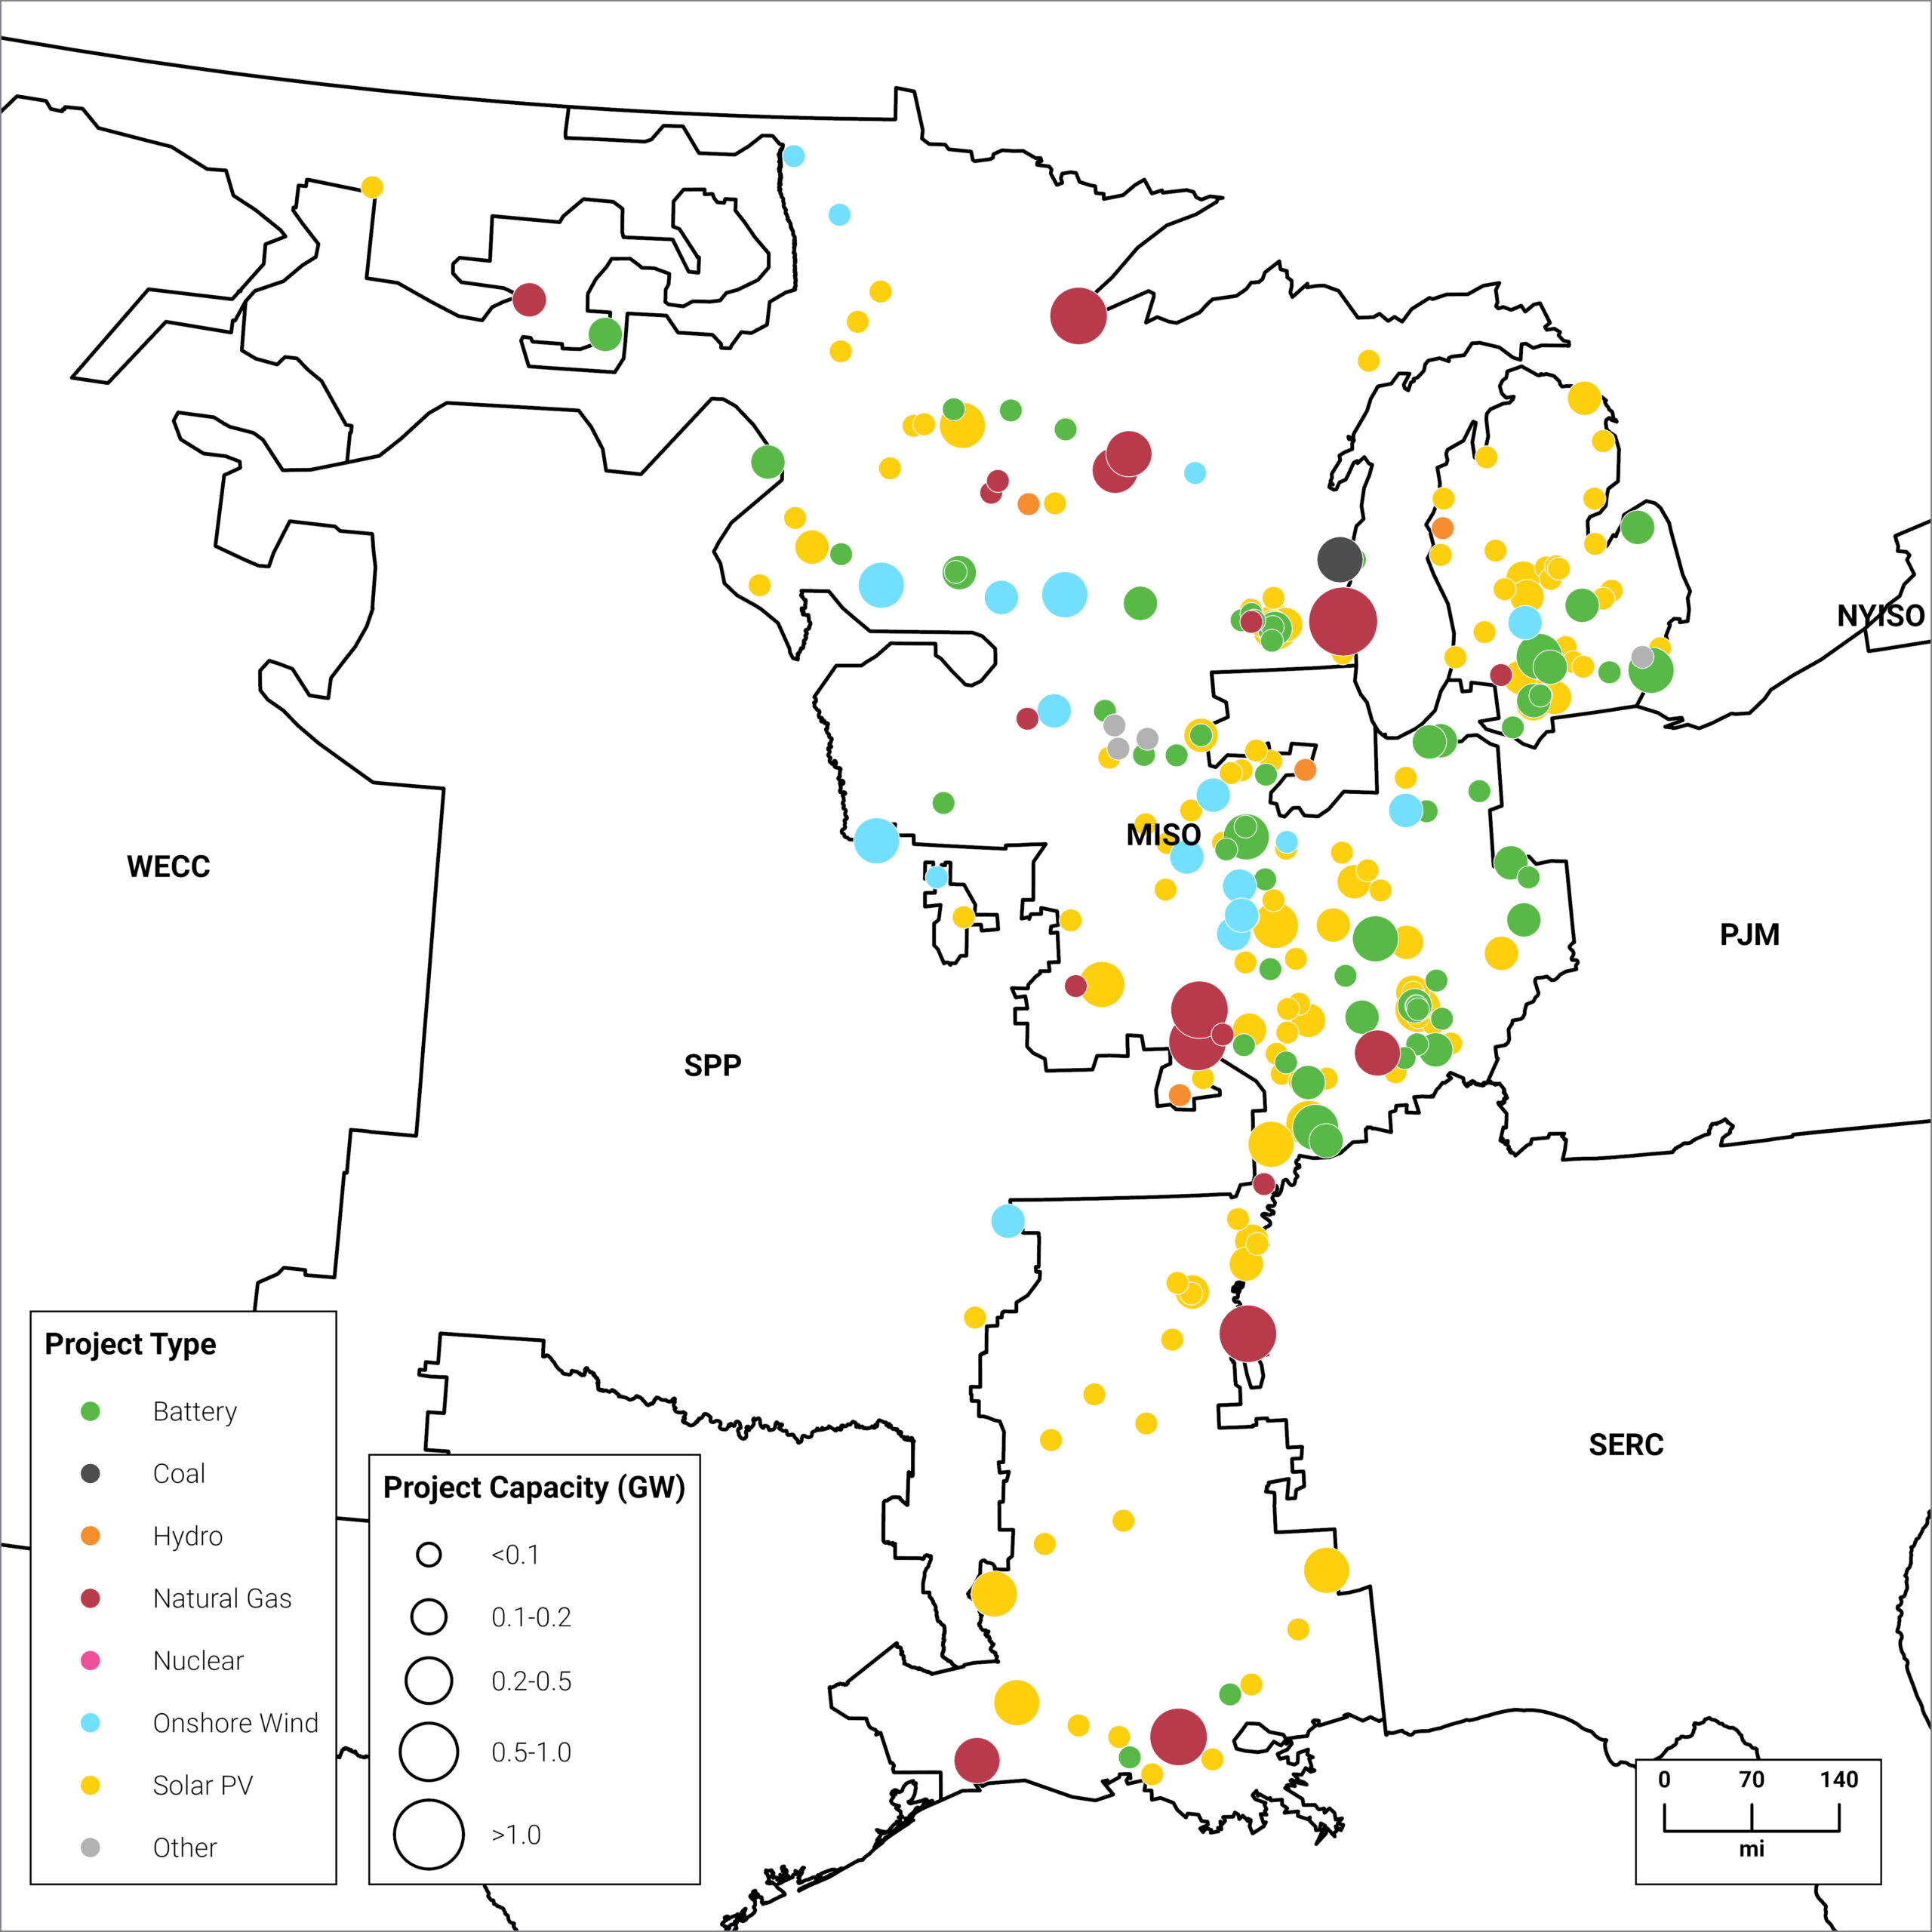
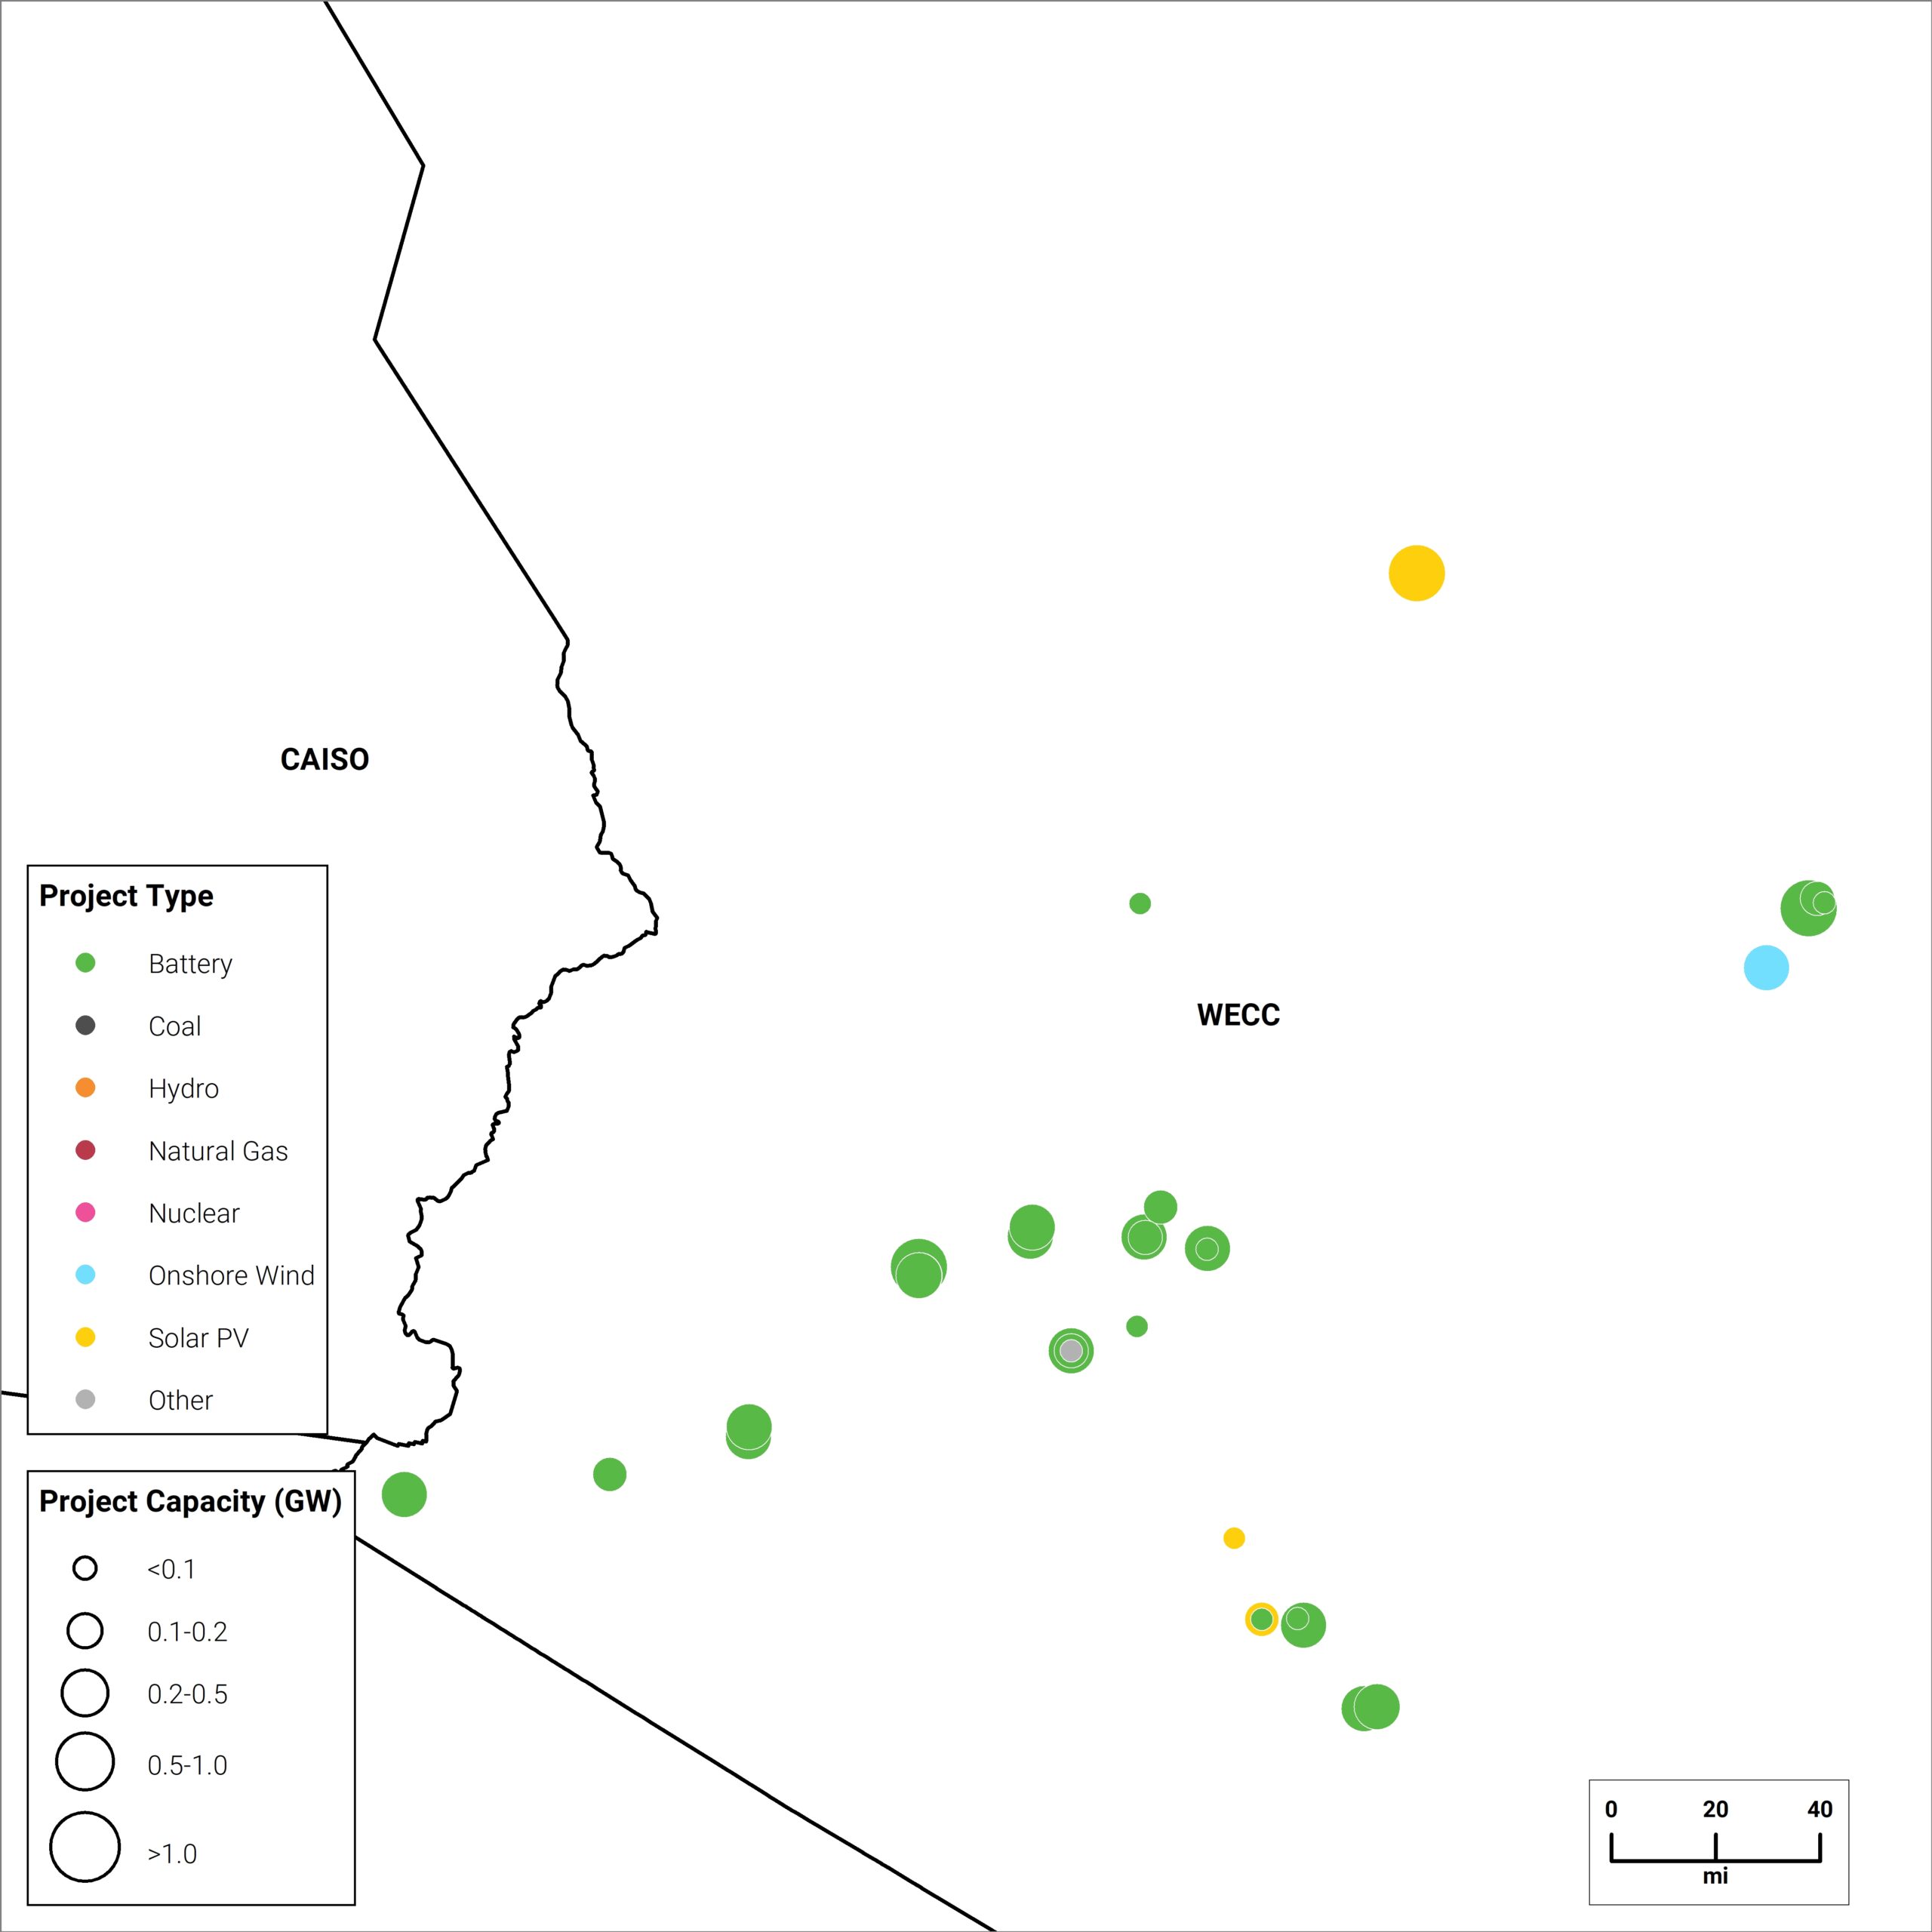
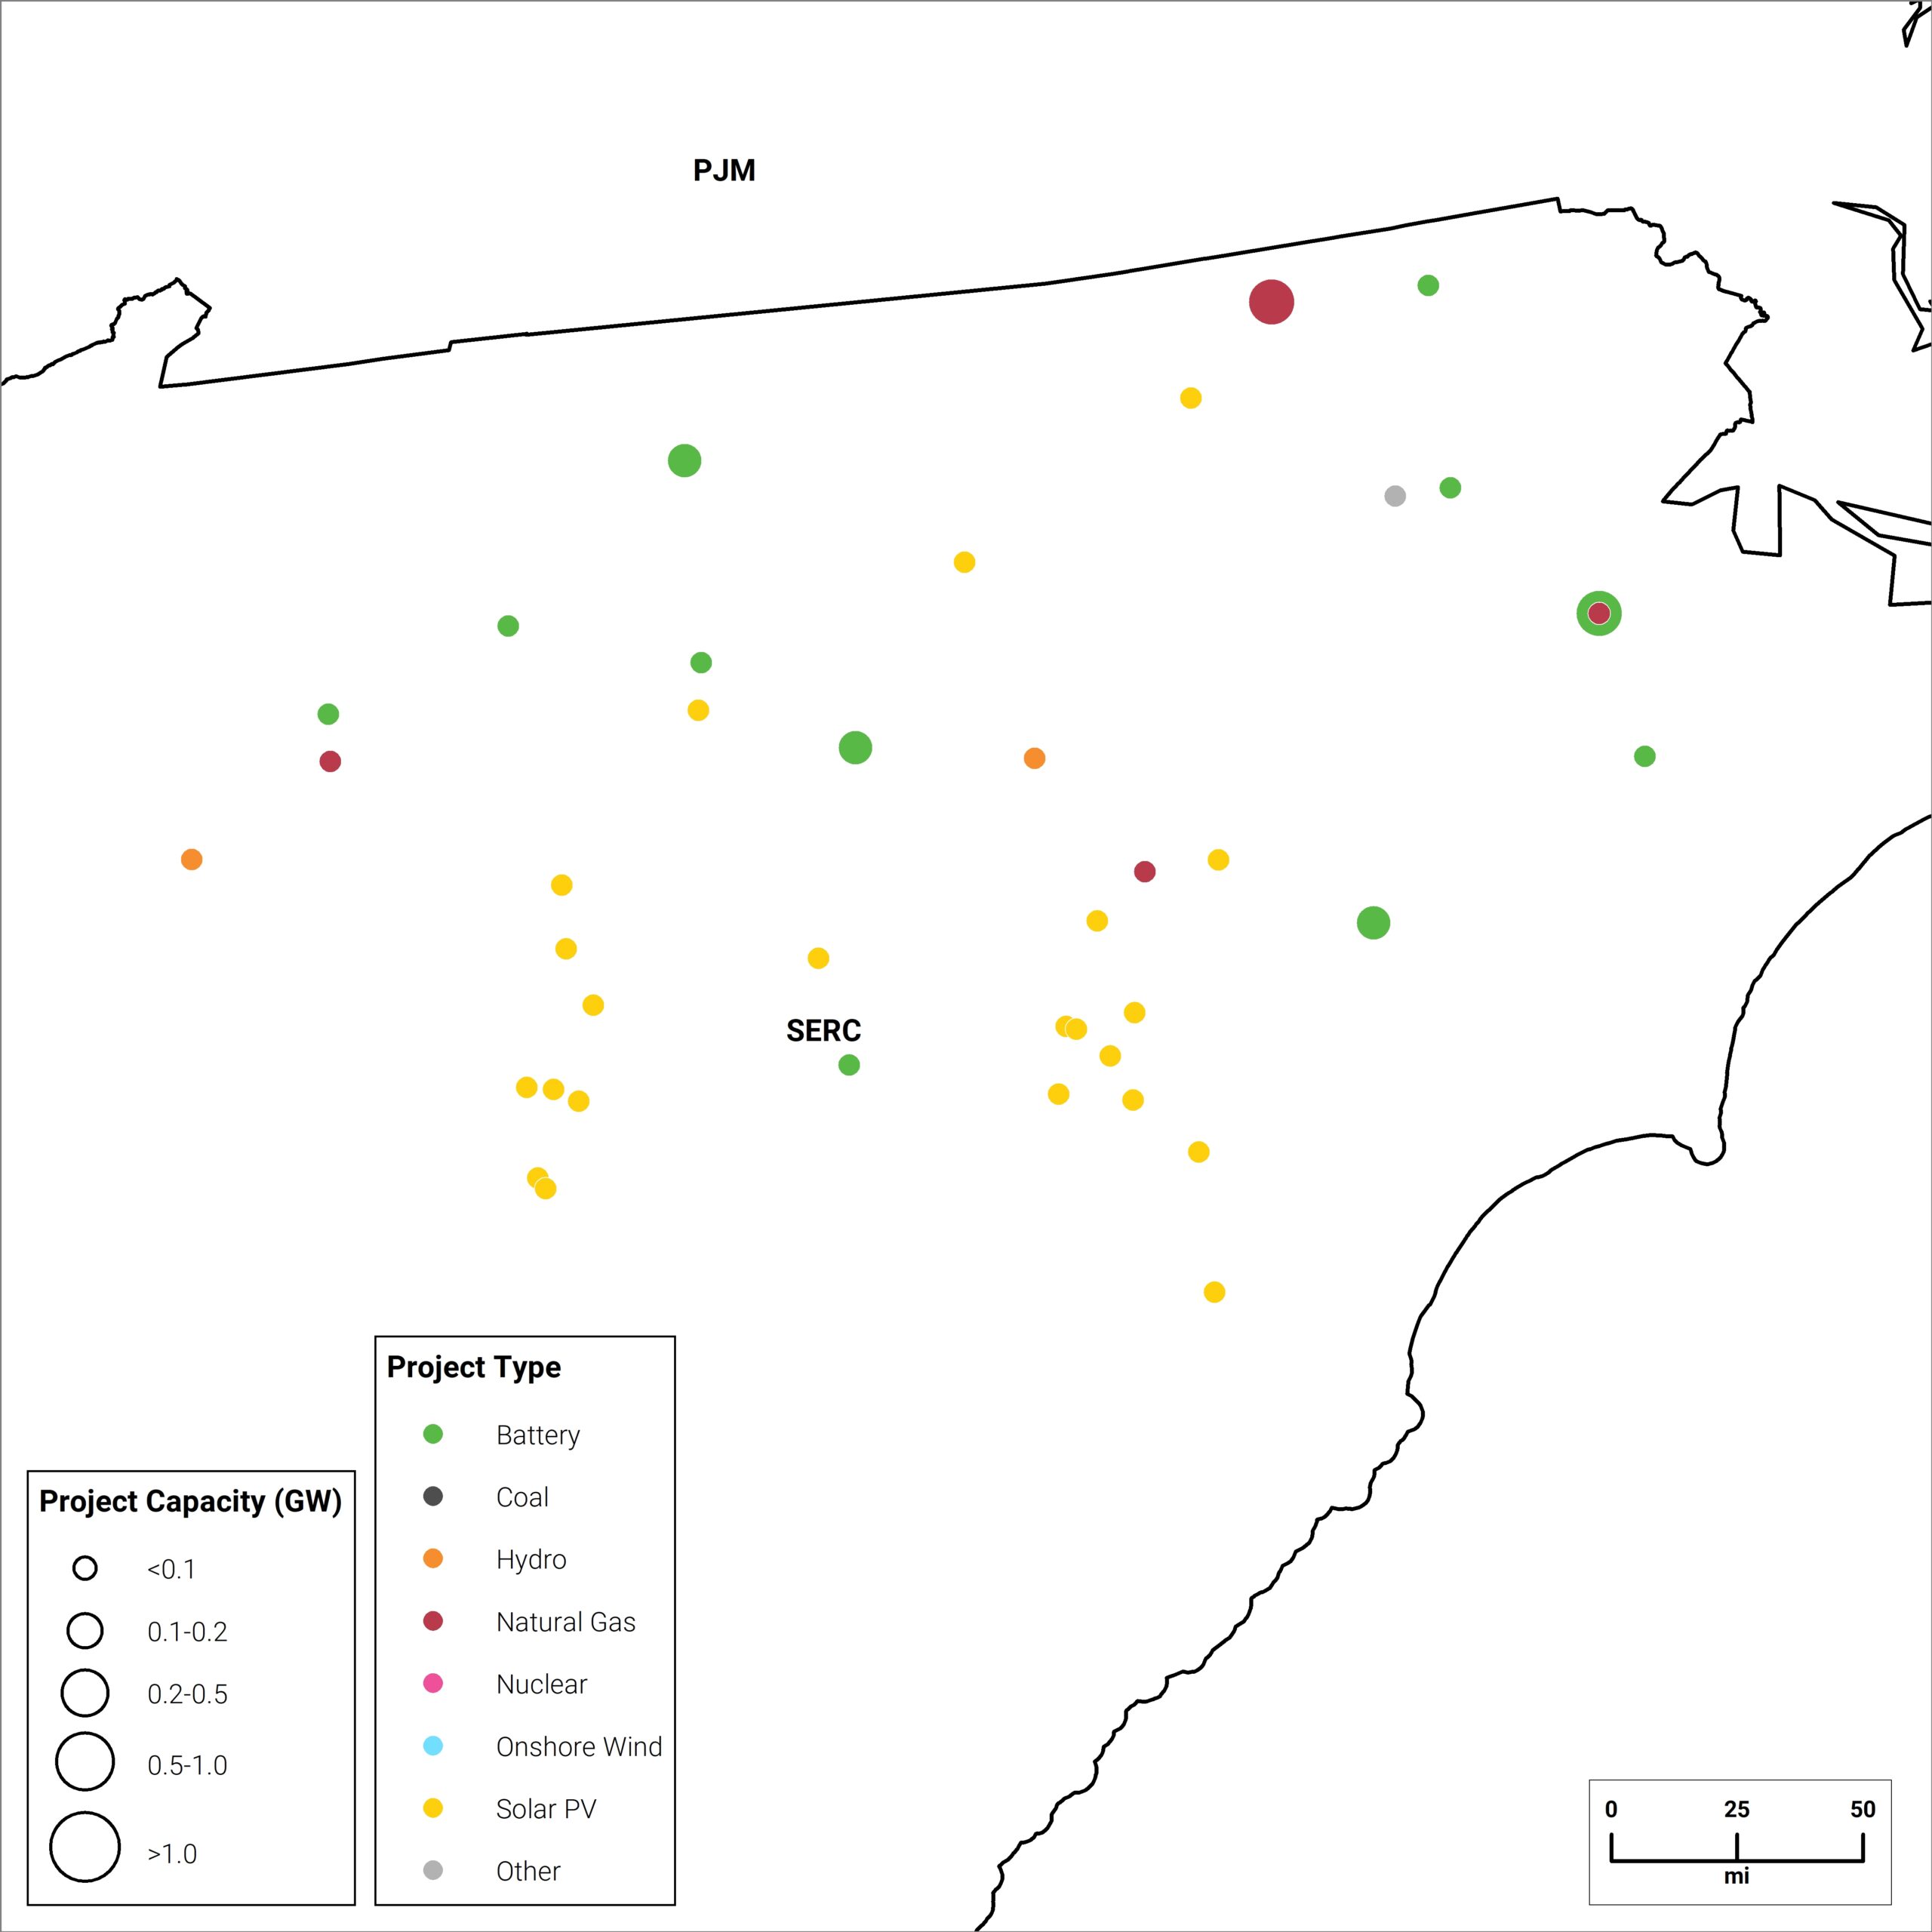
Figure 7 | Projects with 2026 Operation Dates
Type | 2025 New Capacity (GW) | 2026 Queued Capacity (GW) | 2026 Under Construction (GW) | 2026 Interconnection Agreement (GW) |
|---|---|---|---|---|
Solar | 8.8 | 13.0 | 7.9 | 0.7 |
Wind | 1.5 | 3.7 | 0.2 | 0.4 |
Battery Storage | 6.2 | 30.9 | 8.8 | 5.8 |
Natural Gas | <1 | 6.7 | 0.9 | 0.7 |
Source | Enverus Power & Renewables, Project Tracking Analytics
ISO Outlook:
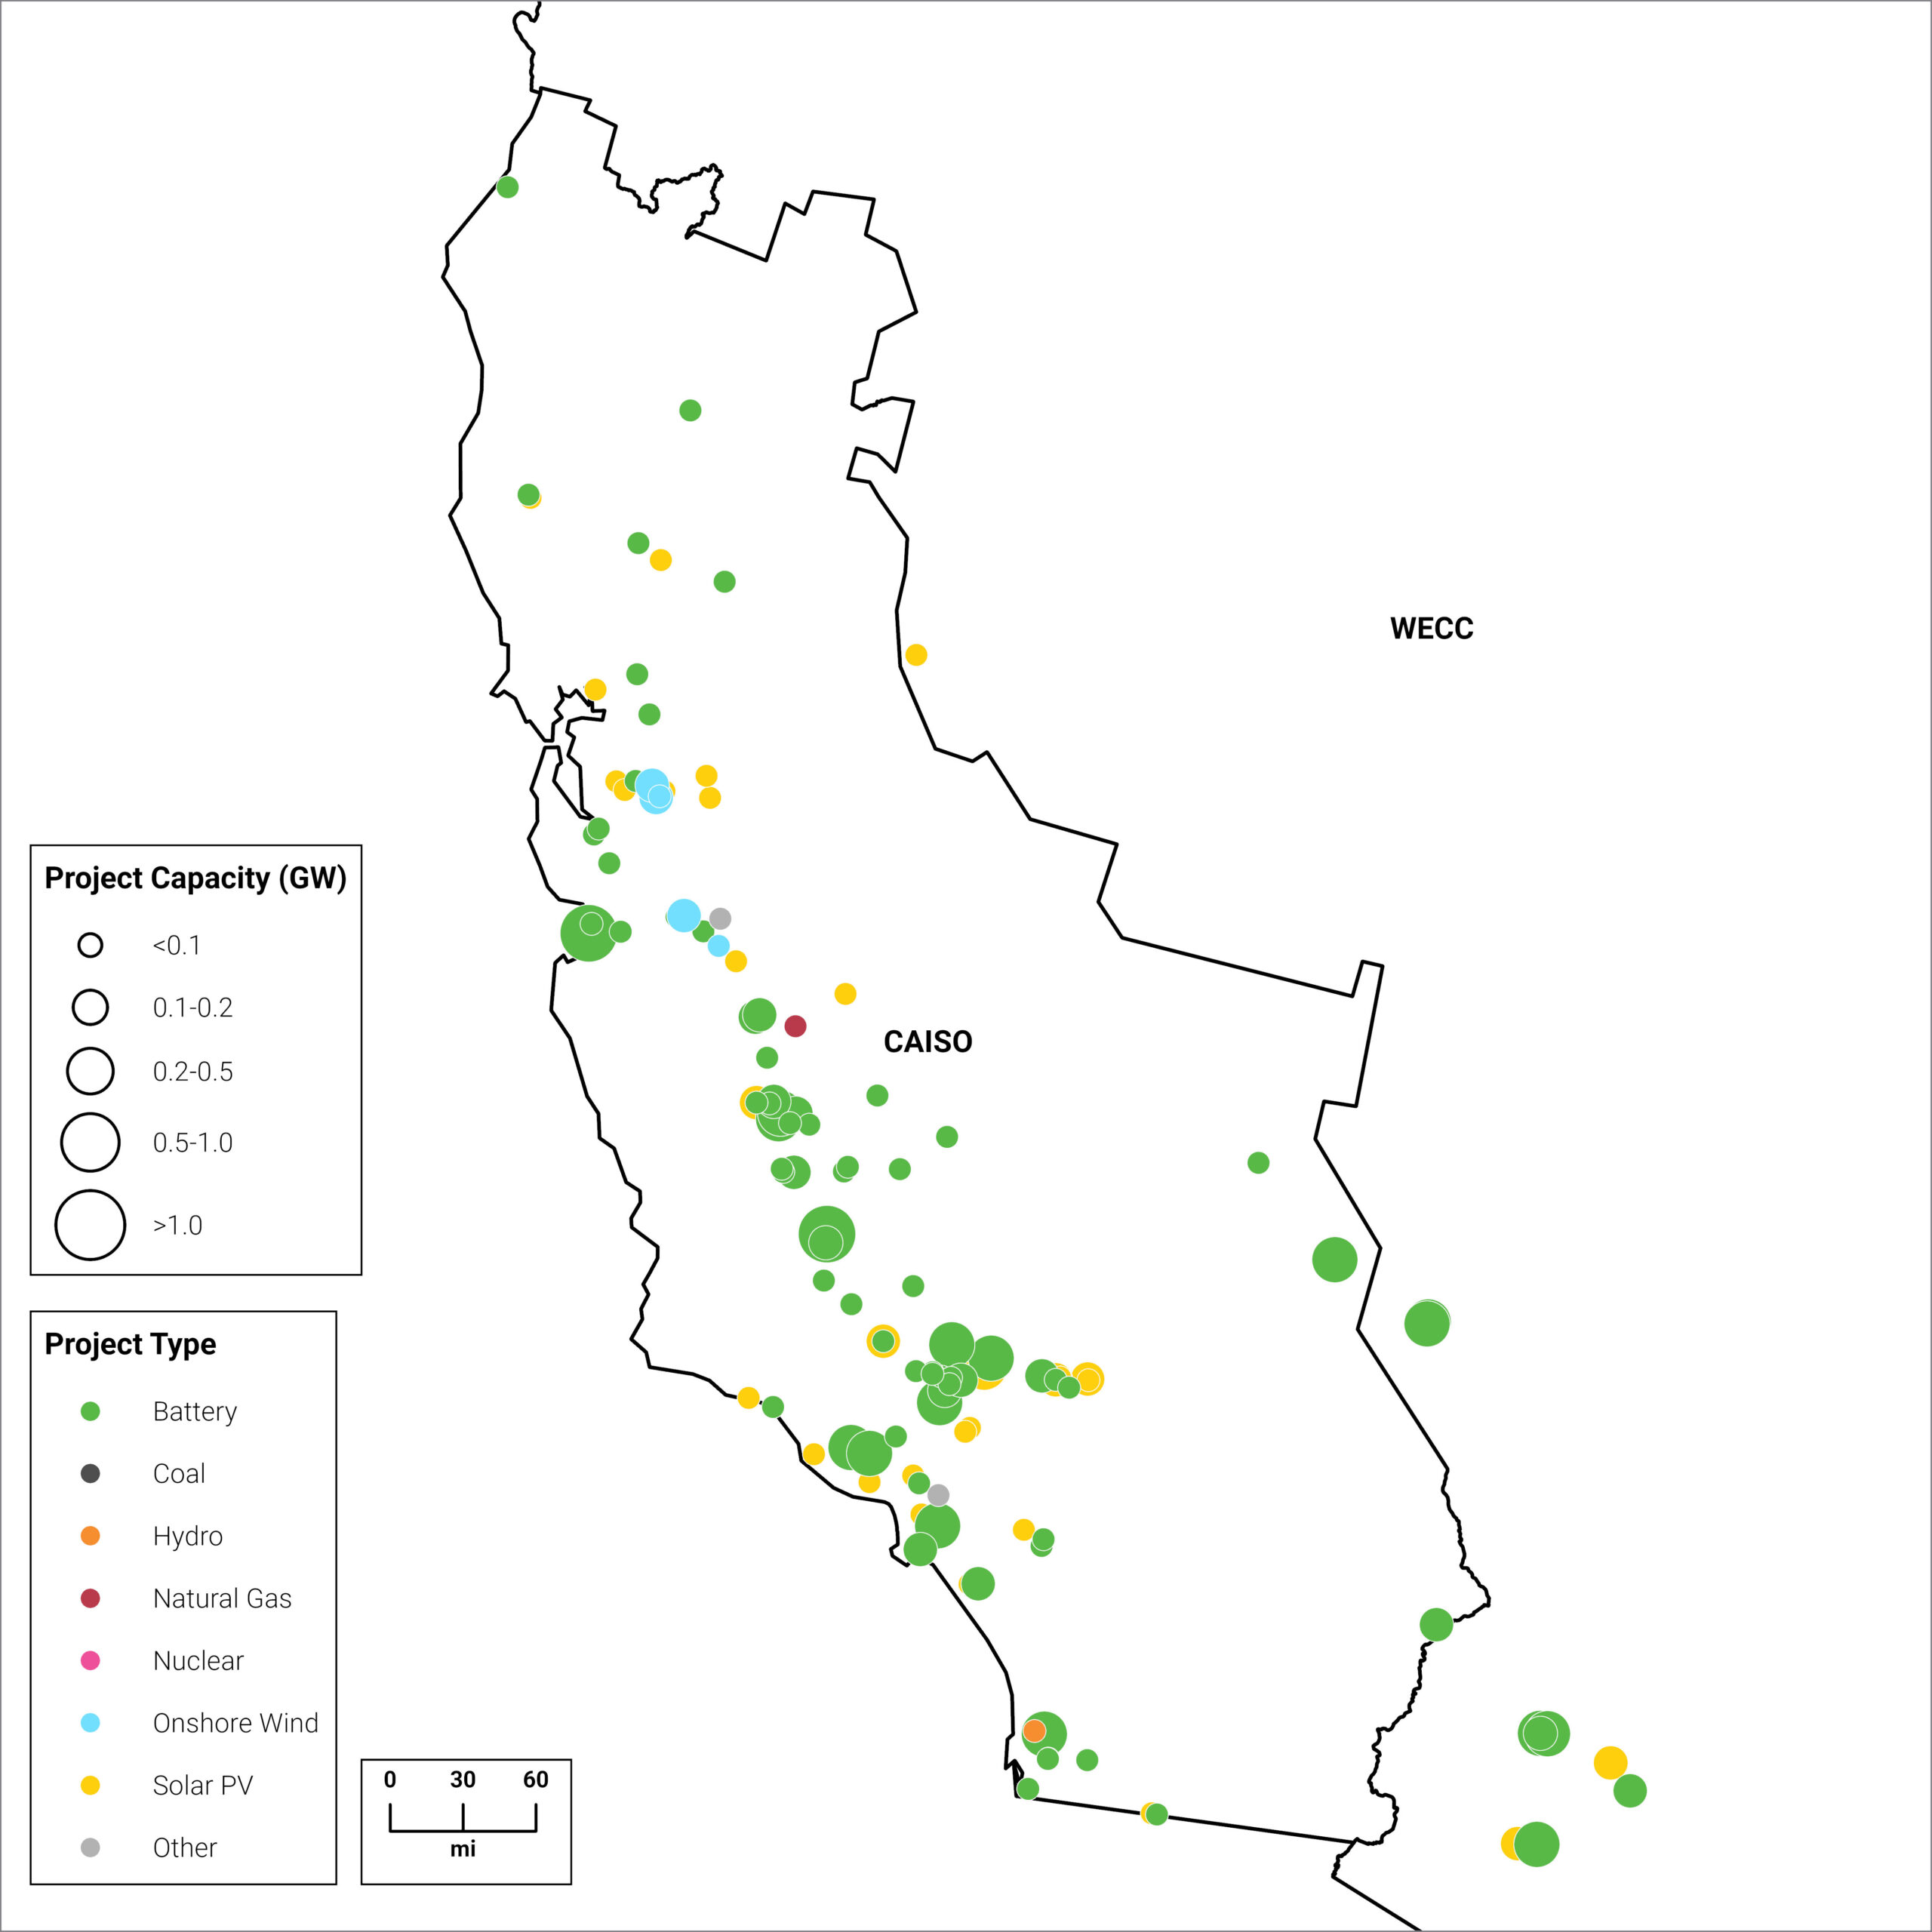
Figure 8 | Projects with 2026 Operation Dates
Type | 2025 New Capacity (GW) | 2026 Queued Capacity (GW) | 2026 Under Construction (GW) | 2026 Interconnection Agreement (GW) |
|---|---|---|---|---|
Solar | 3.4 | 25.3 | 4.7 | 1.7 |
Wind | 0.3 | 6.1 | 1.4 | 0 |
Battery Storage | 0.2 | 66.9 | 0.4 | 0.4 |
Natural Gas | <0.1 | 38.7 | 2.9 | 0 |
Source | Enverus Power & Renewables, Project Tracking Analytics
ISO Outlook:
Figure 9 | Projects with 2026 Operation Dates
Type | 2025 New Capacity (GW) | 2026 Queued Capacity (GW) | 2026 Under Construction (GW) | 2026 Interconnection Agreement (GW) |
|---|---|---|---|---|
Solar | 5.6 | 29 | 7.0 | 3.5 |
Wind | 0.5 | 12 | 1.2 | 1.4 |
Battery Storage | 0.7 | 21 | 0.9 | 6.1 |
Natural Gas | 0.5 | <1 | 2.3 | 5.3 |
Source | Enverus Power & Renewables, Project Tracking Analytics
MISO implemented study automation technology in 2025 enabling a stalled DPP 2022 cycle cluster to reach its first decision point and provide Phase 1 DPP 2023 results in less than 90 days.
ISO Outlook:
Figure 10 | Projects with 2026 Operation Dates
Type | 2025 New Capacity (GW) | 2026 Queued Capacity (GW) | 2026 Under Construction (GW) | 2026 Interconnection Agreement (GW) |
|---|---|---|---|---|
Solar | 0.6 | 3.5 | 1.7 | 0.8 |
Wind | 1.1 | 3.7 | 0.9 | 1.4 |
Battery Storage | 0.2 | 8.1 | 0.5 | 3.1 |
Natural Gas | 1.8 | 6.5 | 1.0 | 3.0 |
Source | Enverus Power & Renewables, Project Tracking Analytics
ISO Outlook:
Figure 11 | Projects with 2026 Operation Dates
Type | 2025 New Capacity (GW) | 2026 Queued Capacity (GW) | 2026 Under Construction (GW) | 2026 Interconnection Agreement (GW) |
|---|---|---|---|---|
Solar | 2.9 | 5.6 | 2.9 | 0.9 |
Wind | <0.1 | 0.6 | 0.1 | 0.3 |
Battery Storage | 5.7 | 20.1 | 3.6 | 7.2 |
Natural Gas | <0.1 | 1.8 | 0 | <0.1 |
Source | Enverus Power & Renewables, Project Tracking Analytics
ISO Outlook:
Figure 12 | Projects with 2026 Operation Dates
Type | 2025 New Capacity (GW) | 2026 Queued Capacity (GW) | 2026 Under Construction (GW) | 2026 Interconnection Agreement (GW) |
|---|---|---|---|---|
Solar | 0.5 | 2.8 | 0.2 | 0.1 |
Wind | 0.2 | 0.3 | <0.1 | <0.1 |
Battery Storage | 0.5 | 2.9 | <0.1 | 0.8 |
Natural Gas | 0 | 0.7 | 0 | 0.6 |
Source | Enverus Power & Renewables, Project Tracking Analytics
ISO Outlook:
Figure 13 | Projects with 2026 Operation Dates
Type | 2025 New Capacity (GW) | 2026 Queued Capacity (GW) | 2026 Under Construction (GW) | 2026 Interconnection Agreement (GW) |
|---|---|---|---|---|
Solar | 0.4 | 3.3 | 0.7 | 0.4 |
Wind | 0 | 0.5 | 0.5 | 0 |
Battery Storage | <0.1 | 2.6 | 0.2 | 0.3 |
Natural Gas | <0.1 | 1.1 | <0.1 | 0 |
Source | Enverus Power & Renewables, Project Tracking Analytics
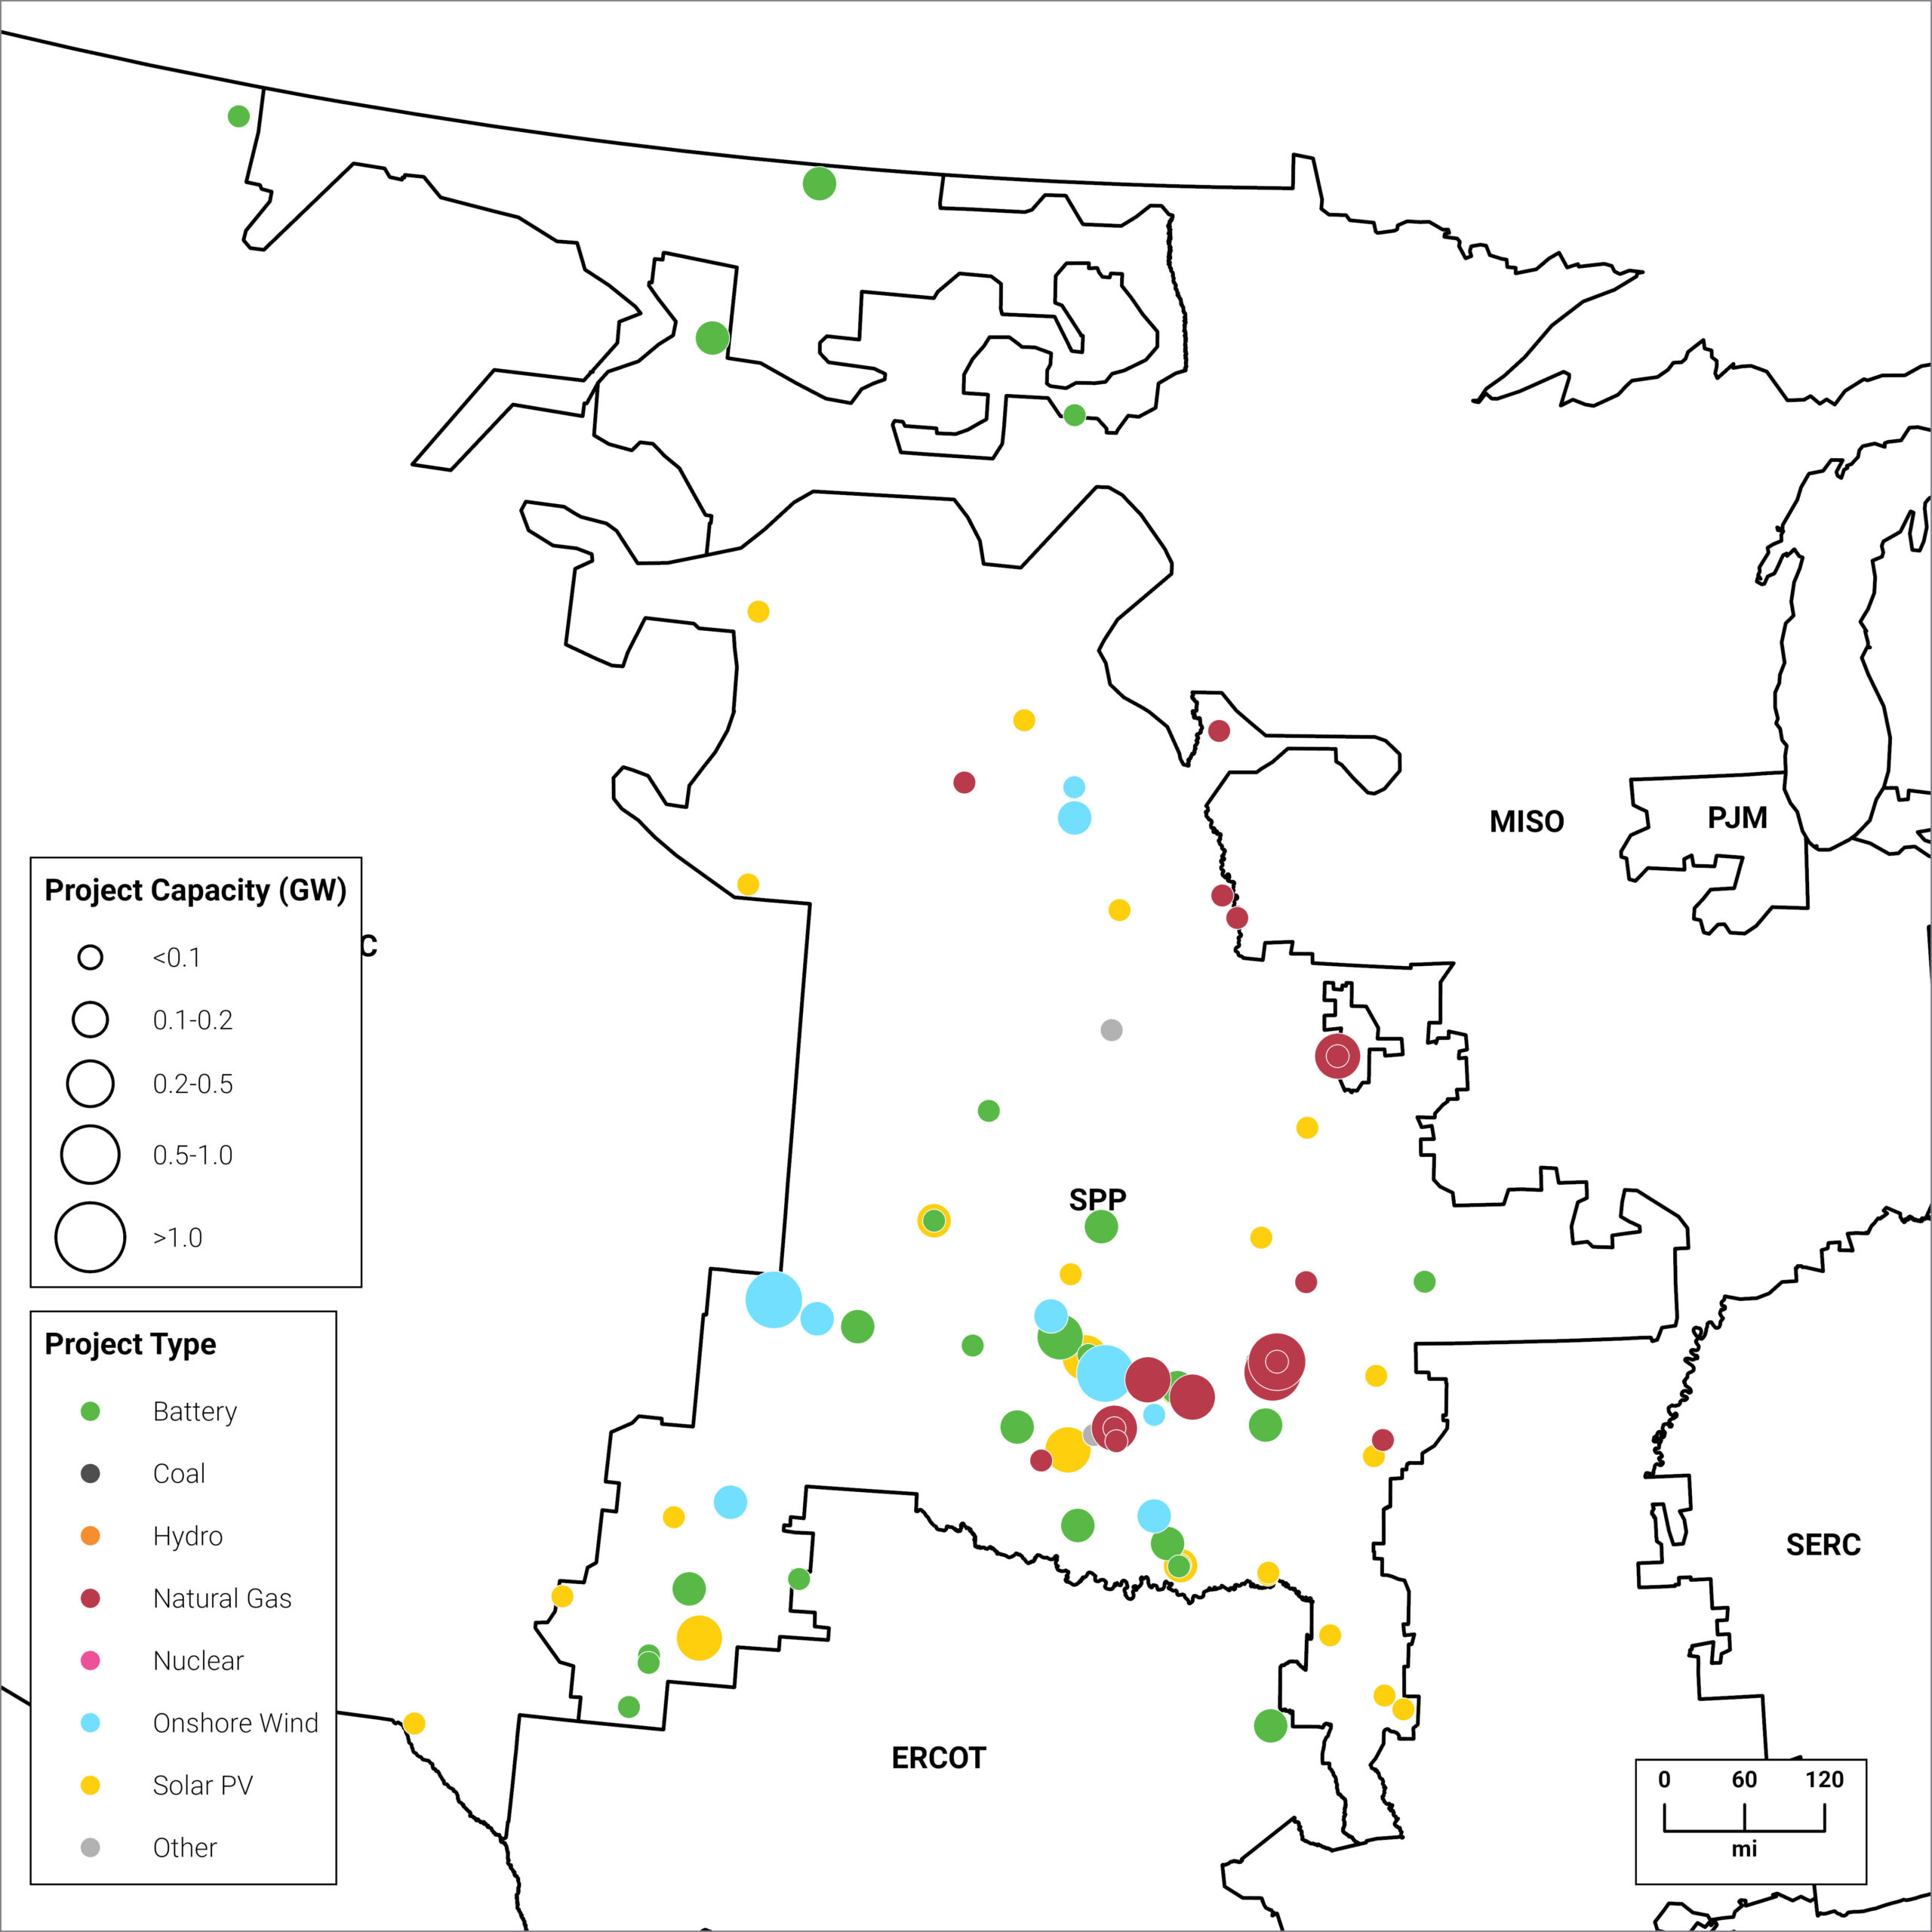
Figure 14 | Projects with 2026 Operation Dates
Type | 2025 New Capacity (GW) | 2026 Queued Capacity (GW) | 2026 Under Construction (GW) | 2026 Interconnection Agreement (GW) |
|---|---|---|---|---|
Solar | <0.1 | 6.2 | 5.9 | <0.1 |
Wind | 0 | 0.7 | 0.5 | 0 |
Battery Storage | 0.6 | 22.2 | 7.0 | 0.8 |
Natural Gas | 0 | 1.7 | 0 | 0 |
Source | Enverus Power & Renewables, Project Tracking Analytics
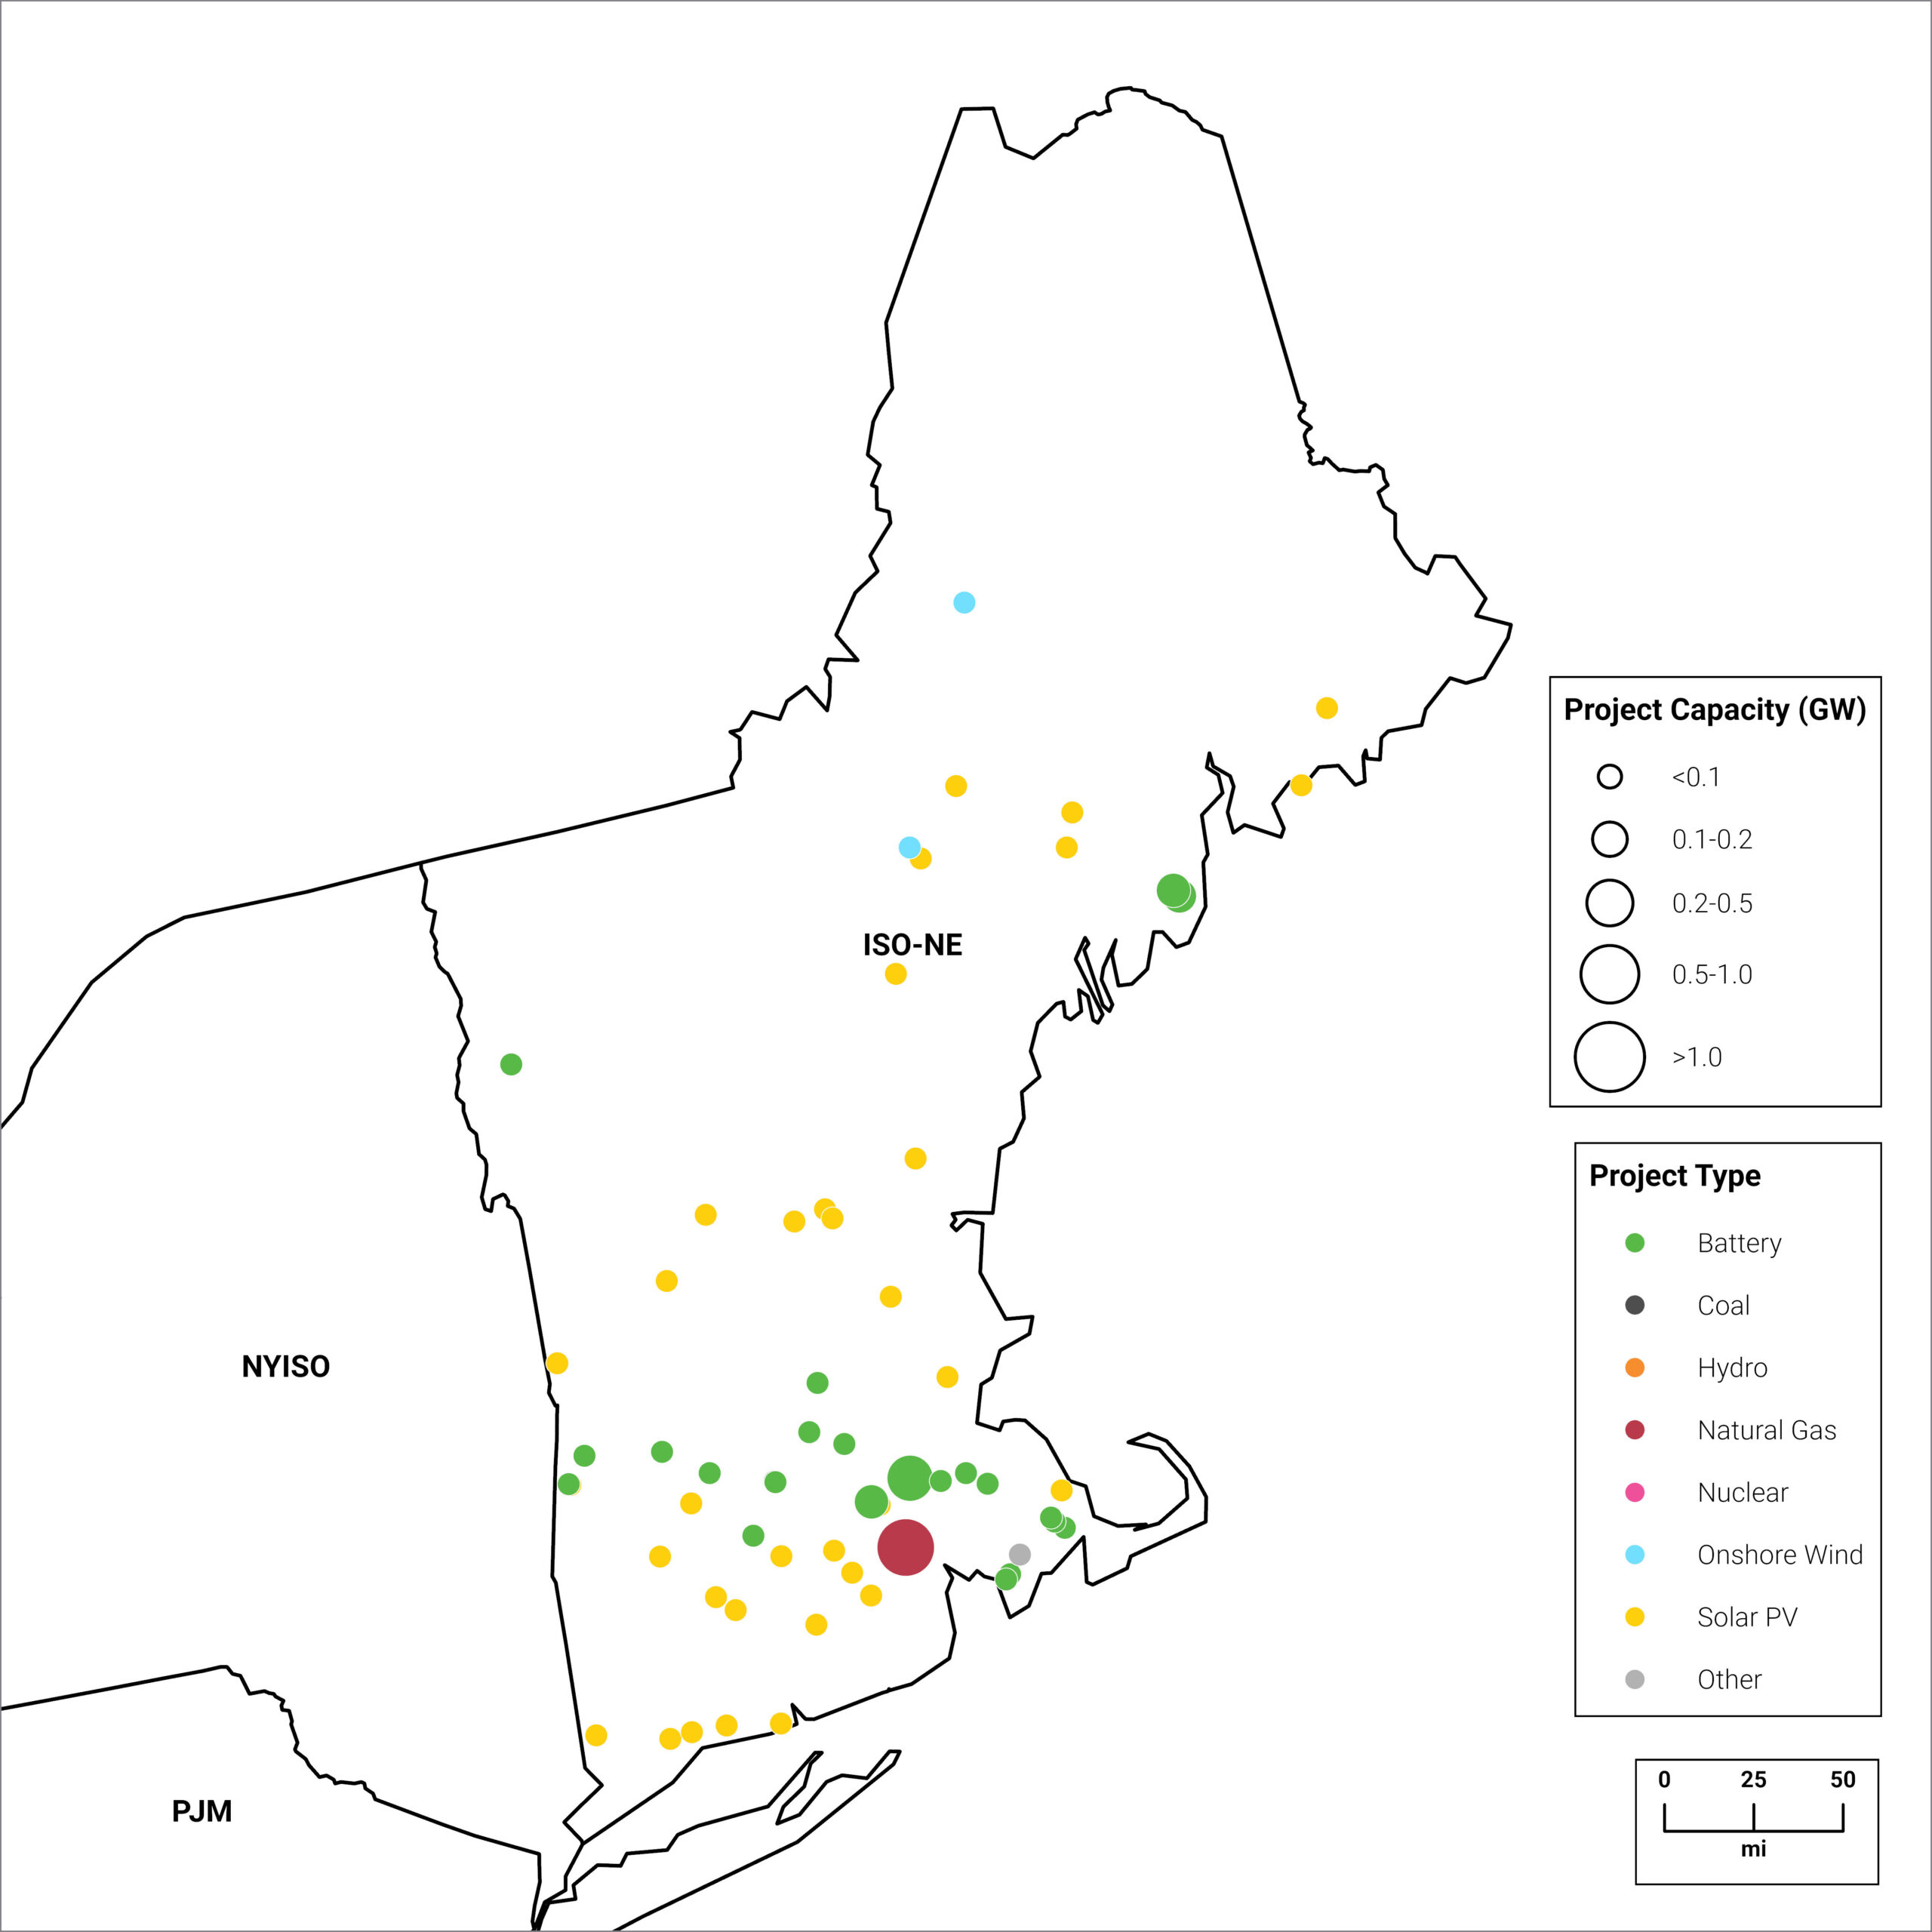
Figure 15 | Projects with 2026 Operation Dates
Type | 2025 New Capacity (GW) | 2026 Queued Capacity (GW) | 2026 Under Construction (GW) | 2026 Interconnection Agreement (GW) |
|---|---|---|---|---|
Solar | 0 | 0.3 | 0 | 0 |
Wind | 0 | 0.2 | 0 | 0 |
Battery Storage | 0 | 4.0 | <0.1 | 0 |
Natural Gas | 0 | <0.1 | 0 | 0 |
Source | Enverus Power & Renewables, Project Tracking Analytics
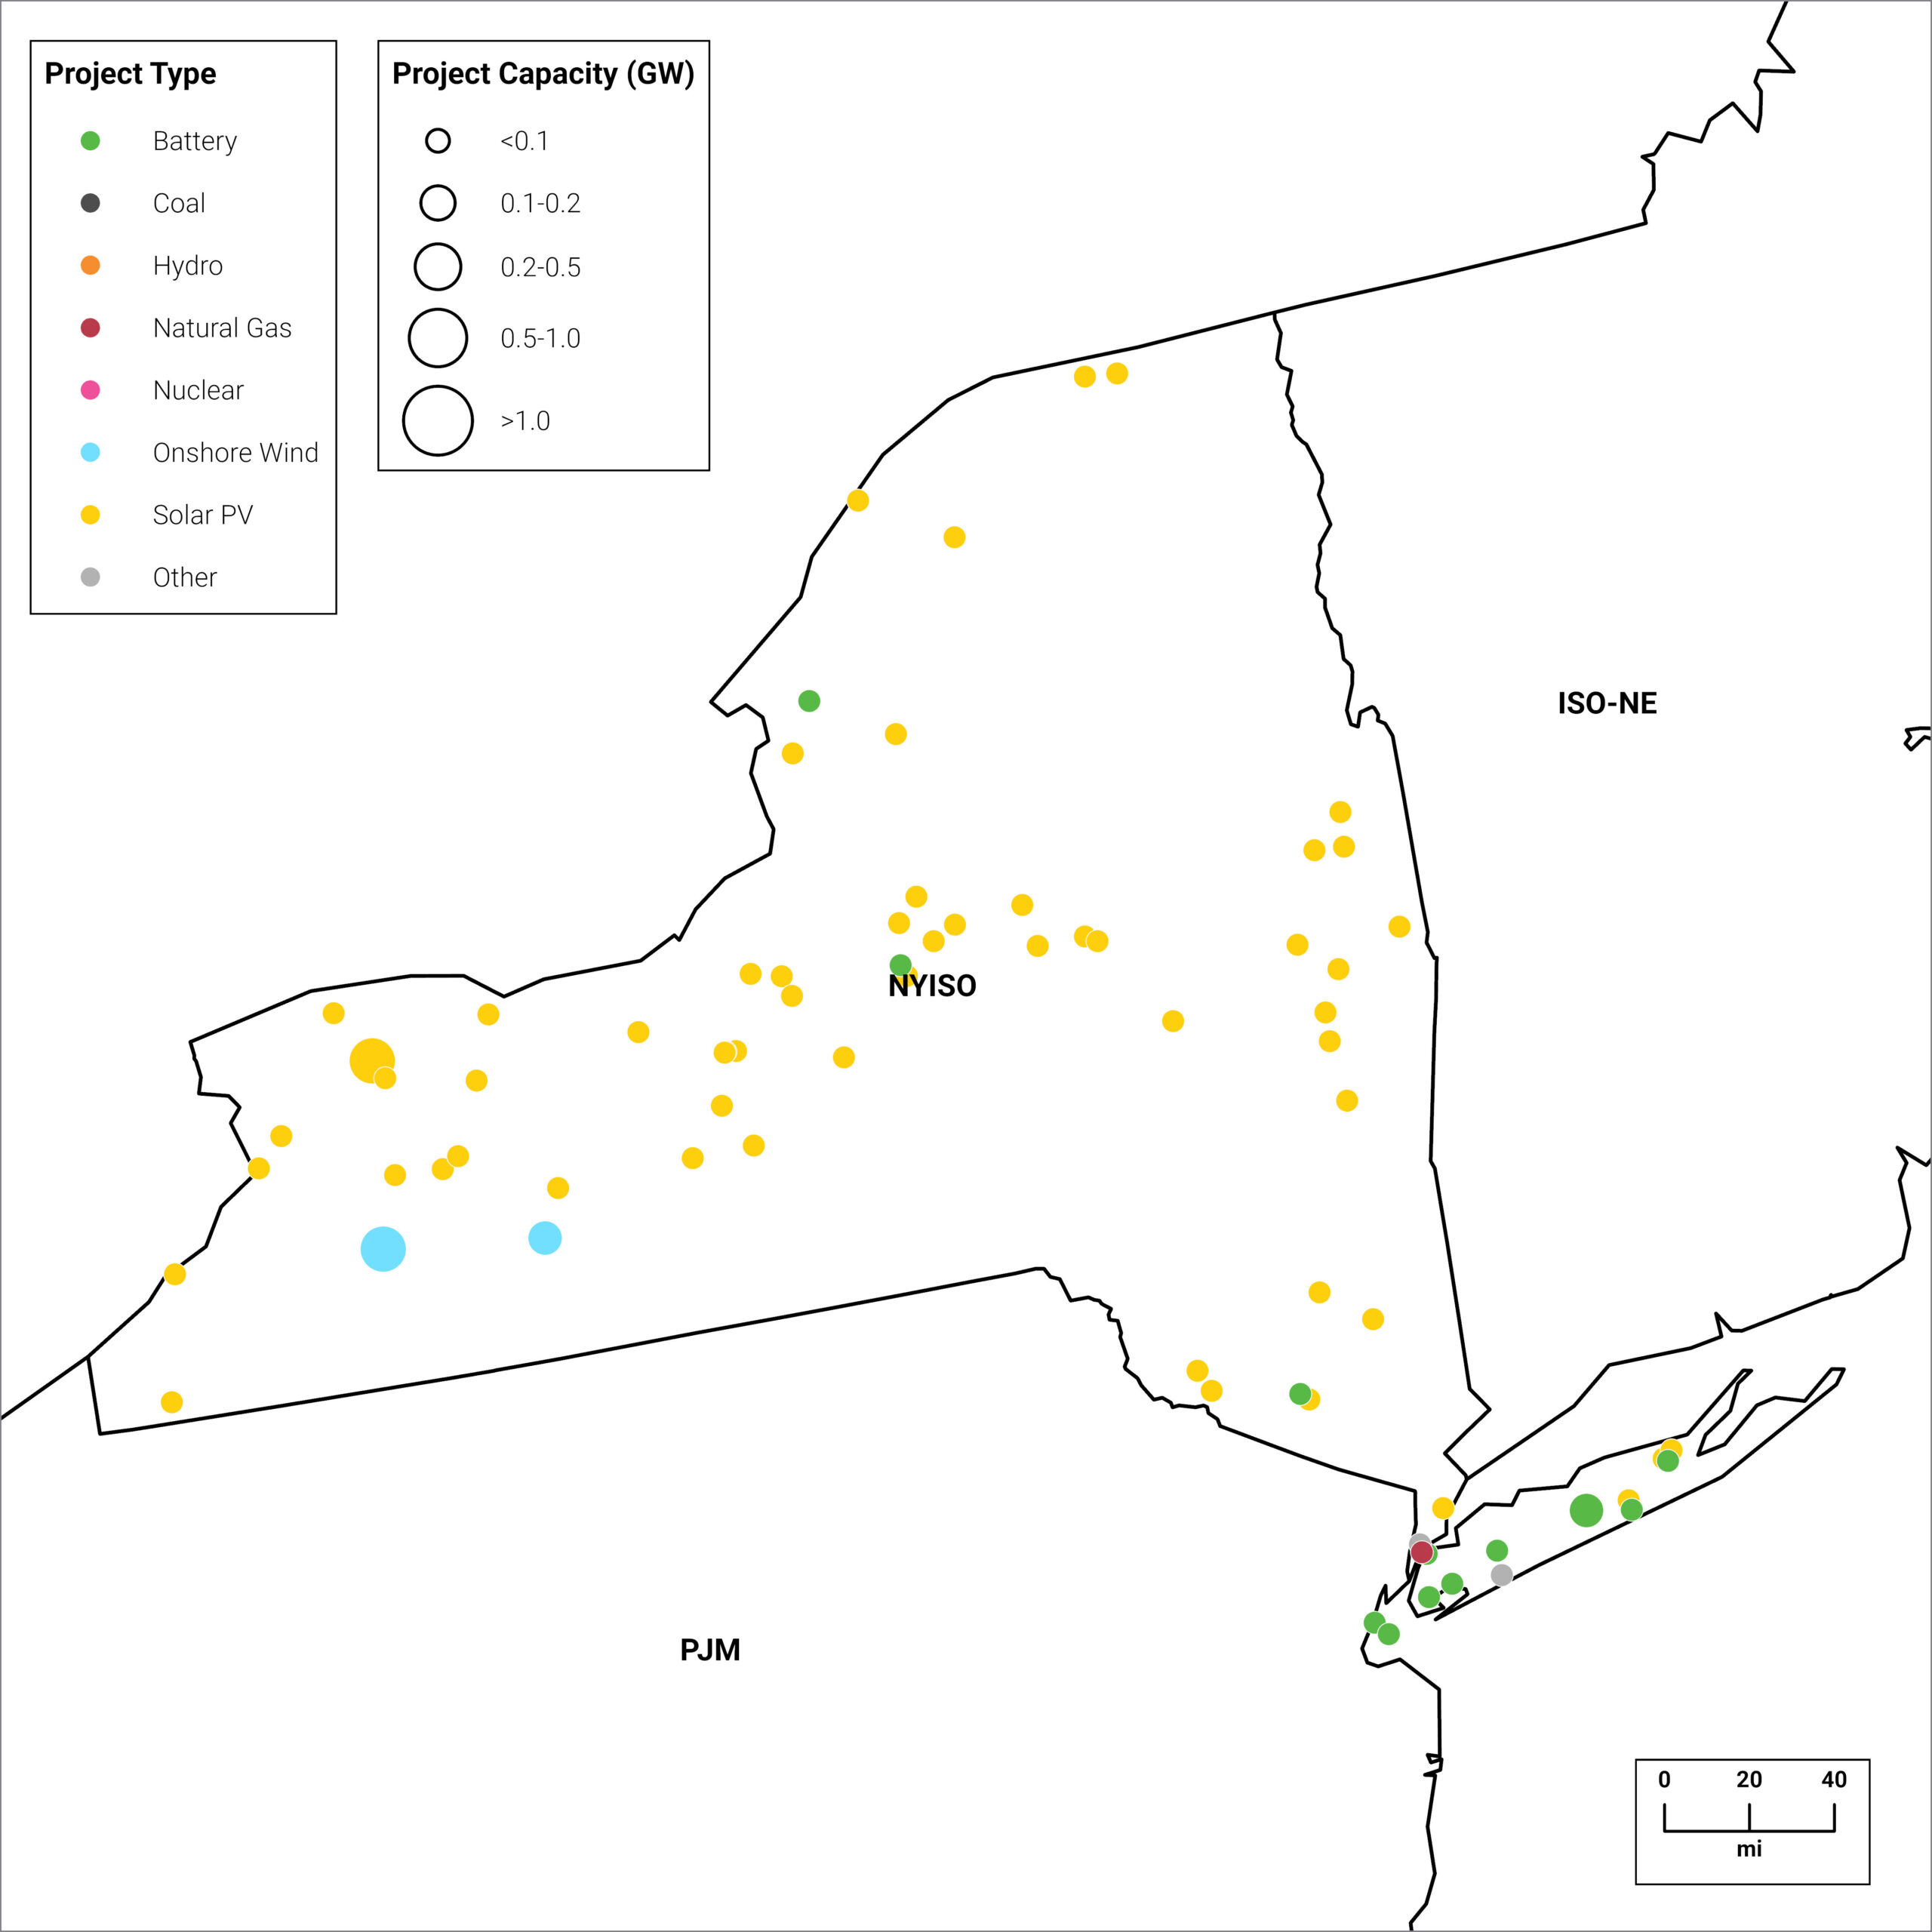
Figure 16 | Projects with 2026 Operation Dates
Type | 2025 New Capacity (GW) | 2026 Queued Capacity (GW) | 2026 Under Construction (GW) | 2026 Interconnection Agreement (GW) |
|---|---|---|---|---|
Solar | 0.8 | 1.4 | 0.6 | 0.6 |
Wind | 0 | 1.4 | 0.4 | 0 |
Battery Storage | 0.5 | 10.1 | 0.8 | 0.7 |
Natural Gas | 0 | 0.7 | 0 | 0 |
Source | Enverus Power & Renewables, Project Tracking Analytics
Strategic Coal Reprieve and Gas Bridge: To prevent a reliability gap caused by the Data center surge, Southern Company has officially delayed the retirement of over 8,200 MW of coal capacity. Major units at Plant Bowen and Plant Scherer (Georgia) and Plant Daniel (Mississippi) that were originally slated for 2028 closures have had their lives extended to 2035 or 2039. In 2026, the utility is aggressively moving forward with co-firing natural gas at these sites to lower emissions while maintaining the firm dispatchable power required by data center operators.
Capitalizing on the “Vogtle Advantage”: With Units 3 and 4 at Plant Vogtle now in steady-state commercial operation, Southern Company is leveraging its position as the leader in new U.S. nuclear. In 2025/2026, Southern Nuclear achieved a global milestone by installing Advanced Lead Test Assemblies (uranium enriched above historical 5% limits) in Unit 2. This innovation is a key part of SoCo’s 2026 strategy to extend fuel cycles and reduce operational costs across its nuclear fleet to offset rising interest rates and capex.
Acceleration of the “Order 2023” Cluster Study: In response to the federal FERC Order 2023, Southern Company has launched its most rigid interconnection process to date for the 2026 cycle. The new Annual Cluster Study, opening February 2026, imposes strict readiness requirements, such as 6 acres/MW for solar and expensive withdrawal penalties, to clear placeholder projects out of the queue. This reform is designed to fast-track the 20,000 MW of renewables and storage Southern expects to have in its portfolio by the early 2030s.
Figure 17 | Projects with 2026 Operation Dates
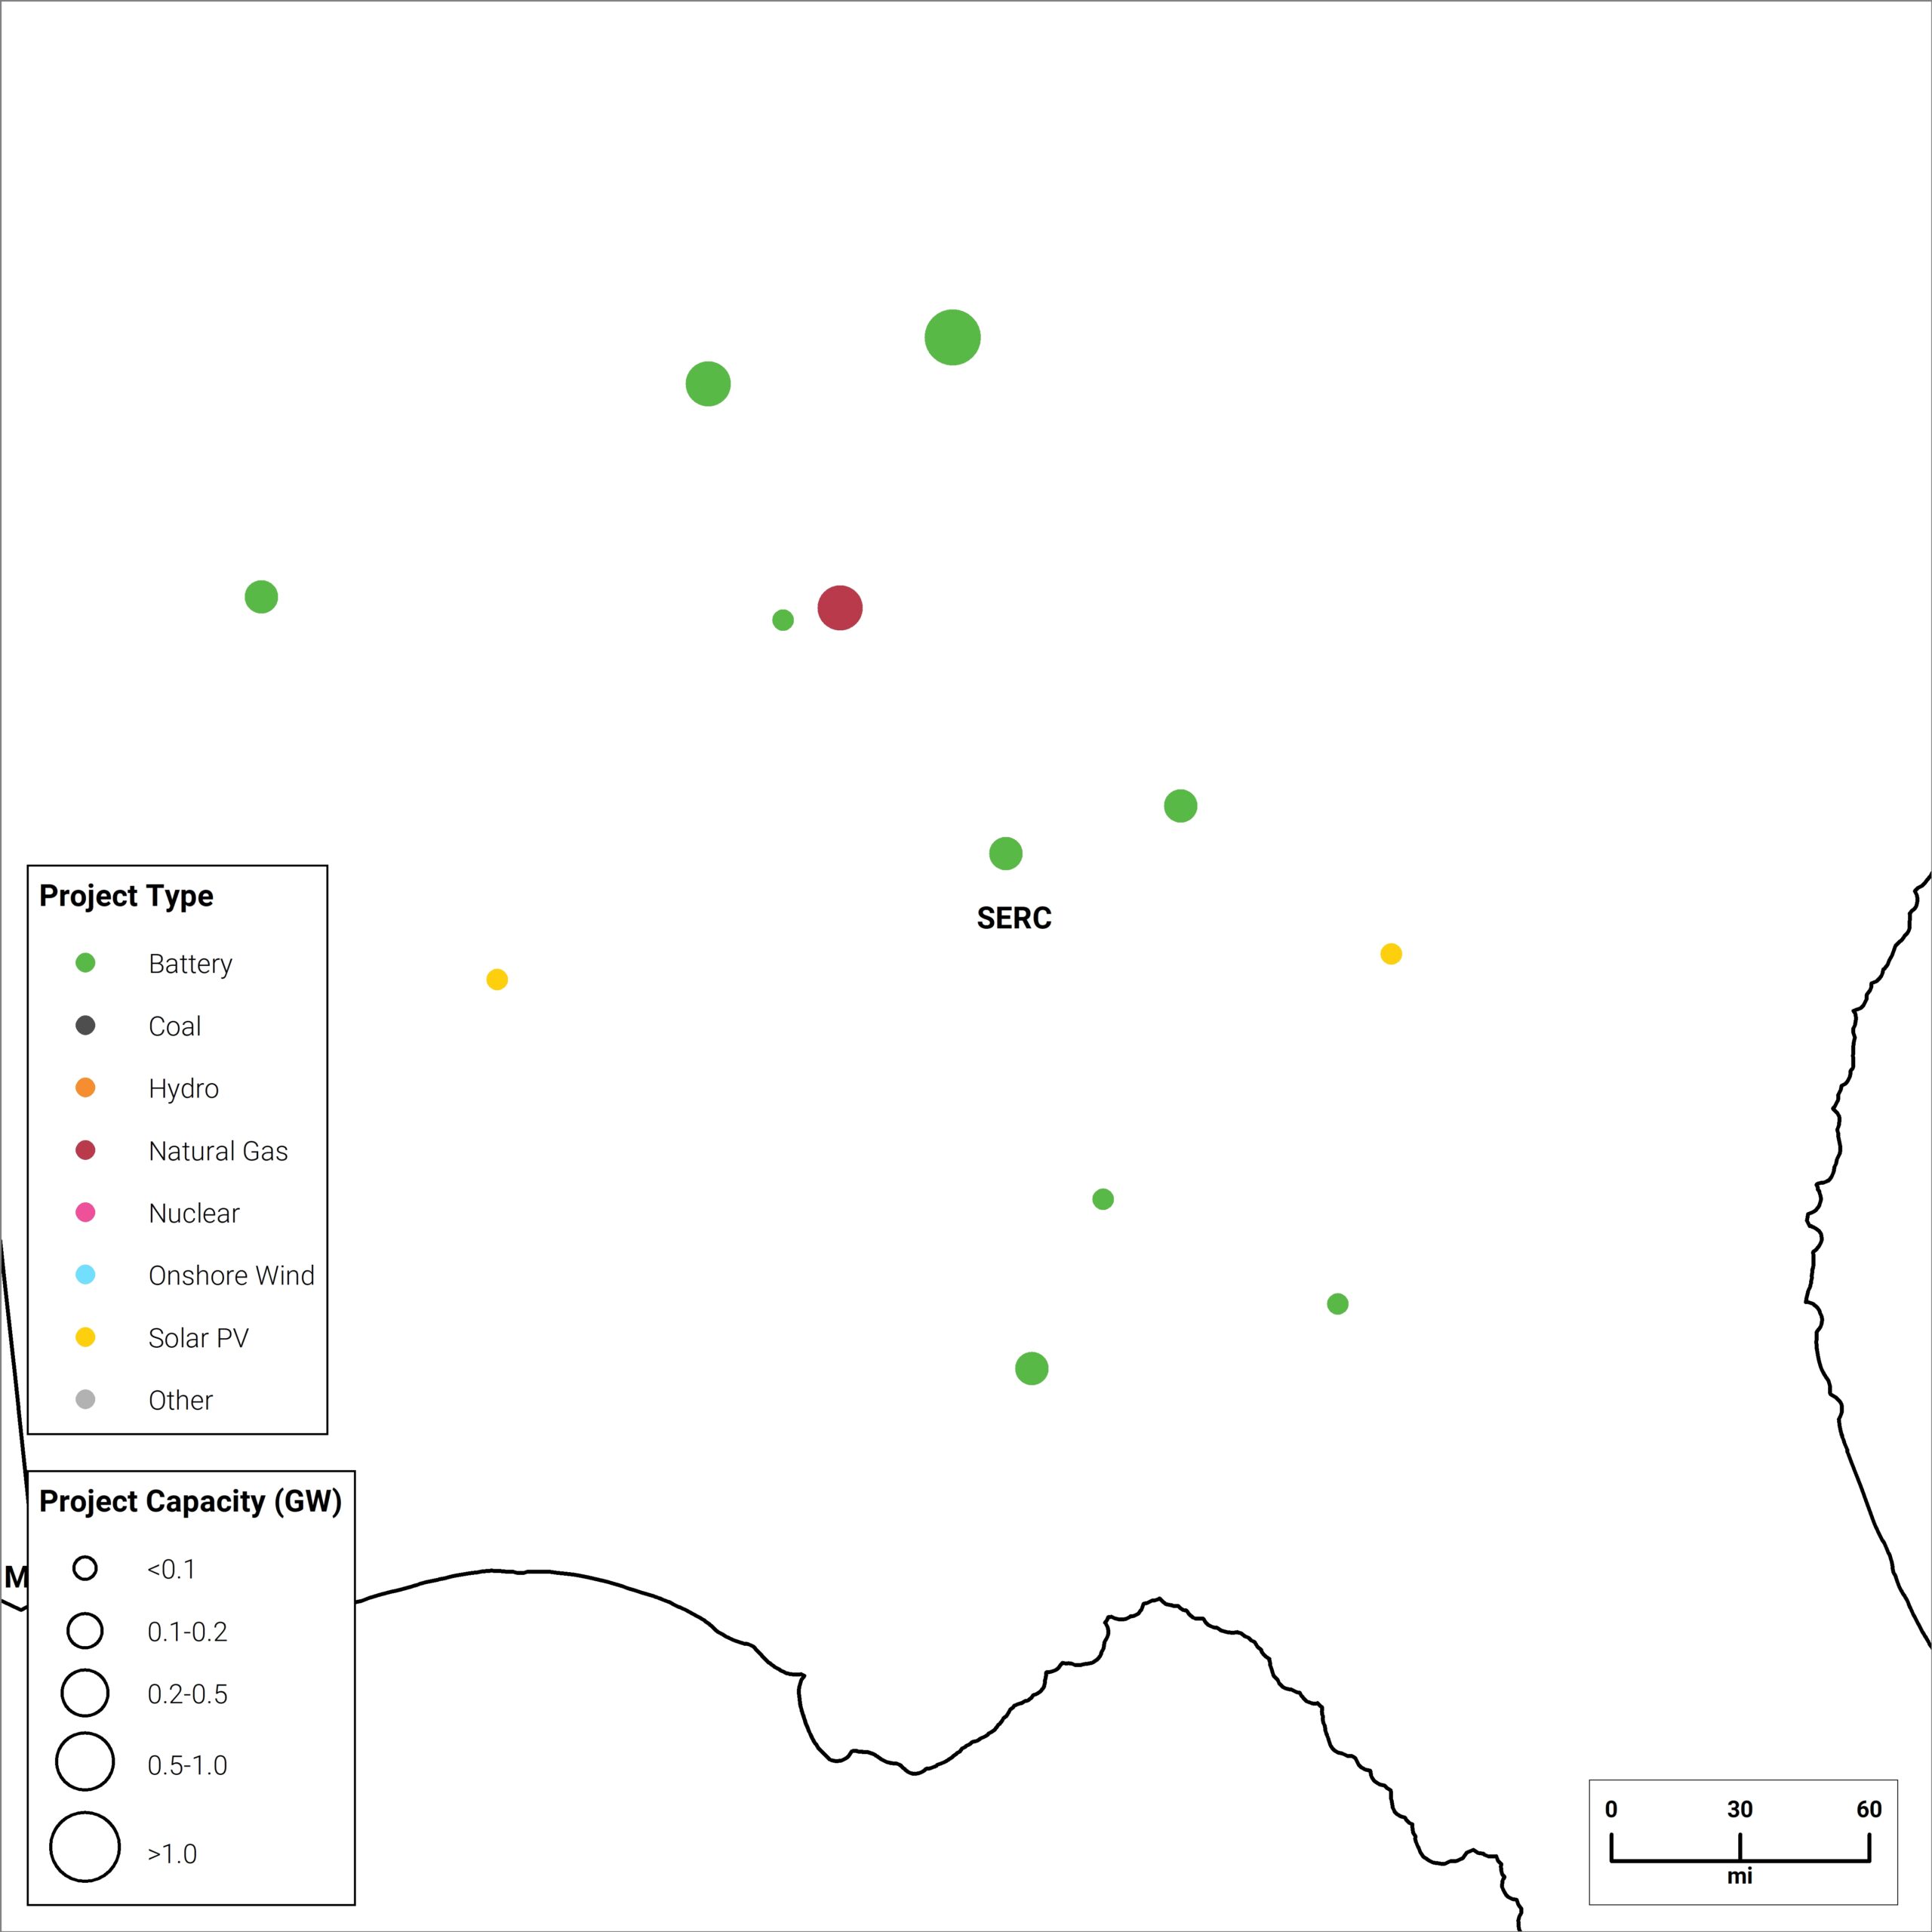
Type | 2025 New Capacity (GW) | 2026 Queued Capacity (GW) | 2026 Under Construction (GW) | 2026 Interconnection Agreement (GW) |
|---|---|---|---|---|
Solar | 0 | 0.6 | <0.1 | <0.1 |
Wind | 0 | 0 | 0 | 0 |
Battery Storage | 0 | 1.9 | 1.0 | 0.6 |
Natural Gas | <0.1 | 0.5 | 0 | 0.5 |
Source | Enverus Power & Renewables, Project Tracking Analytics
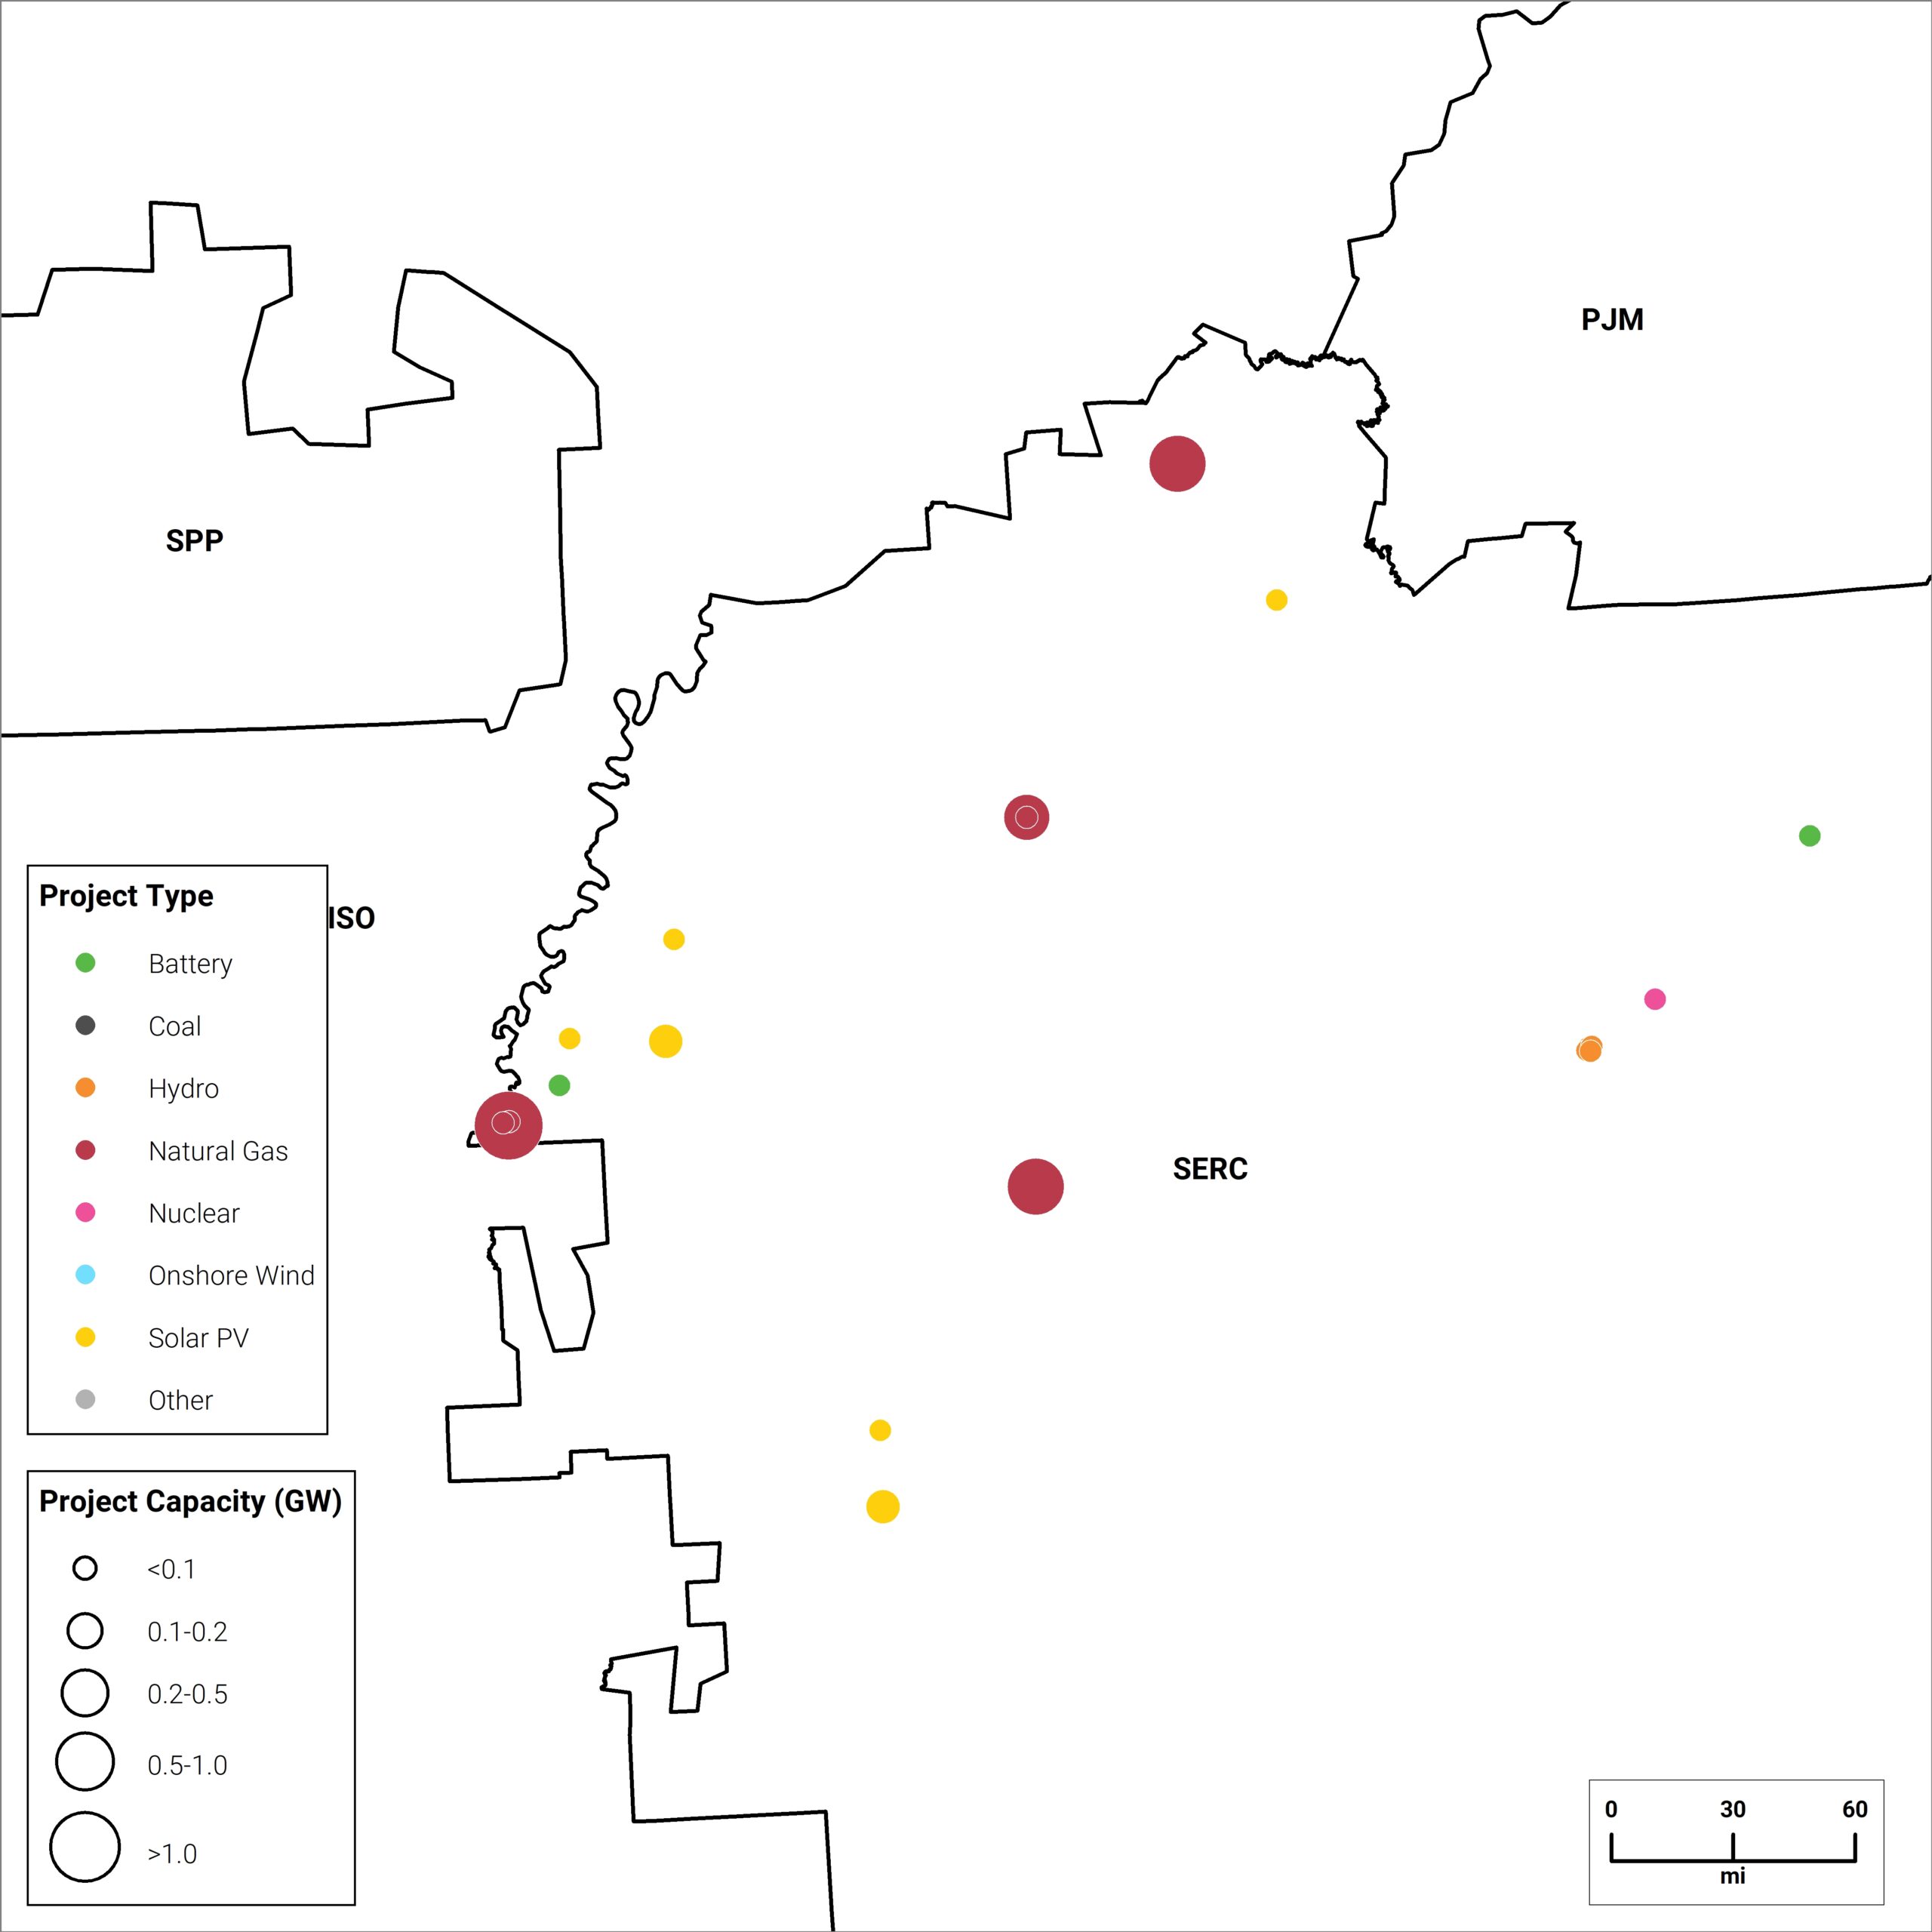
Figure 18 | Projects with 2026 Operation Dates
Type | 2025 New Capacity (GW) | 2026 Queued Capacity (GW) | 2026 Under Construction (GW) | 2026 Interconnection Agreement (GW) |
|---|---|---|---|---|
Solar | 0.2 | 7.4 | 2.3 | 0.4 |
Wind | 0 | 0 | 0 | 0 |
Battery Storage | <0.1 | 4.0 | 1.0 | 0.3 |
Natural Gas | <0.1 | 14.4 | 1.3 | 2.0 |
Source | Enverus Power & Renewables, Project Tracking Analytics
The Historic Gas Build: 2026 marks the operational peak of TVA’s massive gas expansion. The 1.4 GW Cumberland Fossil Plant gas conversion is scheduled to come online this year to replace the first of two retiring coal units. This is part of a broader $16 billion capital plan through 2027 that aims to add over 3.7 GW of new gas capacity to the system—the largest such build-out in the federal utility’s history.
Coal Political Reprieve: Following a mid-2025 shift in federal energy policy, TVA is currently evaluating life extensions for its remaining coal fleet, including units at Shawnee and Gallatin that were previously considered for 2030s retirement. While the Cumberland (2026) and Kingston (2027) retirements remain largely on track due to advanced gas construction, TVA is leveraging new federal exemptions to maintain its existing coal assets as a reliability backstop against record-setting winter peaks.
SMR Leadership: 2026 is a make-or-break year for TVA’s advanced nuclear ambitions. The Nuclear Regulatory Commission (NRC) is expected to finalize its review of the Clinch River SMR construction permit by late 2026. This project, which utilizes the GE Vernova BWRX-300 design, is positioned as the primary solution for carbon-free 24/7 power required by the region’s growing cluster of hyperscale data centers.
Winter Reliability: Following an all-time peak of >35 GW in early 2025, TVA’s 2026 Winter Outlook identifies a persistent import dependency. During extreme cold events, TVA is now forecasting a 30% chance of needing to purchase more than 6 GW from neighbors, a precarious position as neighboring PJM and MISO also face thinning margins. To mitigate this, TVA is fast-tracking 1.5 GW of battery storage targeted for 2029 and activating a new $330 million system operations center in early 2026.
Figure 19 | Projects with 2026 Operation Dates
Type | 2025 New Capacity (GW) | 2026 Queued Capacity (GW) | 2026 Under Construction (GW) | 2026 Interconnection Agreement (GW) |
|---|---|---|---|---|
Solar | 0.4 | 0.7 | 0.4 | 0.2 |
Wind | 0 | 0 | 0 | 0 |
Battery Storage | <0.1 | 0.5 | 0 | 0.1 |
Natural Gas | 0 | 6.9 | 0 | 3.1 |
Source | Enverus Power & Renewables, Project Tracking Analytics
Advanced grid insights with accurate load forecasts and extensive monitoring enhance trade execution and profitability.
Quickly identify grid opportunities and risks with high-quality mid-term forecasts, expert analysis and streamlined grid analysis.
Confidently shape your investment strategy, identify optimal power asset locations and optimize utility scale PV project profitability—all in minutes.
With Enverus Instant Analyst™, you receive answers you can trust, delivered in seconds. Sourcing from 25+ years of vetted data and research on the most trusted SaaS platform designed exclusively for energy.
Site your next data center 4x faster with Enverus. Enverus helps you cut costs, reduce risk and site with confidence.
Scenario-based forecasts that look 20 years into the future. Confidently plan around evolving grid dynamics, identify profitable opportunities and support strategic decisions with the most trusted long-term view in power.
Arm yourself with the knowledge to inform strategic decisions and grow your business with one source for insights across oil and gas, renewables, carbon capture and ESG.
Design PV Plants & Battery Storage Systems 90% Faster with Our Advanced Solar & Battery Software.
SUGAR™ helps grid operators and utilities manage increasing interconnection queue volumes by accelerating modeling and simulation studies, with up to 2x reduction in time-consuming study processes.
Unlock returns of electron and molecule-based energy transition technologies with deal insights, from power generation assets to CCUS and hydrogen.
Tune out the noise, get unbiased evaluations and uncover hidden opportunities with advice you can trust from experienced energy and power intelligence advisors.
Comprehensive coverage of power markets and insights into emerging energy technologies and project economics.
Interconnect offers developers certainty throughout the interconnection lifecycle, providing scenario analysis and risk assessment capabilities to improve the chances of deploying new projects.
Let’s get started!
Let’s get started!
We’ll follow up right away to show you a quick product tour.
Ready to Subscribe?
Ready to Get Started?