See what’s coming in ERCOT, SPP, PJM, MISO, CAISO, Mid-C, ISO-NE and NYISO

Welcome to the Winter Power Market Outlook for 2025—your essential guide to navigating the complexities of the upcoming winter power markets across key U.S. regions. As the energy landscape continues to evolve, understanding the interplay of load growth, generation shifts, planned outages, new infrastructure, policy changes and market dynamics is critical for stakeholders aiming to optimize operations, manage risks and seize opportunities.
This e-book provides a detailed, region-by-region analysis, unpacking the factors that will shape winter operations—from shifting demand driven by weather extremes and electrification to the integration of renewable energy and storage, which are reshaping grid dynamics. We explore planned outages and their congestion implications, highlight new builds and retirements that will influence supply, and examine policy developments that could redefine market rules.
Additionally, our forward-looking heat rate and price forecasts offer actionable insights to help you anticipate market trends, prepare for volatility, and make informed decisions in an increasingly dynamic energy environment.
By reading this e-book, you will gain the following key takeaways:
This Winter Outlook equips you with the insights needed to anticipate challenges, capitalize on emerging trends, and drive strategic decision-making in a rapidly changing power market landscape.
December 2025
Average 2010-2024 | December 2013 | December 2017 | December 2024 | Average | |
|---|---|---|---|---|---|
Average | 52 | 48 | 52 | 58 | 52 |
Minimum | 42 | 38 | 42 | 47 | 42 |
Maximum | 62 | 58 | 62 | 68 | 63 |
January 2026
Average 2010-2024 | January 2014 | January 2018 | January 2025 | Average | |
|---|---|---|---|---|---|
Average | 50 | 47 | 47 | 46 | 47 |
Minimum | 40 | 35 | 36 | 37 | 36 |
Maximum | 61 | 61 | 59 | 57 | 59 |
February 2026
Average 2010-2024 | February 2014 | February 2018 | February 2025 | Average | |
|---|---|---|---|---|---|
Average | 54 | 52 | 56 | 54 | 54 |
Minimum | 44 | 41 | 47 | 44 | 44 |
Maximum | 65 | 62 | 66 | 66 | 65 |
December 2025 Transmission Outages/Congestion
NCEN
BELCNTY-SALSW (138KV) shows higher post-contingency flows with an outage at GEORSO-MIDNT (138KV) between 11/21-12/31.
MRVLY-ESTLD (69KV) shows higher post-contingency flows with an outage at LENSW-FLTCK (138KV) between 11/24-12/10.
WEST/FWEST
KENDAL-KERRST (138KV) shows higher post-contingency flows with an outage at MENGCR-K0 (138KV) between 12/15/25-01/30/26.
W_BATESV-UVALDE (138KV) shows higher post-contingency flows with an outage at LYTLE2-DEVINE (69KV) between 10/01-12/16.
YELWJCKT-HEXT (69KV) shows higher post-contingency flows with an outage at BIGHIL-TWINBU (345KV) between 12/01/25-05/15/26.
COAST
LOLITA-BLESSING (138KV) shows higher post-contingency flows with an outage at KENEDSW-ROSATA (138KV) between 09/17-12/10. SCEN/SOUTH
LYTTON_S-PILOT (138KV) shows higher post-contingency flows with an outage at SWIFTE-BASTCI (345KV) between 09/16-12/31.
WINCHES-GIDEON (138KV) shows higher post-contingency flows with an outage at FPPYD2-LYTTON_S (345KV) between 11/11/25-05/15/26.
LOYOLA (138/69KV) shows higher post-contingency flows with an outage at DRSCOLS-RICRDOS (69KV) between 11/17/25-03/20/26.
January 2026 Transmission Outages/Congestion
NCEN
BELCNTY-SALSW (138KV) shows higher post-contingency flows with an outage at JOHNDU-HORNSB (345KV) between 01/06/26-01/23/26.
WEST/FWEST
KENDAL-KERRST (138KV) shows higher post-contingency flows with an outage at MENGCR-K0 (138KV) between 12/15/25-01/30/26.
BALLINGE-HUMBLTAP (138KV) shows higher post-contingency flows with an outage at BRNWD-BANGS (69KV) between 01/06/26-02/15/26.
YELWJCKT-HEXT (69KV) shows higher post-contingency flows with an outage at BIGHIL-TWINBU (345KV) between 12/01/25-05/15/26.
COAST
FRANKC-SARGNTS (69KV) shows higher post-contingency flows with an outage at CARNCS-OVILASW (69KV) between 12/11/26-02/12/26.
SCEN/SOUTH
BANDER-MASOCR (138KV) shows higher post-contingency flows with an outage at MENGCR-K0 (345/138KV) between 12/15/25-01/30/26.
LYTTON_S-PILOT (138KV) shows higher post-contingency flows with an outage at GARFIELD (345/138KV) between 01/20/26-02/06/26.
WINCHES-GIDEON (138KV) shows higher post-contingency flows with an outage at FPPYD2-LYTTON_S (345KV) between 11/11/25-05/15/26.
LOYOLA (138/69KV) shows higher post-contingency flows with an outage at DRSCOLS-RICRDOS (69KV) between 11/17/25-03/20/26.
February 2026 Transmission Outages/Congestion
NORTH/NCEN
LPLMK-LPLNE (115KV) shows higher post-contingency flows with an outage at LPLNW-LPLMD (115KV) between 02/16/26-03/06/26.
SEA (138K/69V) shows higher post-contingency flows with an outage at TMPSW-FRYSW (115KV) between 02/24/26-03/31/26.
WEST/FWEST
BALLINGE-HUMBLTAP (138KV) shows higher post-contingency flows with an outage at BRNWD-BANGS (69KV) between 01/06/26-02/15/26.
YELWJCKT-HEXT (69KV) shows higher post-contingency flows with an outage at BIGHIL-TWINBU (345KV) between 12/01/25-05/15/26.
COAST
LOLITA-BLESSING (138KV) shows higher post-contingency flows with an outage at BLESSING (345/138KV) between 02/16/26-03/17/26. SCEN/SOUTH
LA_PALMA-HAINE_DR (138KV) shows higher post-contingency flows with an outage at MV_BURNS-MV_HBRG4 (138KV) between 12/14/25-02/15/26.
LYTTON_S-PILOT (138KV) shows higher post-contingency flows with an outage at GARFIELD (345/138KV) between 01/20/26-02/06/26.
WINCHES-GIDEON (138KV) shows higher post-contingency flows with an outage at FPPYD2-LYTTON_S (345KV) between 11/11/25-05/15/26.
LOYOLA (138/69KV) shows higher post-contingency flows with an outage at DRSCOLS-RICRDOS (69KV) between 11/17/25-03/20/26.
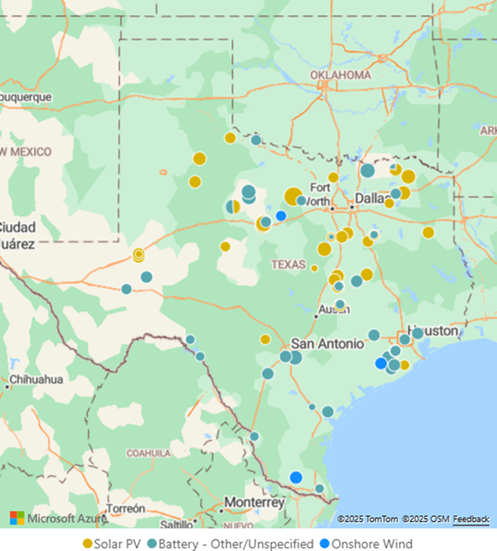
ERCOT continues to experience rapid infrastructure growth, particularly in solar and battery storage, while wind capacity remains steady. These developments are reshaping the supply stack and influencing market dynamics heading into winter 2025/26.
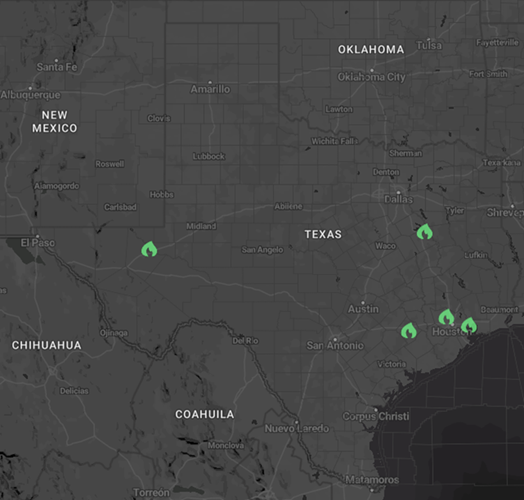
Project Name | Capacity (MW) | Company | Loan Amount |
|---|---|---|---|
Rock Island | 122 | KPUB | $105 |
TH Wharton | 456 | NRG | $216 |
Cedar Bayou | 721 | NRG | $562 |
Pin Oak Creek | 460 | Calpine | $278 |
Basin Ranch | 1,350 | CPV | $1,120 |
Most of these projects were already in early development prior to TEF legislation and are expected to cover up to 60% of their costs through the fund.
A major market evolution is underway in ERCOT with the launch of RTC+B, scheduled to go live in December 2025. This initiative marks a significant shift in how ancillary services and energy are priced and dispatched in real time, with direct implications for battery economics, price formation and market behavior.
What RTC+B Changes
Impacts by Stakeholder Type
Stakeholder | Impact of RTC+B |
|---|---|
Battery Operators | Battery Operators Biggest winner. Can monetize entire capacity across multiple AS + energy in same hour; reduced risk causes more aggressive DA participation; drives downward pressure on reg prices |
Conventional Generators | Value of optionality increases; DA offers start embedding explicit opportunity cost of choosing AS vs energy |
Traders | AS becomes a tradable financial product, new arbitrage opportunities and tighter spreads;
improved efficiency reduces volatility, not opportunity
|
Renewable Assets | Minimal DAM behavior change; better RT efficiency can reduce curtailment noise but does not change offer strategy |
Retail | Stay DAM-heavy due to volatility risk; DSM / VPP participation increases strategic reserve bidding and adds competition and downward pressure on AS prices
|
Join us for a data-driven webinar forecasting RTC+B’s rollout and its ripple effects across ERCOT—equipping traders, developers and operators with day-one insights to navigate shifting market dynamics, dispatch patterns, pricing signals and potential volatility. You’ll gain a week-one snapshot from our proprietary models, a months-ahead outlook based on back-tests, macro trends and scenario triggers, plus actionable strategies for optimization and risk management, capped by a live Q&A with industry experts before go-live. Reserve your spot now.

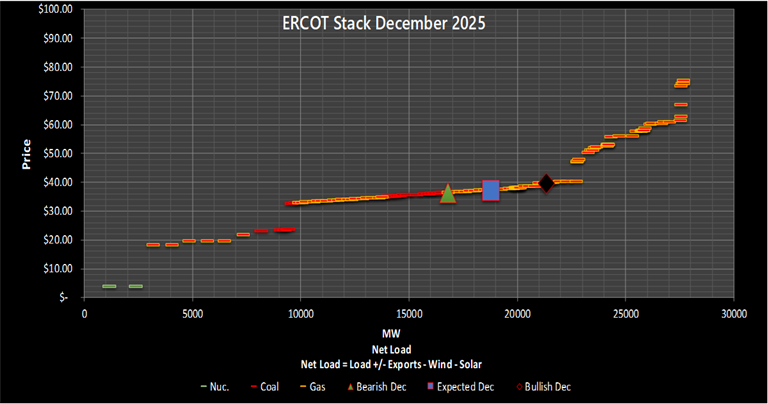
December 2025
Price | Bearish | Expected | Bullish |
|---|---|---|---|
Enverus Price Forecast | $36.47 | $37.46 | $39.90 |
Enverus Heat-Rate Forecast | 9.4 | 9.7 | 10.3 |
Forward Heat-Rates | 10.3 | 10.3 | 10.3 |
January 2026
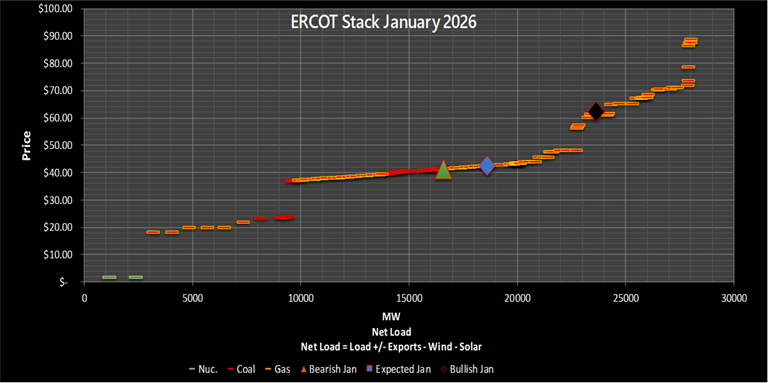
Price | Bearish | Expected | Bullish |
|---|---|---|---|
Enverus Price Forecast | $44.41 | $45.60 | $65.39 |
Enverus Heat-Rate Forecast | 10.7 | 11.0 | 15.8 |
Forward Heat-Rates | 15.0 | 15.0 | 15.0 |
February 2026
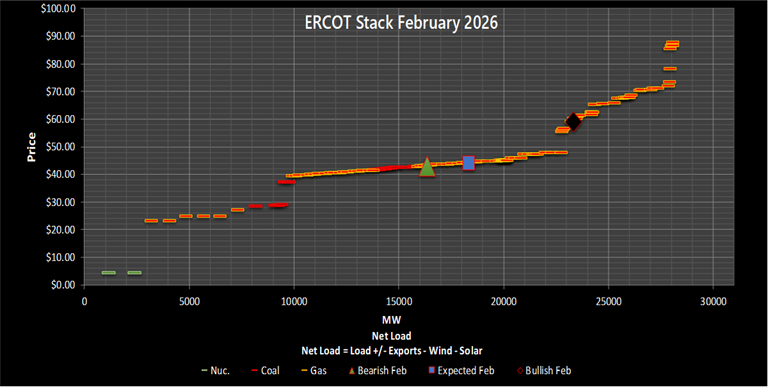
Price | Bearish | Expected | Bullish |
|---|---|---|---|
Enverus Price Forecast | $41.22 | $42.30 | $57.12 |
Enverus Heat-Rate Forecast | 10.5 | 10.8 | 14.6 |
Forward Heat-Rates | 16.1 | 16.1 | 16.1 |
December 2025
Average 2010-2024 | December 2013 | December 2017 | December 2024 | Average | |
|---|---|---|---|---|---|
Average | 36 | 32 | 33 | 37 | 34 |
Minimum | 26 | 26 | 26 | 30 | 27 |
Maximum | 46 | 43 | 41 | 45 | 43 |
January 2026
Average 2010-2024 | January 2014 | January 2018 | January 2025 | Average | |
|---|---|---|---|---|---|
Average | 33 | 25 | 30 | 28 | 28 |
Minimum | 26 | 16 | 21 | 21 | 19 |
Maximum | 46 | 34 | 39 | 35 | 36 |
February 2026
Average 2010-2024 | February 2014 | February 2018 | February 2025 | Average | |
|---|---|---|---|---|---|
Average | 37 | 28 | 39 | 34 | 34 |
Minimum | 26 | 20 | 48 | 27 | 32 |
Maximum | 48 | 37 | 39 | 42 | 39 |
December 2025 Transmission Outages/Congestion
NCEN
BELCNTY-SALSW (138KV) shows higher post-contingency flows with an outage at GEORSO-MIDNT (138KV) between 11/21-12/31.
MRVLY-ESTLD (69KV) shows higher post-contingency flows with an outage at LENSW-FLTCK (138KV) between 11/24-12/10.
WEST/FWEST
KENDAL-KERRST (138KV) shows higher post-contingency flows with an outage at MENGCR-K0 (138KV) between 12/15/25-01/30/26.
W_BATESV-UVALDE (138KV) shows higher post-contingency flows with an outage at LYTLE2-DEVINE (69KV) between 10/01-12/16.
YELWJCKT-HEXT(69KV) shows higher post-contingency flows with an outage at BIGHIL-TWINBU (345KV) between 12/01/25-05/15/26.
COAST
LOLITA-BLESSING (138KV) shows higher post-contingency flows with an outage at KENEDSW-ROSATA (138KV) between 09/17-12/10. SCEN/SOUTH
LYTTON_S-PILOT (138KV) shows higher post-contingency flows with an outage at SWIFTE-BASTCI (345KV) between 09/16-12/31.
WINCHES-GIDEON (138KV) shows higher post-contingency flows with an outage at FPPYD2-LYTTON_S (345KV) between 11/11/25-05/15/26.
LOYOLA (138/69KV) shows higher post-contingency flows with an outage at DRSCOLS-RICRDOS (69KV) between 11/17/25-03/20/26.
January 2026 Transmission Outages/Congestion
NCEN
BELCNTY-SALSW (138KV) shows higher post-contingency flows with an outage at JOHNDU-HORNSB (345KV) between 01/06/26-01/23/26.
WEST/FWEST
KENDAL-KERRST (138KV) shows higher post-contingency flows with an outage at MENGCR-K0 (138KV) between 12/15/25-01/30/26.
BALLINGE-HUMBLTAP (138KV) shows higher post-contingency flows with an outage at BRNWD-BANGS (69KV) between 01/06/26-02/15/26.
YELWJCKT-HEXT (69KV) shows higher post-contingency flows with an outage at BIGHIL-TWINBU (345KV) between 12/01/25-05/15/26.
COAST
FRANKC-SARGNTS (69KV) shows higher post-contingency flows with an outage at CARNCS-OVILASW (69KV) between 12/11/26-02/12/26.
SCEN/SOUTH
BANDER-MASOCR (138KV) shows higher post-contingency flows with an outage at MENGCR-K0 (345/138KV) between 12/15/25-01/30/26.
LYTTON_S-PILOT (138KV) shows higher post-contingency flows with an outage at GARFIELD (345/138KV) between 01/20/26-02/06/26.
WINCHES-GIDEON (138KV) shows higher post-contingency flows with an outage at FPPYD2-LYTTON_S (345KV) between 11/11/25-05/15/26.
LOYOLA (138/69KV) shows higher post-contingency flows with an outage at DRSCOLS-RICRDOS (69KV) between 11/17/25-03/20/26.
February 2026 Transmission Outages/Congestion
NCEN
BELCNTY-SALSW (138KV) shows higher post-contingency flows with an outage at GEORSO-MIDNT (138KV) between 11/21-12/31.
MRVLY-ESTLD (69KV) shows higher post-contingency flows with an outage at LENSW-FLTCK (138KV) between 11/24-12/10.
WEST/FWEST
KENDAL-KERRST (138KV) shows higher post-contingency flows with an outage at MENGCR-K0 (138KV) between 12/15/25-01/30/26.
W_BATESV-UVALDE (138KV) shows higher post-contingency flows with an outage at LYTLE2-DEVINE (69KV) between 10/1-12/16.
YELWJCKT-HEXT (69KV) shows higher post-contingency flows with an outage at BIGHIL-TWINBU (345KV) between 12/01/25-05/15/26.
COAST
LOLITA-BLESSING (138KV) shows higher post-contingency flows with an outage at KENEDSW-ROSATA (138KV) between 09/17-12/10. SCEN/SOUTH
LYTTON_S-PILOT (138KV) shows higher post-contingency flows with an outage at SWIFTE-BASTCI (345KV) between 09/16-12/31.
WINCHES-GIDEON (138KV) shows higher post-contingency flows with an outage at FPPYD2-LYTTON_S (345KV) between 11/11/25-05/15/26.
LOYOLA (138/69KV) shows higher post-contingency flows with an outage at DRSCOLS-RICRDOS (69KV) between 11/17/25-03/20/26.
New Builds:
Retirements:
Transmission-Linked Development:
December 2025
Price | Bearish | Expected | Bullish |
|---|---|---|---|
Enverus Price Forecast | $26.00 | $48.64 | $50.72 |
Enverus Heat-Rate Forecast | 7.2 | 13.5 | 14.1 |
Forward Heat-Rates | 12.9 | 12.9 | 12.9 |
January 2026
Price | Bearish | Expected | Bullish |
|---|---|---|---|
Enverus Price Forecast | $74.01 | $52.18 | $59.74 |
Enverus Heat-Rate Forecast | 11.8 | 13.1 | 15.0 |
Forward Heat-Rates | 16.4 | 16.4 | 16.4 |
February 2026
Price | Bearish | Expected | Bullish |
|---|---|---|---|
Enverus Price Forecast | $26.00 | $54.42 | $61.77 |
Enverus Heat-Rate Forecast | 6.9 | 14.4 | 16.4 |
Forward Heat-Rates | 15.1 | 15.1 | 15.1 |
December 2025
Average 2010-2024 | December 2013 | December 2017 | December 2024 | Average | |
|---|---|---|---|---|---|
Average | 38 | 32 | 33 | 37 | 34 |
Minimum | 31 | 26 | 26 | 30 | 27 |
Maximum | 45 | 43 | 41 | 45 | 43 |
January 2026
Average 2010-2024 | January 2014 | January 2018 | January 2025 | Average | |
|---|---|---|---|---|---|
Average | 33 | 25 | 30 | 28 | 28 |
Minimum | 23 | 16 | 21 | 21 | 19 |
Maximum | 46 | 34 | 39 | 35 | 36 |
February 2026
Average 2010-2024 | February 2014 | February 2018 | February 2025 | Average | |
|---|---|---|---|---|---|
Average | 29 | 28 | 39 | 34 | 34 |
Minimum | 22 | 20 | 29 | 27 | 32 |
Maximum | 36 | 37 | 48 | 42 | 39 |
December 2025 Transmission Outages/Congestion
For the duration of the winter Conaston-Ottercreek line will be undergoing an outage (11/3-7/31) increasing constrained flows for MANOR-GRACE. A supply imbalance favoring Wildcat & Brunner Island over Brandon Shores sends a rush of megawatts into the PA/ MD border resulting in binding on this element. It gives a slight tick up to WHUB but has more of a bearish impact on NJ HUB.
Our flow analysis suggests rising congestion at the AEP–Dominion Transfer Interface in December, driven by the 765 kV Belmont– Mount line outage (Dec. 1–19) and strong winter demand in Dominion, which encourages coal imports from West Virginia into southern Virginia—placing additional strain on the interface. When binding, it discounts WHUB.
The northern Richmond area will be a bottleneck for east-west flows specifically for SANN-LOUIS as the Ladysmith-Possumpoint line is undergoing work (12/8-12/12). It is bearish DOM HUB during periods when Louisa is offline and when demand in the Dominion footprint is underperforming.
January 2026 Transmission Outages/Congestion
The Braid-EFRN line will be taken out of service (1/23-1/30) which increases congestion risk for ELWO-GOOD and ideal conditions for strong shadow prices, Elwood & Jackson CTs online and elevated demand in Comed. When binding, it is bearish NIHUB.
West-to-east flows across central Pennsylvania are expected to be prominent during the Aspen–Roxbury line outage (Jan. 5–9, Jan. 12–16), heightening sensitivity on the SHAD-ROX path. A favorable setup would include Cardinal coal unit online, paired with weak Pittsburgh demand and stronger loads around Harrisburg.
Early in the month the Pleas-Ashburn line will be undergoing an outage (1/4-1/8) increasing constrained flows for BRAM-POLA. Strong coal imports from West Virginia and weak thermal generation in Baltimore/D.C. area create additional strain.
February 2026 Transmission Outages/Congestion
Conditions are ideal for PLEAS–ASHB congestion, with strong Dominion demand in the 17–18 GW range and elevated coal-fired imports from West Virginia.
At the PA/MD border, CONA-NRTH remains a key congestion driver due to the ongoing Conaston–Northwest line outage (Jan. 4–May 9). This is a dual-circuit line with one segment out of service, increasing flow on the remaining in-service circuit. The constraint tends to bind when strong thermal generation is present in eastern Pennsylvania, paired with weaker sink-side output from Brandon Shores and Keys. This supply imbalance amplifies north-to-south flows across the PA/MD border, and when the constraint binds, it provides upward support to WHUB.
The upcoming Olive–Olive University Park line outage (Feb. 5 – May 22) increases congestion risk around the STILL–DUMO interface—particularly on windy days in ComEd. The risk is elevated when thermal generation on the eastern shore of Lake Michigan is outpaced by stronger output from the western shore.
New Builds
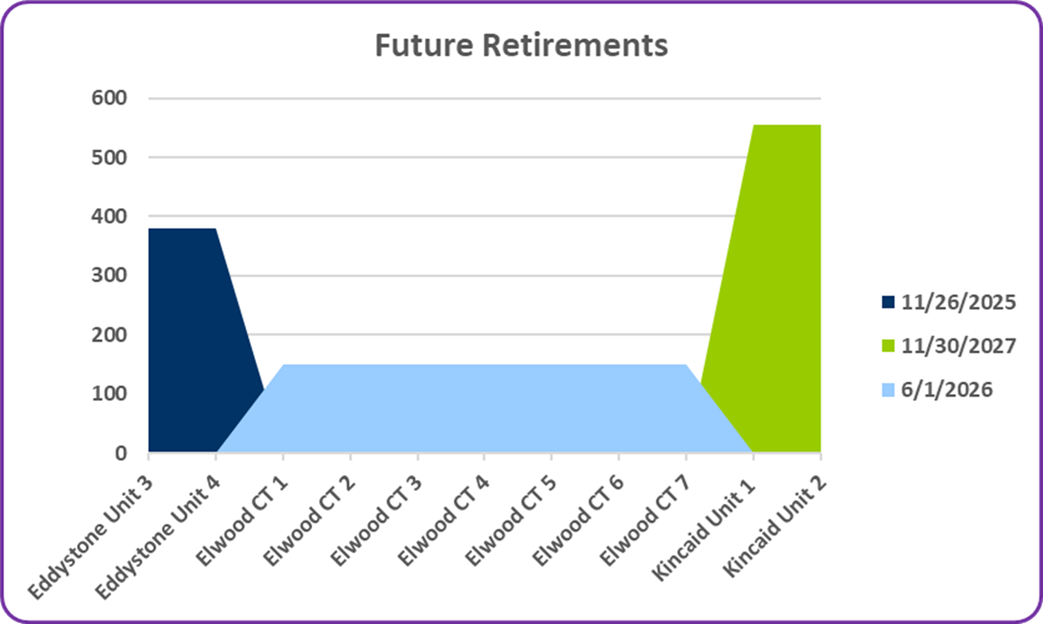
Retirements
Looking ahead:
Kincaid units are expected to retire in 2027.
Transmission Developments
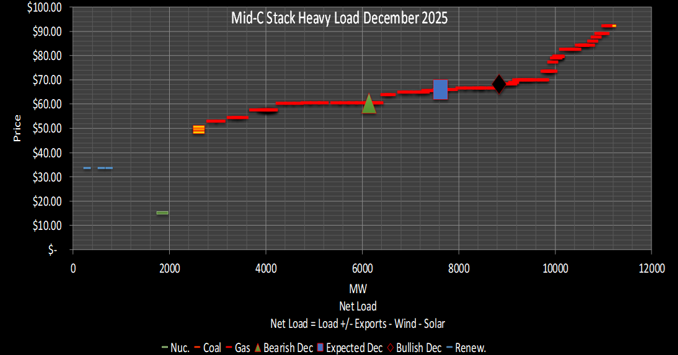
December 2025
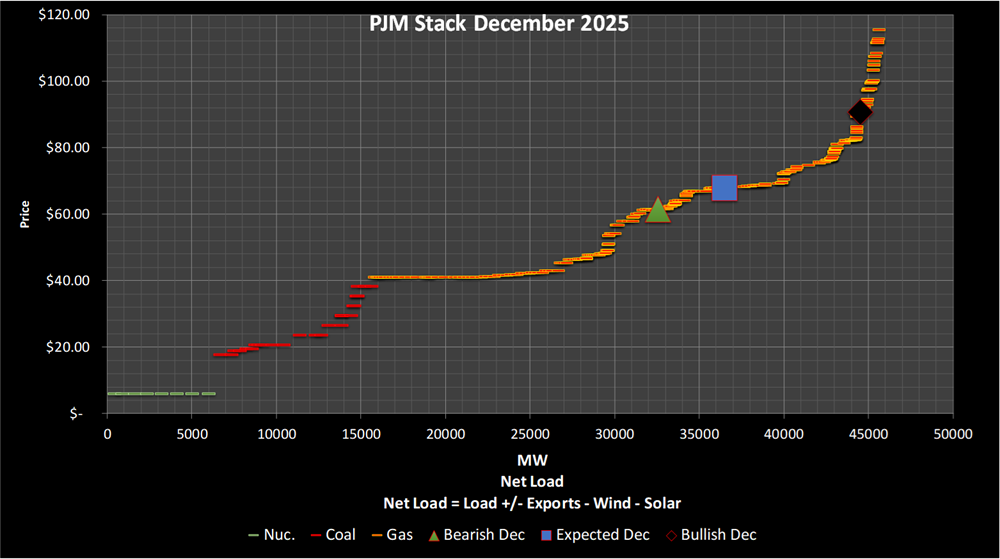
Price | Bearish | Expected | Bullish |
|---|---|---|---|
Enverus Price Forecast | $61.25 | $67.87 | $90.58 |
Enverus Heat-Rate Forecast | 12.7 | 14.1 | 18.8 |
Forward Heat-Rates | 12.5 | 12.5 | 12.5 |
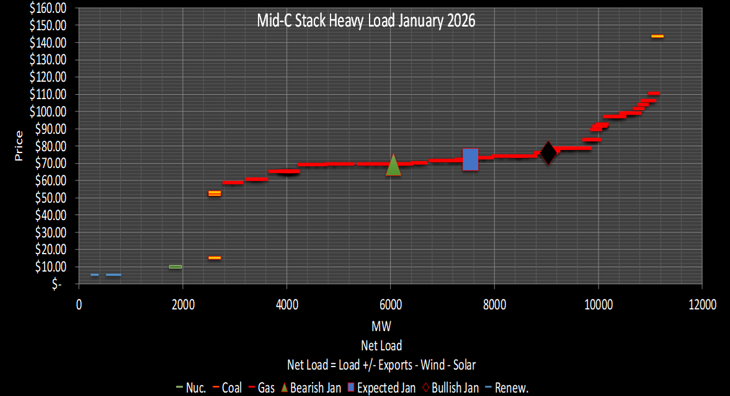
January 2026
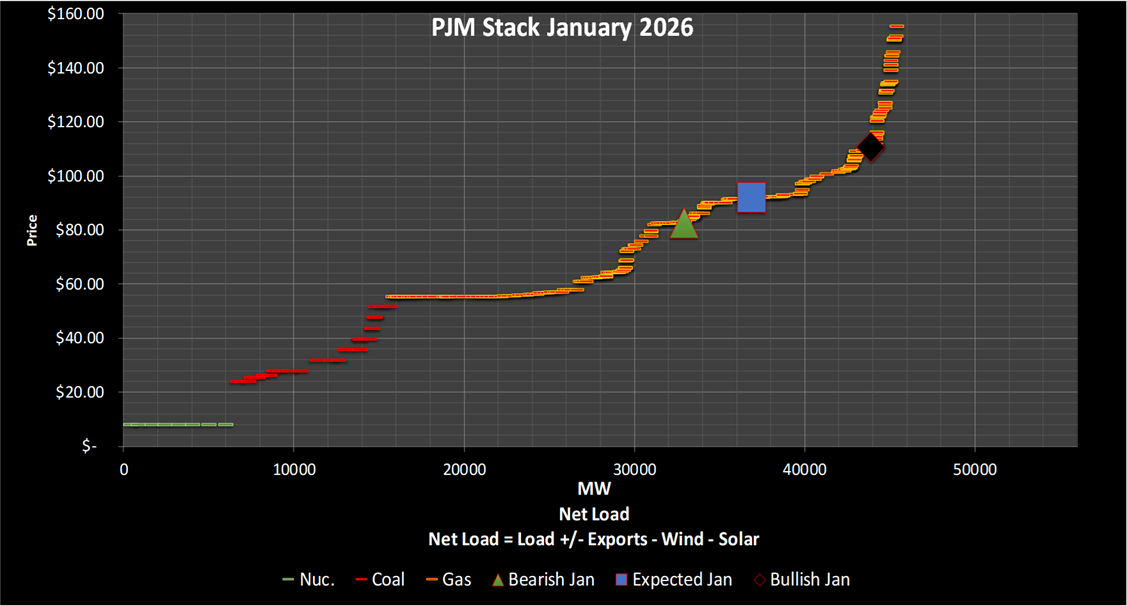
Price | Bearish | Expected | Bullish |
|---|---|---|---|
Enverus Price Forecast | $82.87 | $91.55 | $110.68 |
Enverus Heat-Rate Forecast | 10.6 | 11.7 | 14.1 |
Forward Heat-Rates | 10.3 | 10.3 | 10.3 |
February 2026
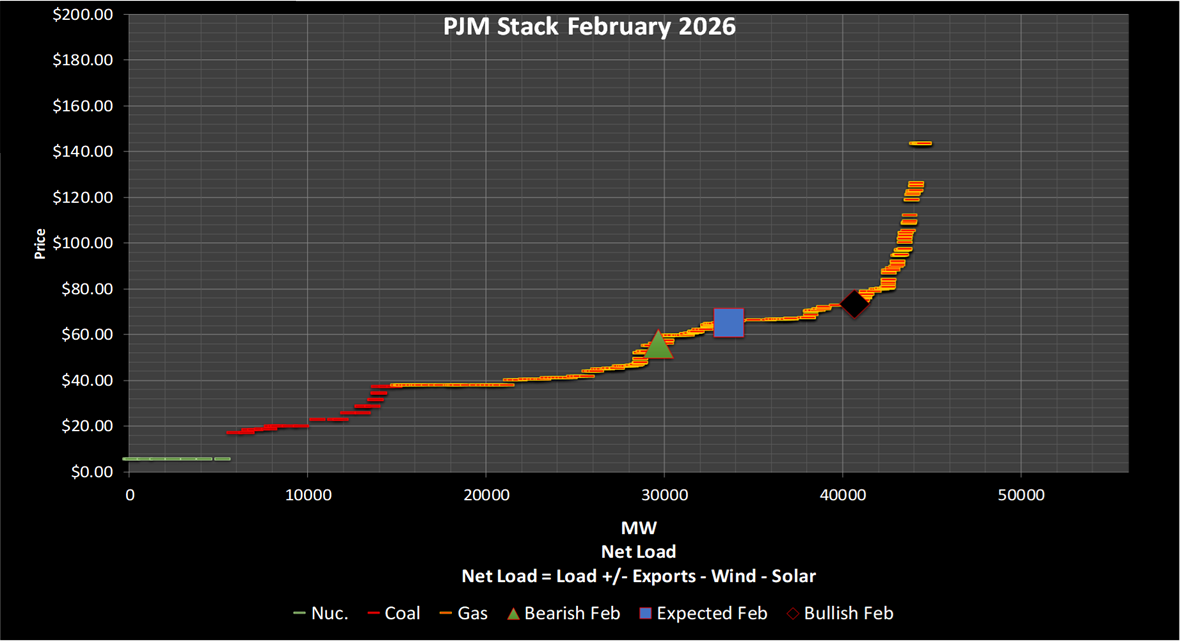
Price | Bearish | Expected | Bullish |
|---|---|---|---|
Enverus Price Forecast | $56.34 | $65.42 | $73.70 |
Enverus Heat-Rate Forecast | 8.4 | 9.8 | 11.0 |
Forward Heat-Rates | 10.4 | 10.4 | 10.4 |
December 2025
Average 2010-2024 | December 2013 | December 2017 | December 2024 | Average | |
|---|---|---|---|---|---|
Average | 33 | 28 | 30 | 36 | 31 |
Minimum | 26 | 21 | 23 | 30 | 24 |
Maximum | 40 | 36 | 38 | 42 | 39 |
January 2026
Average 2010-2024 | January 2014 | January 2018 | January 2025 | Average | |
|---|---|---|---|---|---|
Average | 29 | 21 | 27 | 26 | 25 |
Minimum | 21 | 11 | 18 | 18 | 16 |
Maximum | 36 | 32 | 36 | 35 | 34 |
February 2026
Average 2010-2024 | February 2014 | February 2018 | February 2025 | Average | |
|---|---|---|---|---|---|
Average | 32 | 24 | 34 | 31 | 30 |
Minimum | 24 | 15 | 25 | 23 | 21 |
Maximum | 41 | 33 | 43 | 40 | 39 |
December 2025 Transmission Outages/Congestion
A 345 KV line outage near Eau Claire Corridor in WI from 11/01–12/30 with strong wind production in ALTW, MEC during high NSP demand increasing the flow on element REDROCK-WOODBRY (115KV) in NSP. It will be bullish for MN HUB prices.
A 161 KV line outage near Yellville Corridor in AR from 10/7/25-02/06/26 with strong natural gas generation in EES, EAI during low demand in EES is increasing the flow on element HILLTOP_ST_JOE_E (161KV) in EAI. It will be bearish for AR hub prices.
A 161 KV line outage near Auburn Corridor in NE from 12/10-12/19 with strong wind generation in WR, OKGE during strong demand in OPPD, MEC is increasing the flow on element NEBRCTY-SUB3456 (345KV) in OPPD. It will be bullish for MN hub prices.
January 2026 Transmission Outages/Congestion
A 345 KV line outage near Cold Spring Corridor in MN from 01/22/26–03/06/26 with strong North Dakota wind generation relative to MISO North during strong demand in NSP, OTP is increasing the flow on element FARGO-SHEYNNE (230KV) in WAUE. It will be bullish for MN hub prices.
A 161 KV line outage near Berryville Corridor in AR from 12/06/25-01/21/26 with strong natural gas generation in EES, EAI during low demand in EES is increasing the flow on element HILLTOP_ST_JOE_E (161KV) in EAI. It will be bearish for AR hub prices.
A 345KV line outage near Chicago Heights Corridor in IL from 11/20/2025–05/22/2026 with strong wind generation in ALTW, MEC during strong demand period in AEP, ONT, NIPS increasing the flow on element CHICAGO-PRAX (138KV) in NIPS. It will be bullish for IN, MI hubs and bearish for MN hub prices.
February 2026 Transmission Outages/Congestion
A 345 KV line outage near Cold Spring Corridor in MN from 01/22/26–03/06/26 with strong North Dakota wind generation relative to MISO North during strong demand in NSP, OTP is increasing the flow on element FARGO-SHEYNNE (230KV) in WAUE. It will be bullish for MN hub prices.
A 345KV line outage near Chicago Heights Corridor in IL from 11/20/2025–05/22/2026 with strong wind generation in ALTW, MEC during strong demand period in AEP, ONT, NIPS increasing the flow on element CHICAGO-PRAX (138KV) in NIPS. It will be bullish for IN, MI hubs and bearish for MN hub prices.
New Builds
Petersburg Solar Project:
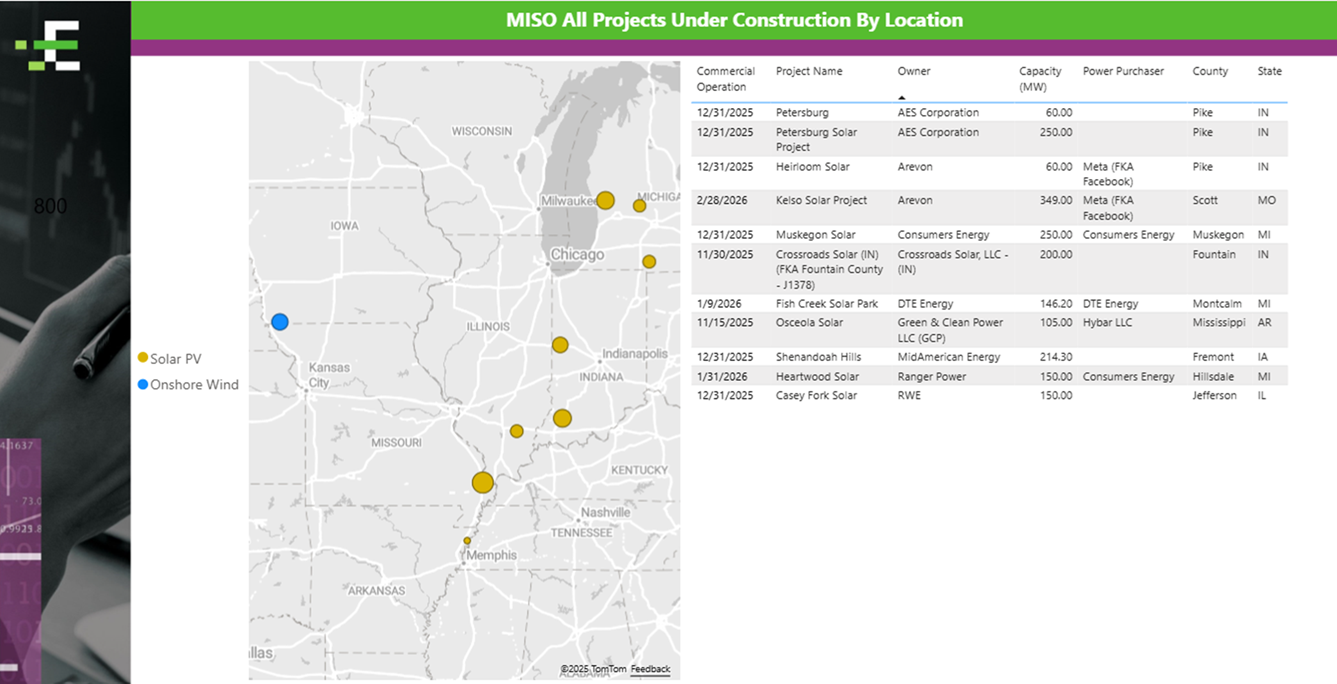
Retirements
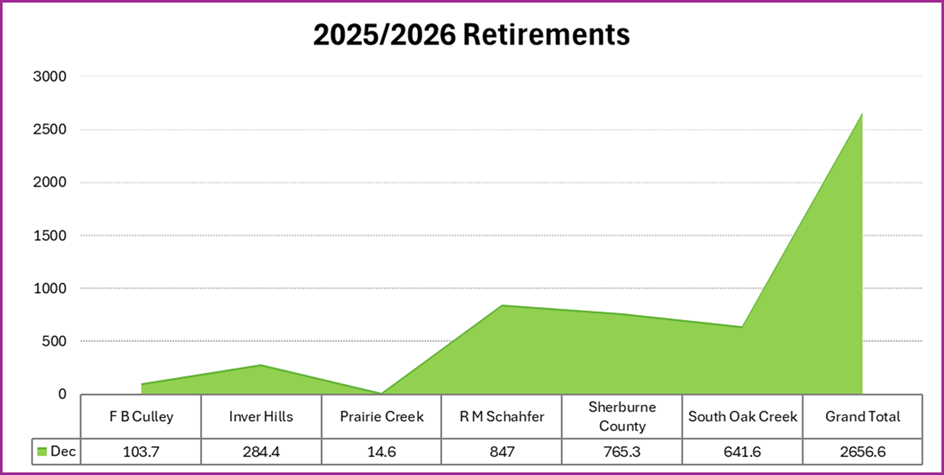
Approximately 2.5 GW of coal generation is scheduled to retire by the end of December 2025, including the R.M. Schahfer units.
Sherburne County units are also slated for retirement, which will ease west-to-east flow patterns and reduce congestion risks around Lake Michigan.
J.H. Campbell received an extension through Nov. 19, 2025, and could remain online through winter given its importance as a baseload resource.
December 2025
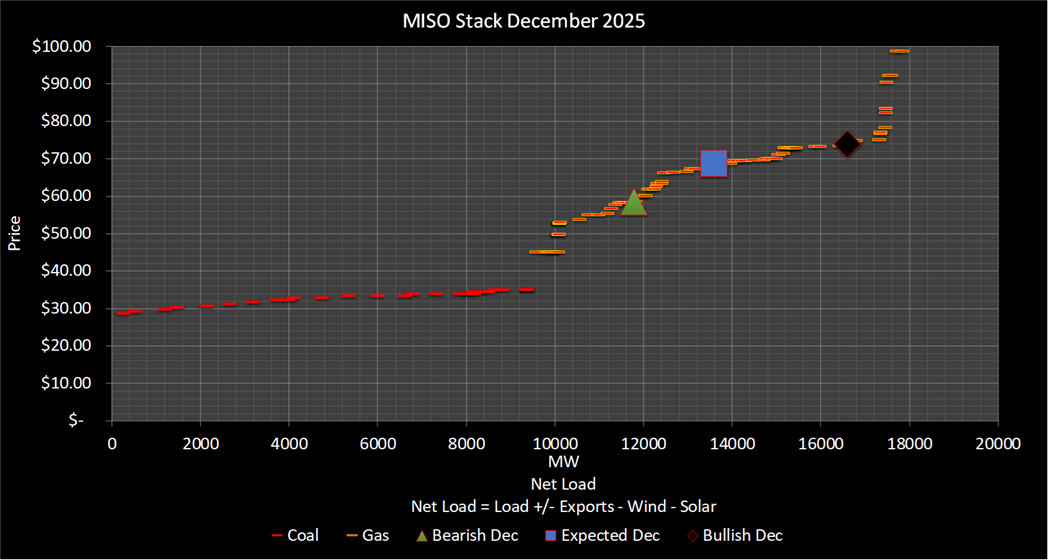
Price | Bearish | Expected | Bullish |
|---|---|---|---|
Enverus Price Forecast | $58.25 | $68.46 | $73.99 |
Enverus Heat-Rate Forecast | 14.2 | 16.7 | 18.0 |
Forward Heat-Rates | 13.6 | 13.6 | 13.6 |
January 2026
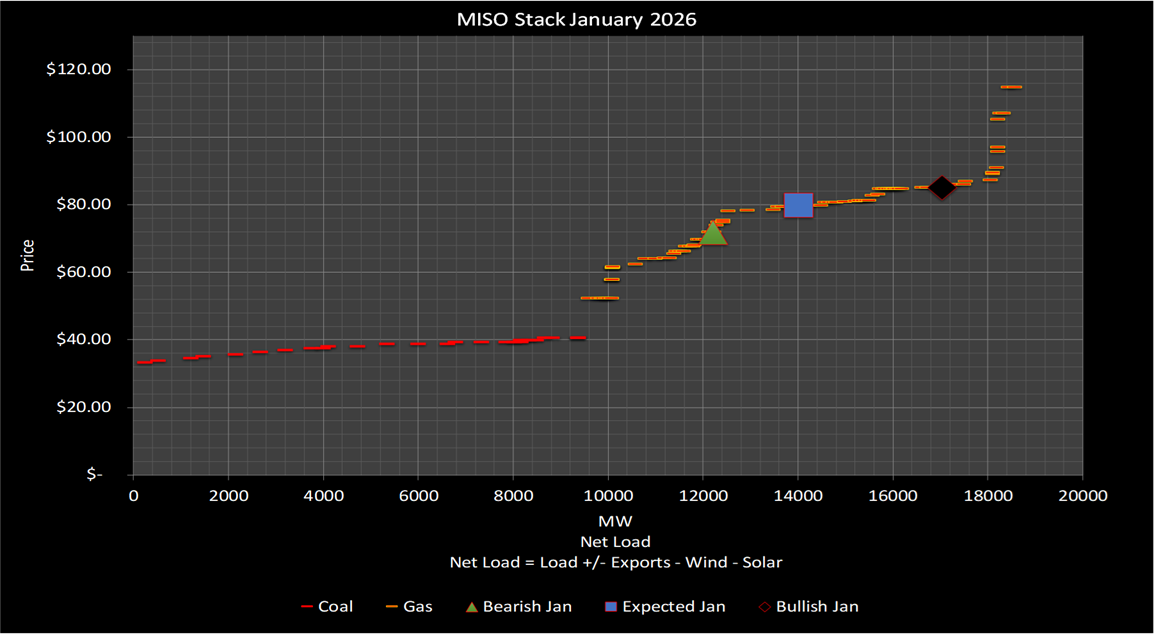
Price | Bearish | Expected | Bullish |
|---|---|---|---|
Enverus Price Forecast | $71.95 | $80.09 | $85.16 |
Enverus Heat-Rate Forecast | 14.7 | 16.4 | 17.4 |
Forward Heat-Rates | 14.9 | 14.9 | 14.9 |
February 2026
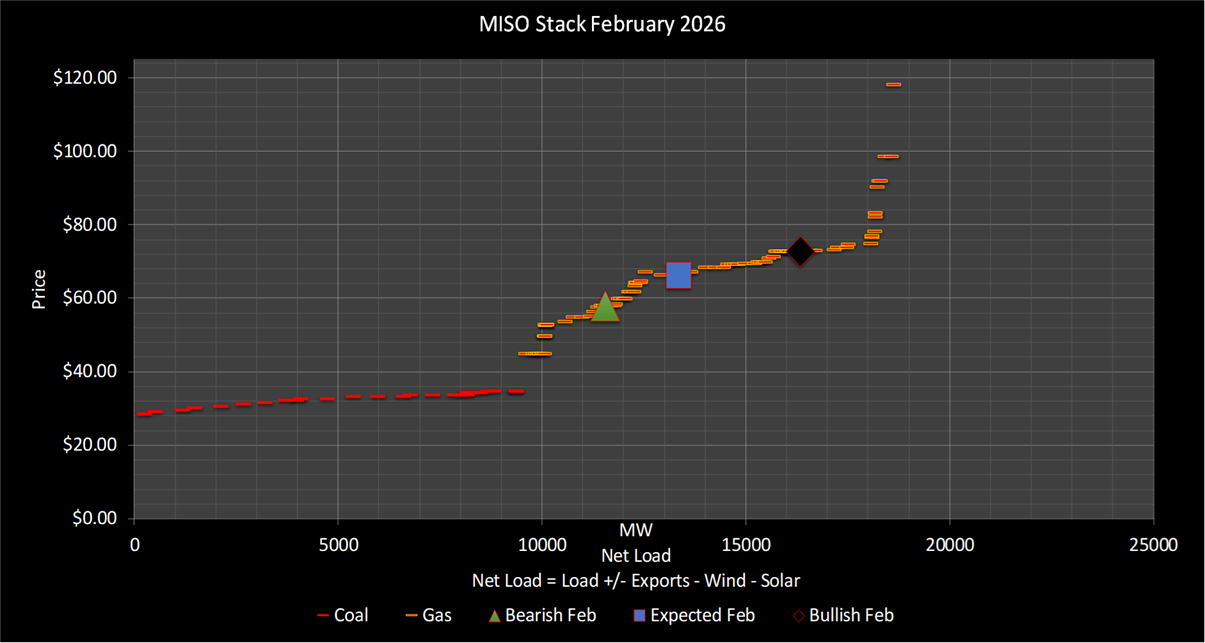
Price | Bearish | Expected | Bullish |
|---|---|---|---|
Enverus Price Forecast | $58.10 | $67.27 | $72.75 |
Enverus Heat-Rate Forecast | 12.3 | 14.3 | 15.5 |
Forward Heat-Rates | 13.3 | 13.3 | 13.3 |
December 2025
Average 2010-2024 | December 2013 | December 2017 | December 2024 | Average | |
|---|---|---|---|---|---|
Average | 53 | 55 | 56 | 56 | 56 |
Minimum | 44 | 42 | 44 | 46 | 44 |
Maximum | 62 | 66 | 68 | 66 | 67 |
January 2026
Average 2010-2024 | January 2014 | January 2018 | January 2025 | Average | |
|---|---|---|---|---|---|
Average | 54 | 58 | 57 | 53 | 56 |
Minimum | 45 | 46 | 47 | 43 | 47 |
Maximum | 63 | 70 | 67 | 65 | 67 |
February 2026
Average 2010-2024 | February 2014 | February 2018 | February 2025 | Average | |
|---|---|---|---|---|---|
Average | 56 | 58 | 56 | 56 | 57 |
Minimum | 46 | 49 | 46 | 46 | 47 |
Maximum | 65 | 67 | 66 | 66 | 66 |
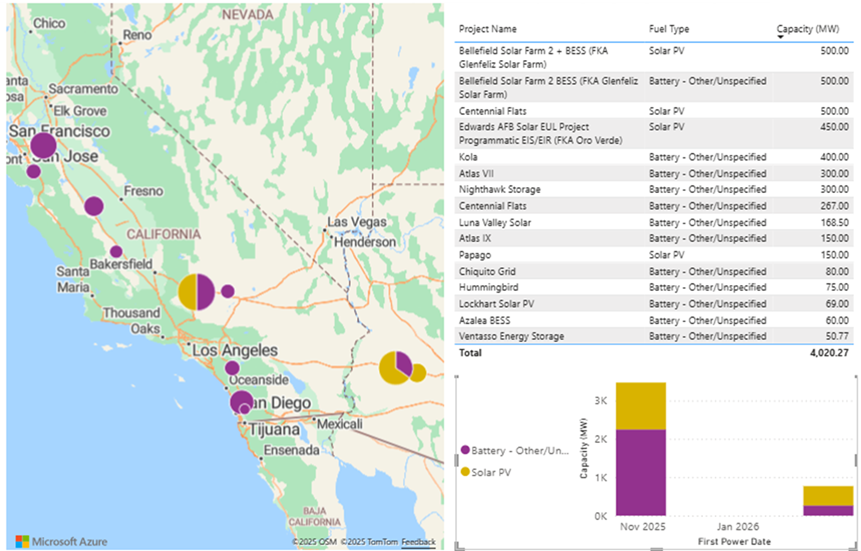
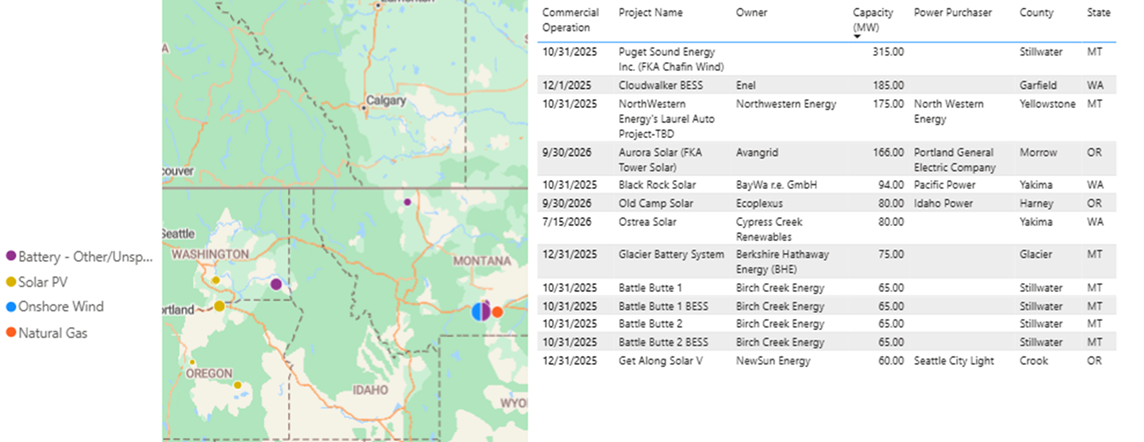
CAISO enters winter with major transmission and renewable developments that will reshape market dynamics and price formation.
New Builds
SunZia Wind Project:
CAISO Capacity:
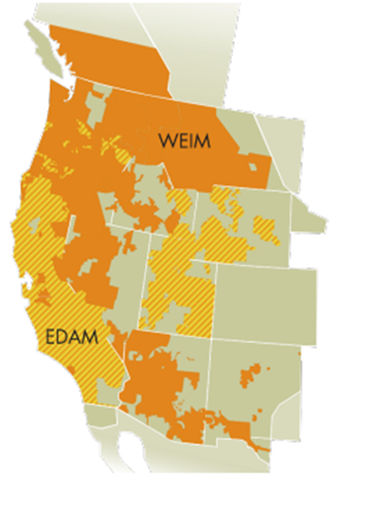
CAISO’s policy landscape continues to evolve, with two major initiatives shaping the long-term market structure:
SPP Markets+ Development
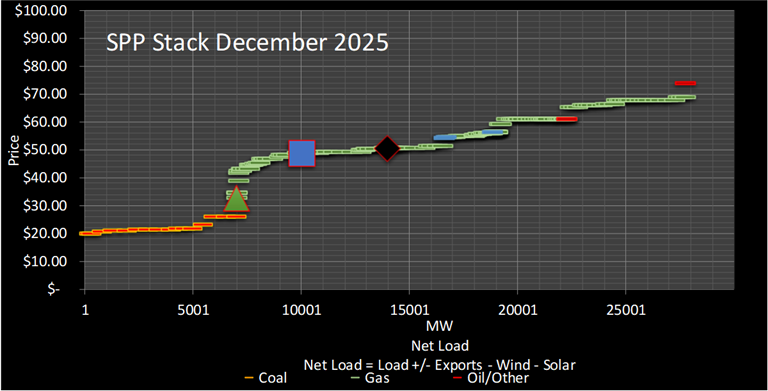
December 2025
Price | Bearish | Expected | Bullish |
|---|---|---|---|
Enverus Price Forecast | $46.96 | $47.91 | $49.13 |
Enverus Heat-Rate Forecast | 9.5 | 9.7 | 10.0 |
Forward Heat-Rates | 9.5 | 9.5 | 9.5 |
January 2026
Price | Bearish | Expected | Bullish |
|---|---|---|---|
Enverus Price Forecast | $46.51 | $51.19 | $51.31 |
Enverus Heat-Rate Forecast | 8.2 | 9.0 | 9.0 |
Forward Heat-Rates | 8.4 | 8.4 | 8.4 |
February 2026
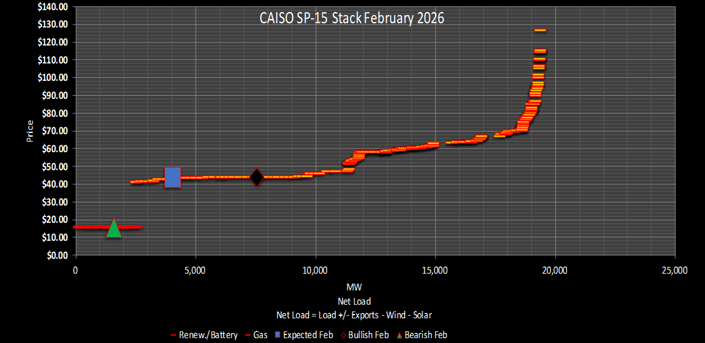
Price | Bearish | Expected | Bullish |
|---|---|---|---|
Enverus Price Forecast | $15.73 | $43.25 | $45.97 |
Enverus Heat-Rate Forecast | 3.0 | 8.2 | 8.8 |
Forward Heat-Rates | 6.8 | 6.8 | 6.8 |
December 2025
Average 2010-2024 | December 2013 | December 2017 | December 2024 | Average | |
|---|---|---|---|---|---|
Average | 41 | 36 | 40 | 44 | 40 |
Minimum | 37 | 31 | 34 | 39 | 35 |
Maximum | 47 | 42 | 46 | 50 | 46 |
January 2026
Average 2010-2024 | January 2014 | January 2018 | January 2025 | Average | |
|---|---|---|---|---|---|
Average | 42 | 41 | 46 | 43 | 44 |
Minimum | 36 | 35 | 40 | 35 | 37 |
Maximum | 49 | 48 | 52 | 49 | 50 |
February 2026
Average 2010-2024 | January 2014 | January 2018 | January 2025 | Average | |
|---|---|---|---|---|---|
Average | 43 | 40 | 42 | 42 | 41 |
Minimum | 37 | 34 | 36 | 36 | 35 |
Maximum | 50 | 46 | 49 | 48 | 48 |
New Builds
Retirements
December 2025
Price | Bearish | Expected | Bullish |
|---|---|---|---|
Enverus Price Forecast | $60.61 | $64.08 | $65.68 |
Enverus Heat-Rate Forecast | 13.8 | 14.6 | 14.9 |
Forward Heat-Rates | 14.8 | 14.8 | 14.8 |
January 2026
Price | Bearish | Expected | Bullish |
|---|---|---|---|
Enverus Price Forecast | $69.62 | $72.64 | $77.23 |
Enverus Heat-Rate Forecast | 15.2 | 15.9 | 16.9 |
Forward Heat-Rates | 16.4 | 16.4 | 16.4 |
February 2026
Price | Bearish | Expected | Bullish |
|---|---|---|---|
Enverus Price Forecast | $74.62 | $80.20 | $88.80 |
Enverus Heat-Rate Forecast | 17.7 | 19.0 | 21.0 |
Forward Heat-Rates | 14.3 | 14.3 | 14.3 |
December 2025
Average 2010-2024 | December 2013 | December 2017 | December 2024 | Average | |
|---|---|---|---|---|---|
Average | 35 | 32 | 20 | 34 | 29 |
Minimum | 29 | 26 | 23 | 27 | 25 |
Maximum | 42 | 39 | 36 | 42 | 39 |
January 2026
Average 2010-2024 | January 2014 | January 2018 | January 2025 | Average | |
|---|---|---|---|---|---|
Average | 30 | 26 | 27 | 28 | 27 |
Minimum | 23 | 18 | 19 | 21 | 19 |
Maximum | 37 | 34 | 35 | 34 | 34 |
February 2026
Average 2010-2024 | February 2014 | February 2018 | February 2025 | Average | |
|---|---|---|---|---|---|
Average | 32 | 27 | 37 | 30 | 32 |
Minimum | 25 | 19 | 28 | 23 | 23 |
Maximum | 39 | 35 | 45 | 37 | 39 |
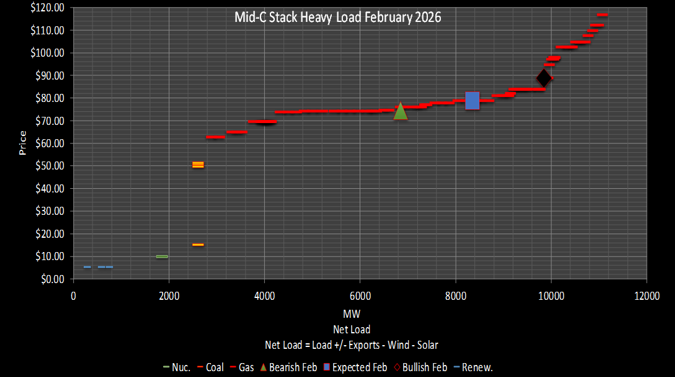
New Builds
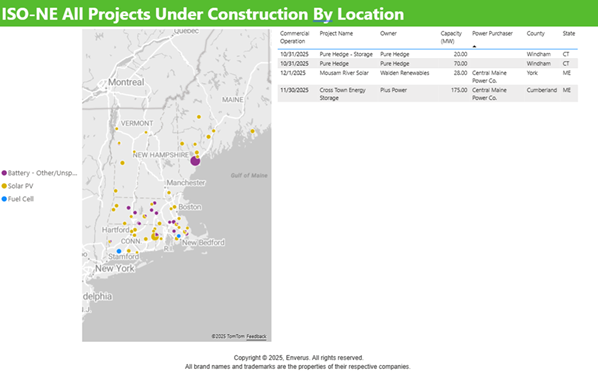
Retirements
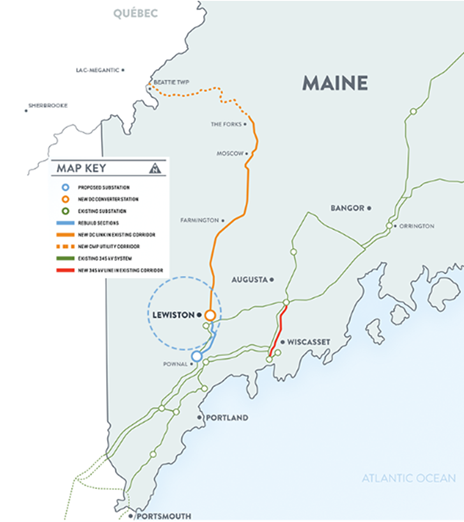
Transmission-Linked Development:
The NECEC will increase the import capability from Quebec to New England, potentially adding 1,200MW of clean energy. This addition is expected to alleviate local generation constraints, particularly in Maine, and provide a more stable supply of renewable energy during periods of high demand or low local generation.
The impact of the injection of 1,200MW into Maine will drive the system energy cost lower but will also create the risk for more consistent price separation for the Maine region from the rest of the system. Congestion isn’t a major issue in ISO-NE, but we expect to see a bit more basis grow when this project is in service. 345-kV upgrades along the coast will help alleviate congestion risk but internal interfaces will still see higher loading.
December 2025
Price | Bearish | Expected | Bullish |
|---|---|---|---|
Enverus Price Forecast | $85.88 | $116.89 | $135.11 |
Enverus Heat-Rate Forecast | 9.3 | 12.7 | 14.7 |
Forward Heat-Rates | 10.0 | 10.0 | 10.0 |
January 2026
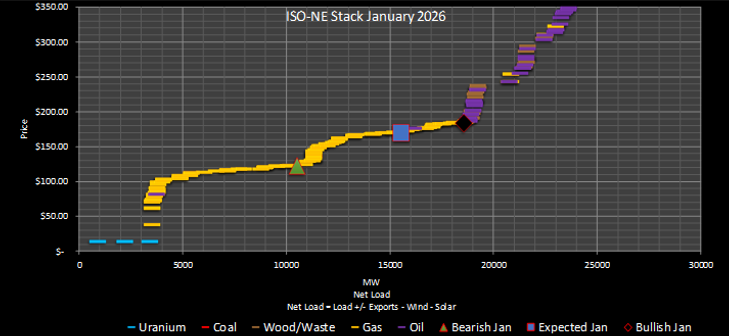
Price | Bearish | Expected | Bullish |
|---|---|---|---|
Enverus Price Forecast | $123.78 | $167.92 | $184.99 |
Enverus Heat-Rate Forecast | 9.1 | 12.4 | 13.6 |
Forward Heat-Rates | 9.3 | 9.3 | 9.3 |
February 2026
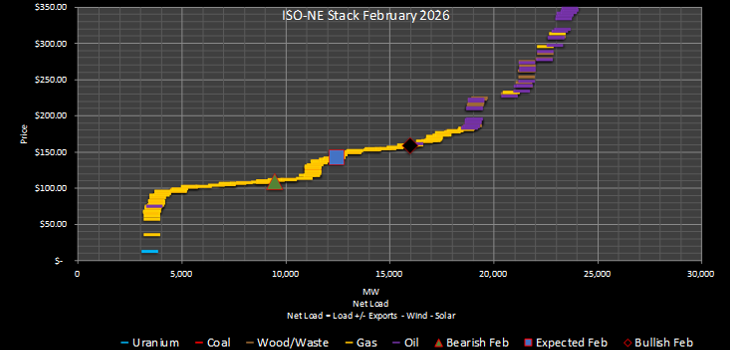
Price | Bearish | Expected | Bullish |
|---|---|---|---|
Enverus Price Forecast | $109.25 | $143.48 | $158.63 |
Enverus Heat-Rate Forecast | 8.9 | 11.7 | 12.9 |
Forward Heat-Rates | 9.1 | 9.1 | 9.1 |
December 2025
Average 2010-2024 | December 2013 | December 2017 | December 2024 | Average | |
|---|---|---|---|---|---|
Average | 39 | 35 | 33 | 36 | 35 |
Minimum | 33 | 28 | 27 | 30 | 28 |
Maximum | 44 | 42 | 38 | 42 | 41 |
January 2026
Average 2010-2024 | January 2014 | January 2018 | January 2025 | Average | |
|---|---|---|---|---|---|
Average | 34 | 26 | 29 | 31 | 28 |
Minimum | 28 | 19 | 21 | 24 | 19 |
Maximum | 40 | 33 | 37 | 38 | 363 |
February 2026
Average 2010-2024 | February 2014 | February 2018 | February 2025 | Average | |
|---|---|---|---|---|---|
Average | 36 | 29 | 39 | 35 | 35 |
Minimum | 30 | 22 | 31 | 30 | 28 |
Maximum | 42 | 36 | 47 | 43 | 42 |
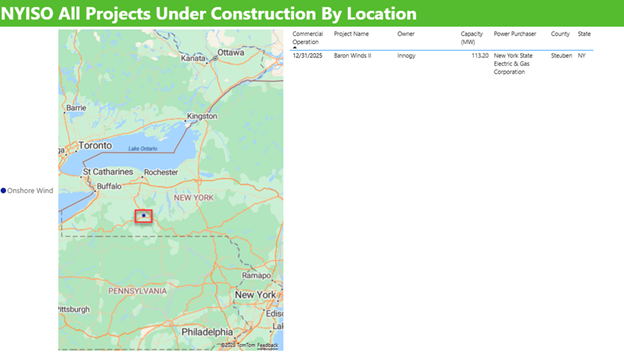
New Builds
Baron Winds II:
Transmission Developments
Champlain Hudson Power Express (CHPE):
December 2025
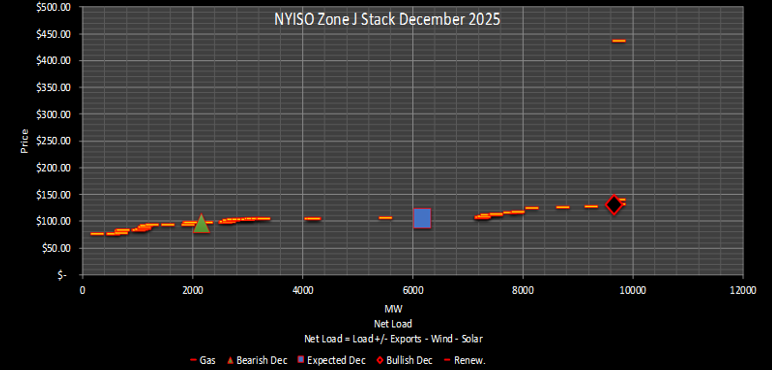
Price | Bearish | Expected | Bullish |
|---|---|---|---|
Enverus Price Forecast | $97.87 | $105.75 | $127.14 |
Enverus Heat-Rate Forecast | 16.1 | 17.4 | 20.9 |
Forward Heat-Rates | 14.0 | 14.0 | 14.0 |
January 2026
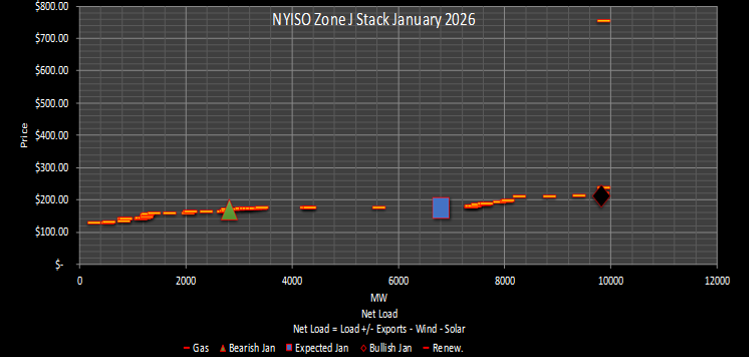
Price | Bearish | Expected | Bullish |
|---|---|---|---|
Enverus Price Forecast | $169.99 | $176.56 | $213.82 |
Enverus Heat-Rate Forecast | 16.0 | 16.7 | 20.2 |
Forward Heat-Rates | 11.7 | 11.7 | 11.7 |
February 2026
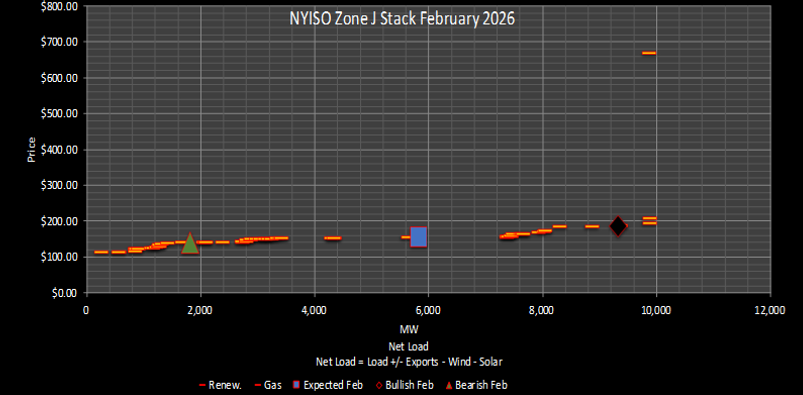
Price | Bearish | Expected | Bullish |
|---|---|---|---|
Enverus Price Forecast | $140.13 | $153.80 | $184.85 |
Enverus Heat-Rate Forecast | 14.8 | 16.3 | 19.6 |
Forward Heat-Rates | 12.0 | 12.0 | 12.0 |
About Enverus Power and Renewables
With a 15-year head start in renewables and grid intelligence, real-time grid optimization to the node and unparalleled expertise in load forecasting that has outperformed the ISO forecasts, Enverus Power and Renewables is uniquely positioned to support all power insight needs and data-driven decision making. More than 6,000 businesses, including 1,000+ in electric power markets, rely on our solutions daily.
Let’s get started!
Let’s get started!
We’ll follow up right away to show you a quick product tour.
Ready to Subscribe?
Ready to Get Started?