
Gas Injection Below Expectation While LNG Export Demand Weakens

byEnverus

[contextly_auto_sidebar]

Natural gas storage inventories increased 70 Bcf for the week ending April 24, according to the EIA’s weekly report. This was slightly below the expected injection of 74 Bcf.

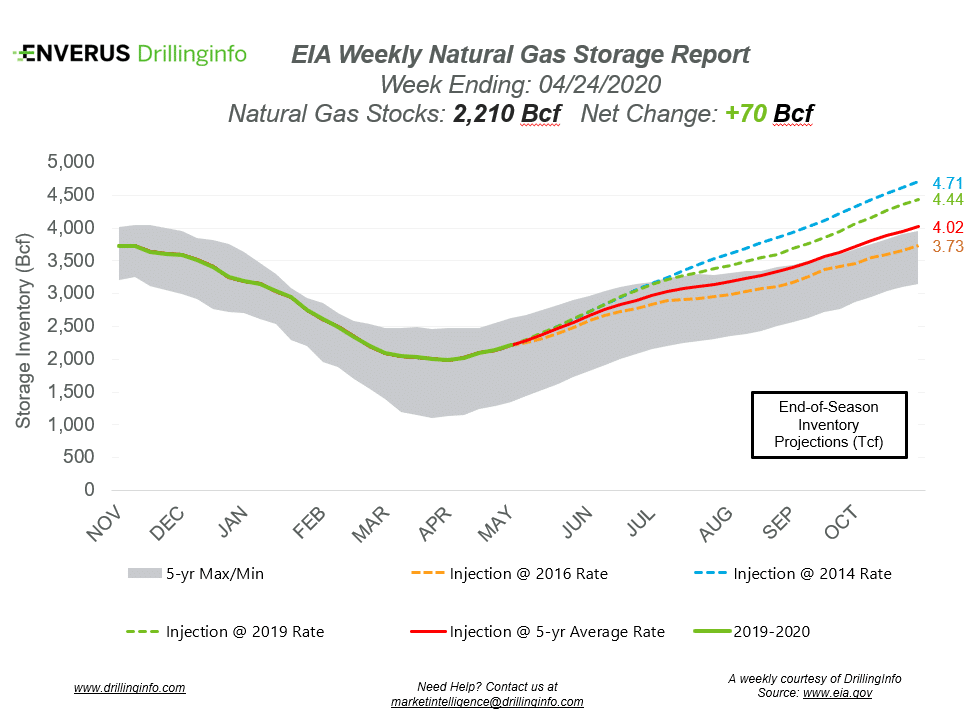
Working gas storage inventories now sit at 2.210 Tcf, which is 783 Bcf above inventories from the same time last year and 360 Bcf above the five-year average.

Prior to the storage report’s release, the June 2020 contract was trading at $1.875/MMBtu, roughly $0.006 above yesterday’s close. The May 2020 contract closed earlier this week at $1.794. After the release of the report and at the time of writing, the June 2020 contract was trading slightly higher, jumping to $1.885/MMBtu.

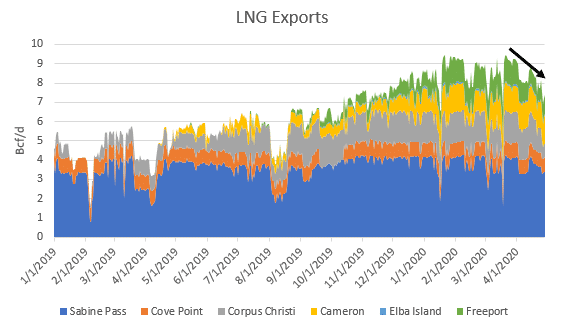
As the crude oil industry copes with the demand hit from COVID-19 and wonders when things will get back to normal, the US LNG export industry is also feeling the hit as global demand for the liquefied gas has diminished in the last month due to the pandemic. Just a little over a month ago, LNG exports reached an all-time high, with ~9.44 Bcf flowing to terminals. However, demand destruction has caused reduced flows to LNG terminals, leaving the month of April averaging ~8.12 Bcf/d of exports and yesterday showing ~7.37 Bcf of exports. Recently, some LNG importers in Asia and Europe, including Kogas, Tokyo Gas, CNOOC, Petronas, and Petronet, have announced deferrals in response to the COVID-19 demand fall out. As the world continues to get through the pandemic and begins to reopen, demand for LNG will rebound, but it will not likely rebound to pre-pandemic levels until at least late 2020.


See the chart below for projections of the end-of-season storage inventories as of November 1, the end of the injection season.
This Week in Fundamentals

The summary below is based on Bloomberg’s flow data and Enverus’ analysis for the week ending April 30.

Supply:

  • Dry natural gas production decreased 1.29 Bcf/d on the week. Decreases in the South Central (-0.59 Bcf/d), Mountain (-0.49 Bcf/d), and East (-0.19 Bcf/d) regions account for the production drop.
  • Canadian net imports decreased 0.50 Bcf/d as exports to Canada picked up in the Midwest.

Demand:

  • Domestic natural gas demand decreased 6.16 Bcf/d week over week. Res/Com demand accounted for the majority of the decrease, dropping 5.77 Bcf/d on the week, while power demand also fell 0.71 Bcf/d. Industrial demand saw an increase of 0.32 Bcf/d on the week.
  • LNG exports decreased 0.67 Bcf/d on the week largely due to decreased flows at Sabine and Corpus Christi, while Mexican exports decreased 0.67 Bcf/d.

Total supply decreased 1.79 Bcf/d, while total demand decreased 7.26 Bcf/d week over week. With the decrease in demand outpacing the decrease in supply, expect the EIA to report a stronger injection next week. The ICE Financial Weekly Index report is currently expecting an injection of 94 Bcf. Last year, the same week saw an injection of 85 Bcf; the five-year average is an injection of 77 Bcf.

Picture of Enverus

Enverus

Energy’s most trusted SaaS platform — creating intelligent connections that uncover insights and opportunities to deliver extraordinary outcomes.

Subscribe to the Enverus Blog

A weekly update on the latest “no-fluff” insight and analysis of the energy industry.

Related Content
power-grid-congestion
Post
Power Trading, Utilities
ByEnverus

Based on the Enverus Winter Power Market Outlook webinar for ERCOT and SPP, presented by Adam Jordan, Director of Power Analytics. ERCOT has produced only 15 to 30 hours above 60 GW of net load in each of the last...

Enverus releases Top 50 Public E&P Operators of 2025
Post
Operators
ByRyan Hill

Operators are testing overlooked Osborn and Cherokee zones in Oklahoma as core inventory thins. See what Enverus data shows about remaining inventory.

Time-to-power gap Big generation’s Achilles’ heel in the AI data center race
Post
Power & Renewables, Power Trading
ByEnverus

PJM has 113.6 GW of announced large-load capacity, far more than the 28.5 GW under construction. See what the gap means for reliability and planning.

U.S. natural gas prices face power demand drag
Post
Power & Renewables, Power Trading
ByEnverus

ERCOT data shows large loads ramping at different rates as solar and battery additions keep pace, with new supply expected to slow in 2027.

Global energy markets brace for supply shock and further price gains
Post
Trading & Risk
ByAl Salazar, Enverus Intelligence® Research (EIR) Contributor

Bank of Canada energy inflation risks stagflation as oil spikes push headline inflation higher ahead of a pivotal rate decision.

Enverus Press Release - Speed through records with Enverus Instant Analyst™ - Courthouse
Post
Financial Services
ByColton Wright

Where will future oil inventory come from? Explore the Barnett-Woodford estimate and the spacing and cost assumptions investors should test.

Enverus Press Release - E&Ps with natural gas + CCS pave way for model data center development
Post
Analyst Takes
ByTom Liskey

Read Part 2: Guyana Oil and the Venezuela-Essequibo Dispute The ICJ Will Rule. Governments Will Change. Why Essequibo Still Matters.  Oil companies are accustomed to thinking in decades.  Governments rarely operate on the same timetable.  The Essequibo dispute demonstrates what...

minerals-management
Post
Minerals
ByTemi Oyetayo

Explore our reliable well log library for standardized logs, depth-registered rasters, and workstation-ready LAS files—start your subsurface analysis faster.

Enverus Press Release - Prioritizing renewable PPA offtaker targets proves more challenging than expected
Post
Power & Renewables
ByThomas Popa

Senate’s bipartisan permitting bill data centers grid interconnection could curb speculative queues and speed transmission buildout.

Let’s get started!

We’ll follow up right away to show you a quick product tour.

Let’s get started!

We’ll follow up right away to show you a quick product tour.

Sign up for our Blog

Ready to Subscribe?

Ready to Get Started?