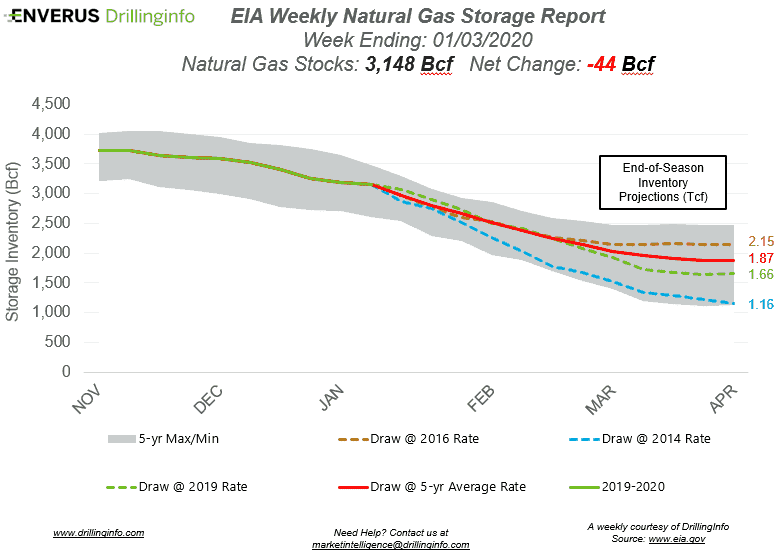
Natural gas storage inventories decreased 44 Bcf for the week ending January 3, according to the EIA’s weekly report. This was below the market expectation, which was a draw of 52 Bcf.
Working gas storage inventories now sit at 3.148 Tcf, which is 521 Bcf above inventories from the same time last year and 74 Bcf above the five-year average.
Prior to the storage report release, the February 2020 contract was trading at $2.133/MMBtu, roughly $0.008 below yesterday’s close. After the release of the report, the February 2020 contract was trading at $2.132/MMBtu.
Prices have been weak for the entire winter. Day-ahead Henry Hub prices averaged $2.605 and $2.203 in November and December, respectively. November monthly average day-ahead prices were the third lowest since 2009, being topped by the lows in November in 2015 and 2016, while December was the second lowest since 2009, being topped only by the lows of 2015.
Looking forward at the rest of winter, February and March are trading at $2.141 and $2.134 as of yesterday’s close. Since 2009, February monthly average day-ahead Henry Hub prices have averaged $3.514, while March has averaged $3.275. However, the averages for both February and March have been significantly lower since 2015, averaging day-ahead Henry Hub prices of $2.591 and $2.594, respectively. February and March prices are on track to set near-record lows unless weather turns cold for an extended period.
See the chart below for projections of the end-of-season storage inventories as of April 1, the end of the withdrawal season.

This Week in Fundamentals
The summary below is based on Bloomberg’s flow data and DI analysis for the week ending January 9.
Supply:
- Dry production decreased 0.52 Bcf/d on the week. Most of the decrease came from the Mountain Region (-0.23 Bcf/d) and the East (-0.22 Bcf/d), with an additional decrease coming from the South Central Region (-0.09 Bcf/d). The Pacific and Midwest both saw relatively small increases.
- Canadian net imports increased 73 Bcf/d, mainly due to increased flows into the Northeast.
Demand:
- Domestic natural gas demand increased 6.53 Bcf/d week over week. Res/Com demand accounted for the majority of the increase, rising 4.10 Bcf/d on the week. Power and Industrial demand also increased, rising 2.00 Bcf/d and 0.44 Bcf/d, respectively.
- LNG exports increased 0.16 Bcf/d. Mexican exports increased 0.76 Bcf/d, mainly due to increased flows on Tennessee Gas and Valley Crossing.
Total supply increased by 0.21 Bcf/d, while total demand increased 7.63 Bcf/d week over week. With the increase in demand outpacing the increase in supply, expect the EIA to report a stronger draw next week. The ICE Financial Weekly Index report is currently expecting a draw of 100 Bcf. Last year, the same week saw a draw of 81 Bcf; the five-year average is a draw of 180 Bcf.
