
Power Trading
See what’s happening on the grid, why prices are moving and what comes next. Mosaic combines ISO data, forecasts, real-time monitoring and congestion analysis with 2x the plant monitoring coverage of traditional tools, so users move from signal to decision up to 75% faster.

See current grid conditions alongside forward forecasts, connecting the constraint forming now with the congestion and pricing risks expected next.
Trace price movements to load, renewable output, generation, transmission outages and constraints, then assess how those conditions may evolve.
Configurable workbooks, analyst intelligence and connected data delivery help existing teams monitor more markets and nodes.
Mosaic covers the short-term grid, from what’s happening on it right now to what the next several days are likely to bring.
Real-Time Grid Monitoring
1
Load and Renewable Forecasting
2
Congestion Analysis
3
Short-Term P&R Forecast
4
Analyst Intelligence
5
Configurable Workflows and API Access
6
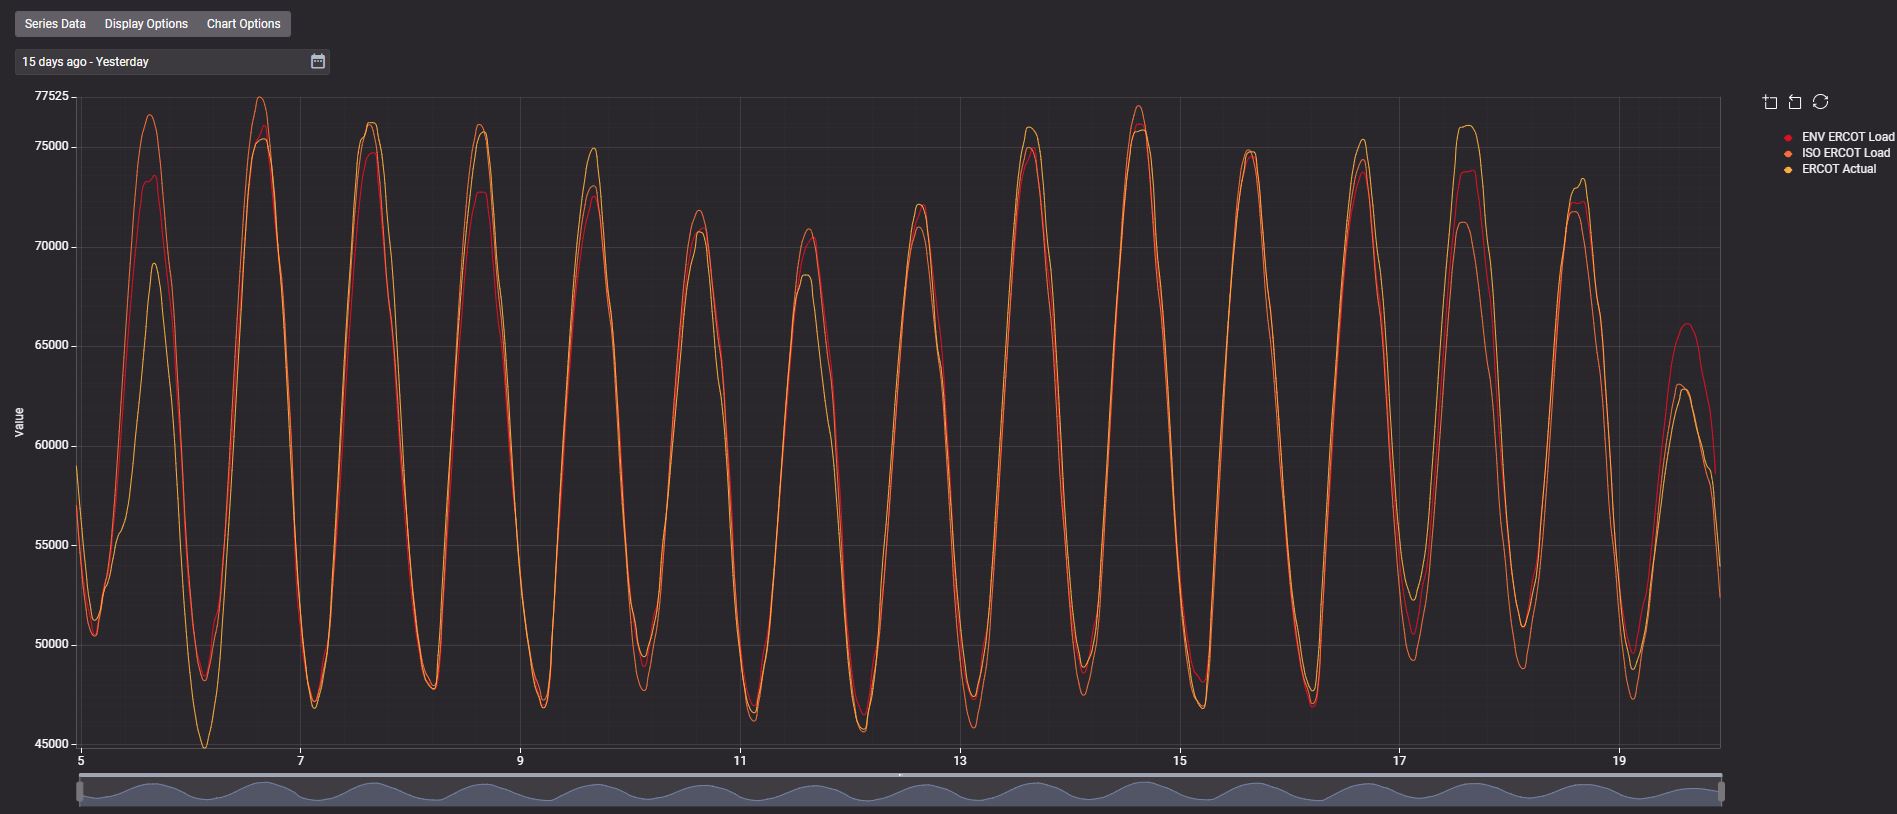
Track real-time prices, outages and grid conditions across 2,100+ generators and 33,000+ power constraints, with a live LMP and congestion map. Mosaic’s proprietary state estimator shows unit-level generation and power flows as conditions change. Real-time generation monitoring and congestion decomposition cover ERCOT, SPP, MISO and PJM, with load and renewable forecasts extending across additional ISOs.
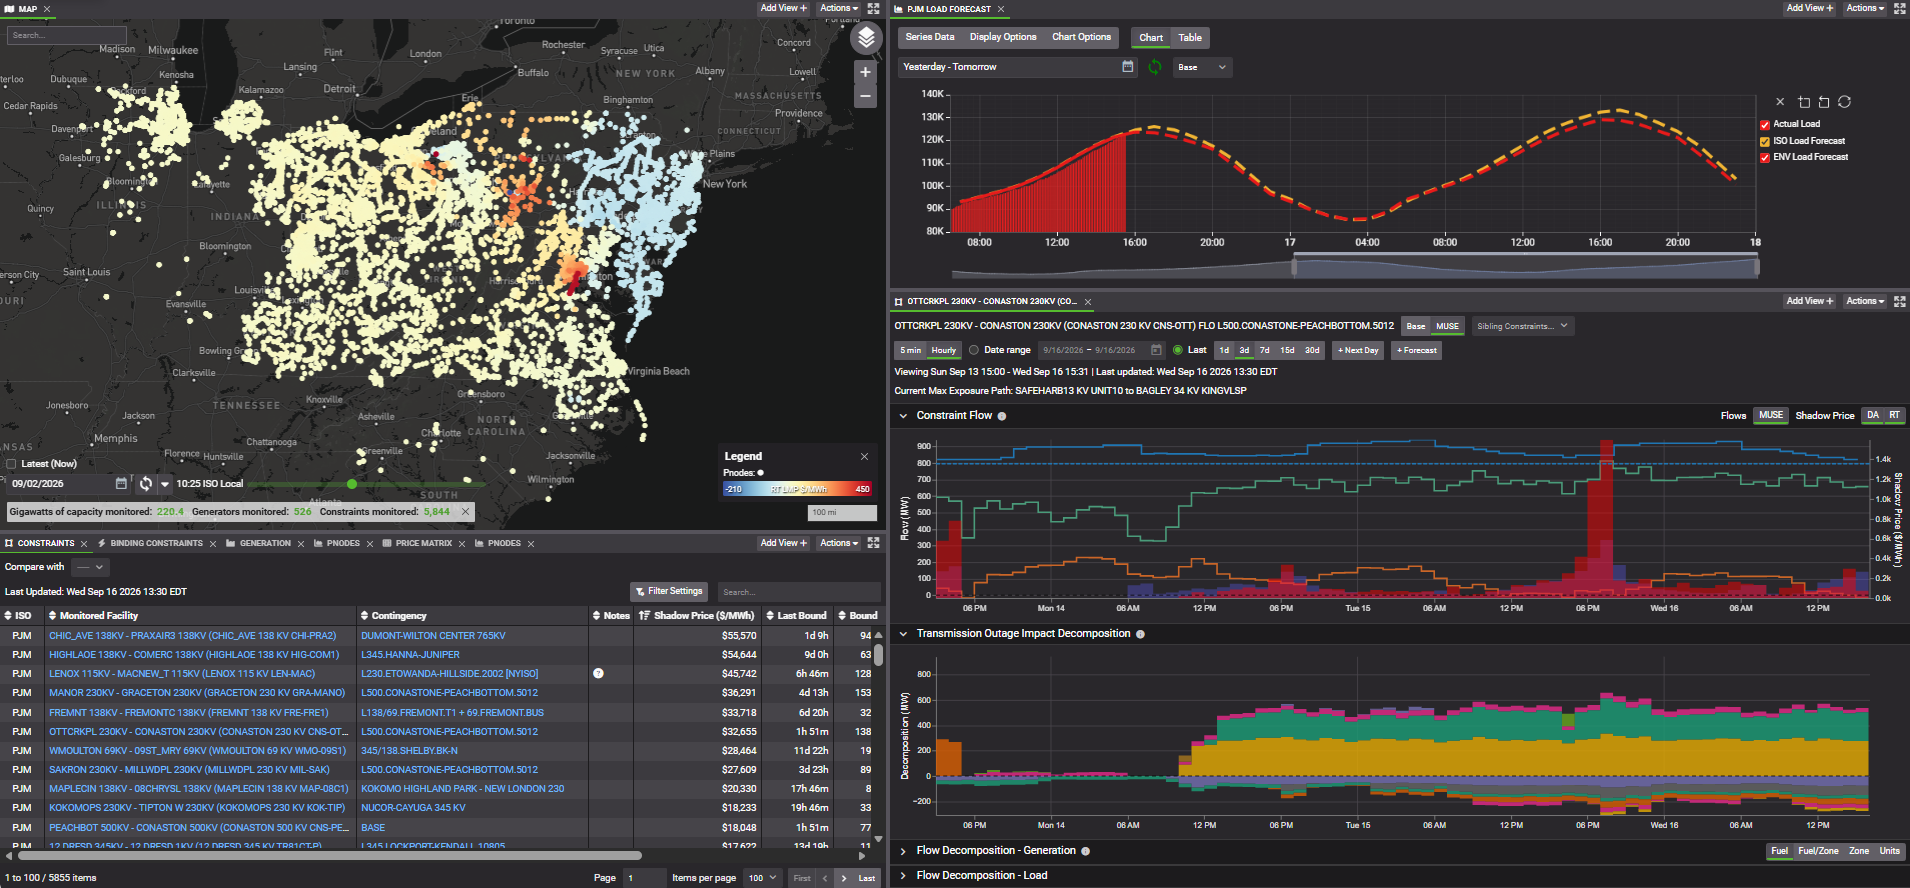
Load forecasts that have outperformed ISO benchmarks for more than 25 years, with confidence bands that show the range of likely outcomes. Wind and solar forecasts combining physics-based and machine learning models extend down to the individual farm.
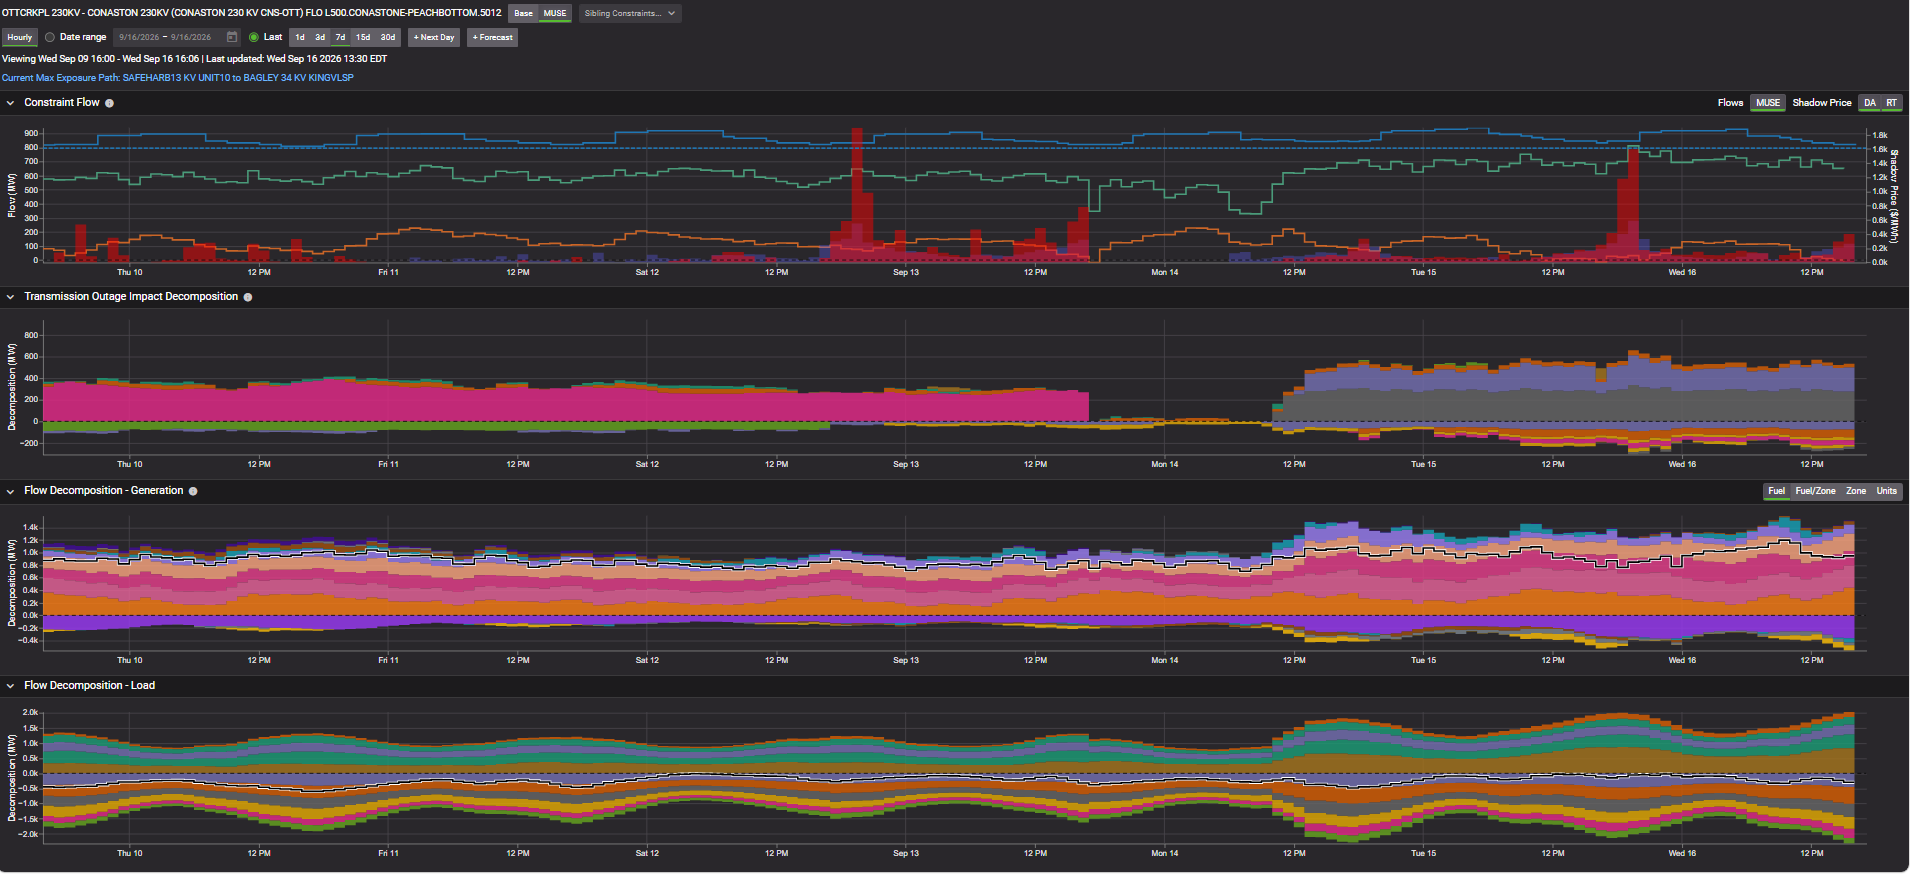
Break down binding constraints into the outages, generation and load driving them, and see how each one moves the price at your node. Shift factors are calculated from actual grid topology, updated hourly.
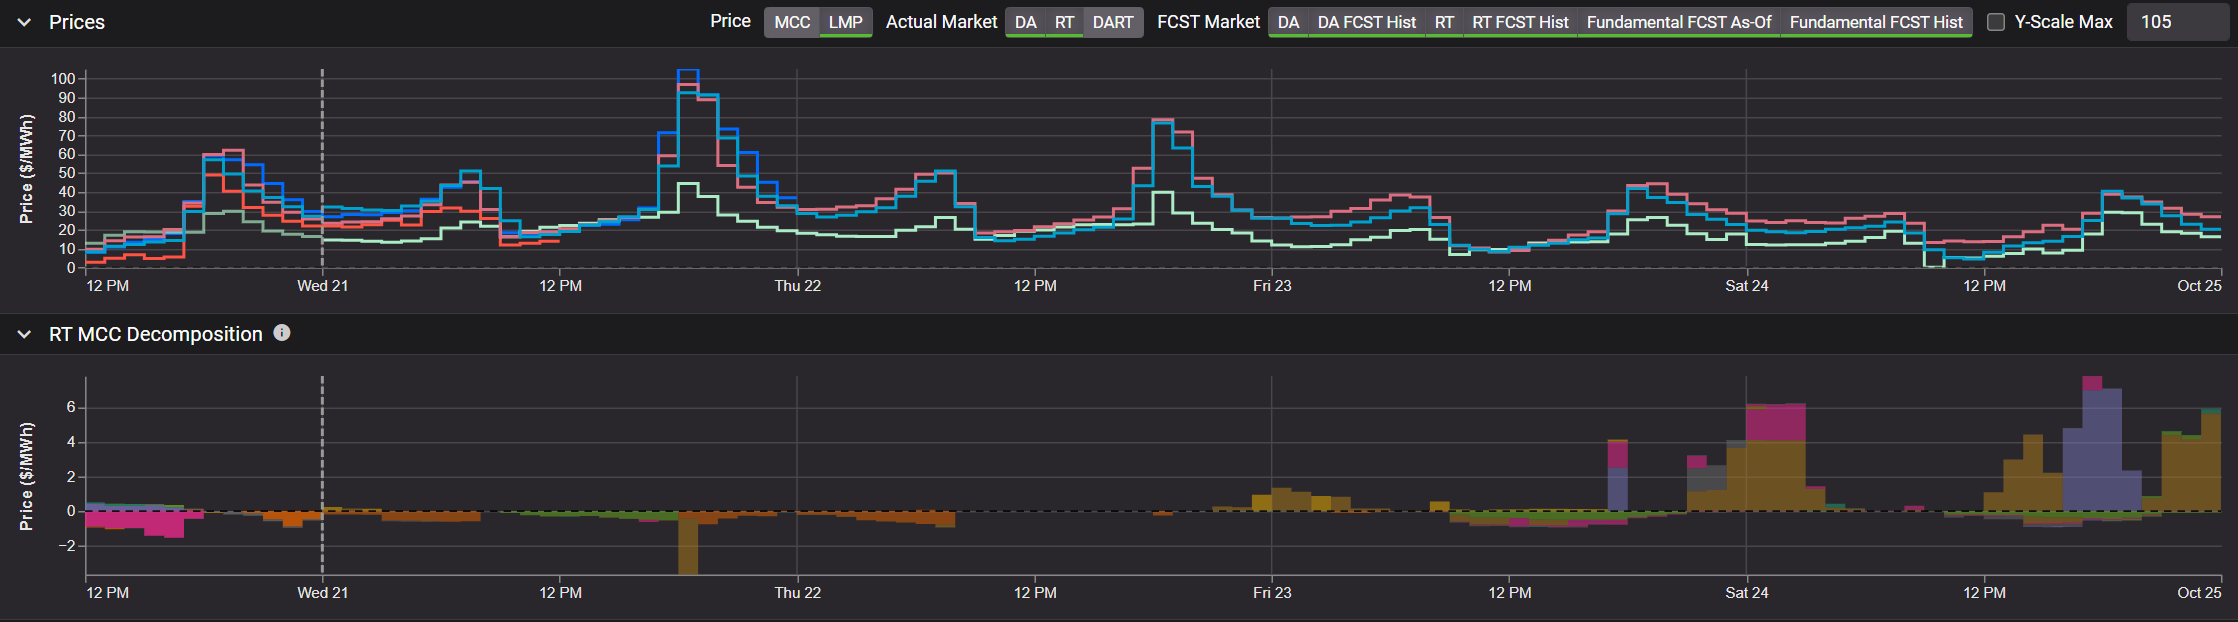
A fundamental nodal price and congestion forecast, modeled on ISO market clearing and run by an automated production cost model. Day-ahead and real-time price forecasts come with risk bands, so you can size positions against a range of likely outcomes.
Daily power market publications from veteran ISO analysts cover load, renewable and congestion conditions. Reports link directly into Mosaic, and your team can go straight to the analysts who wrote them.
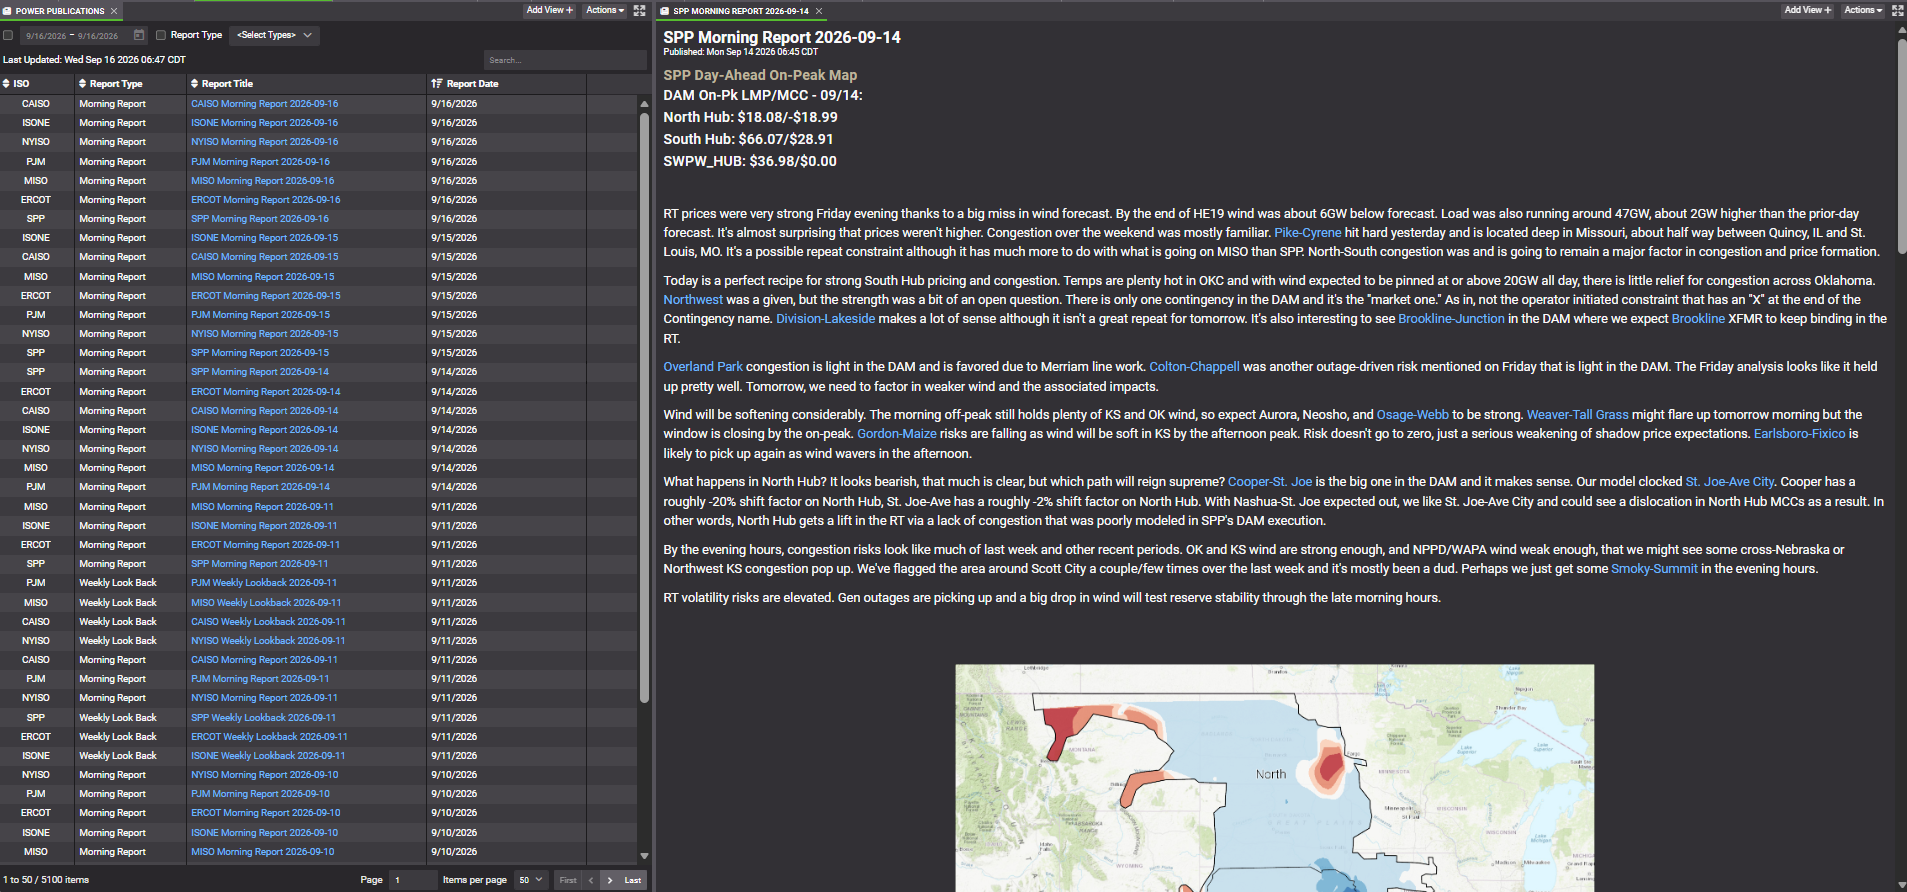
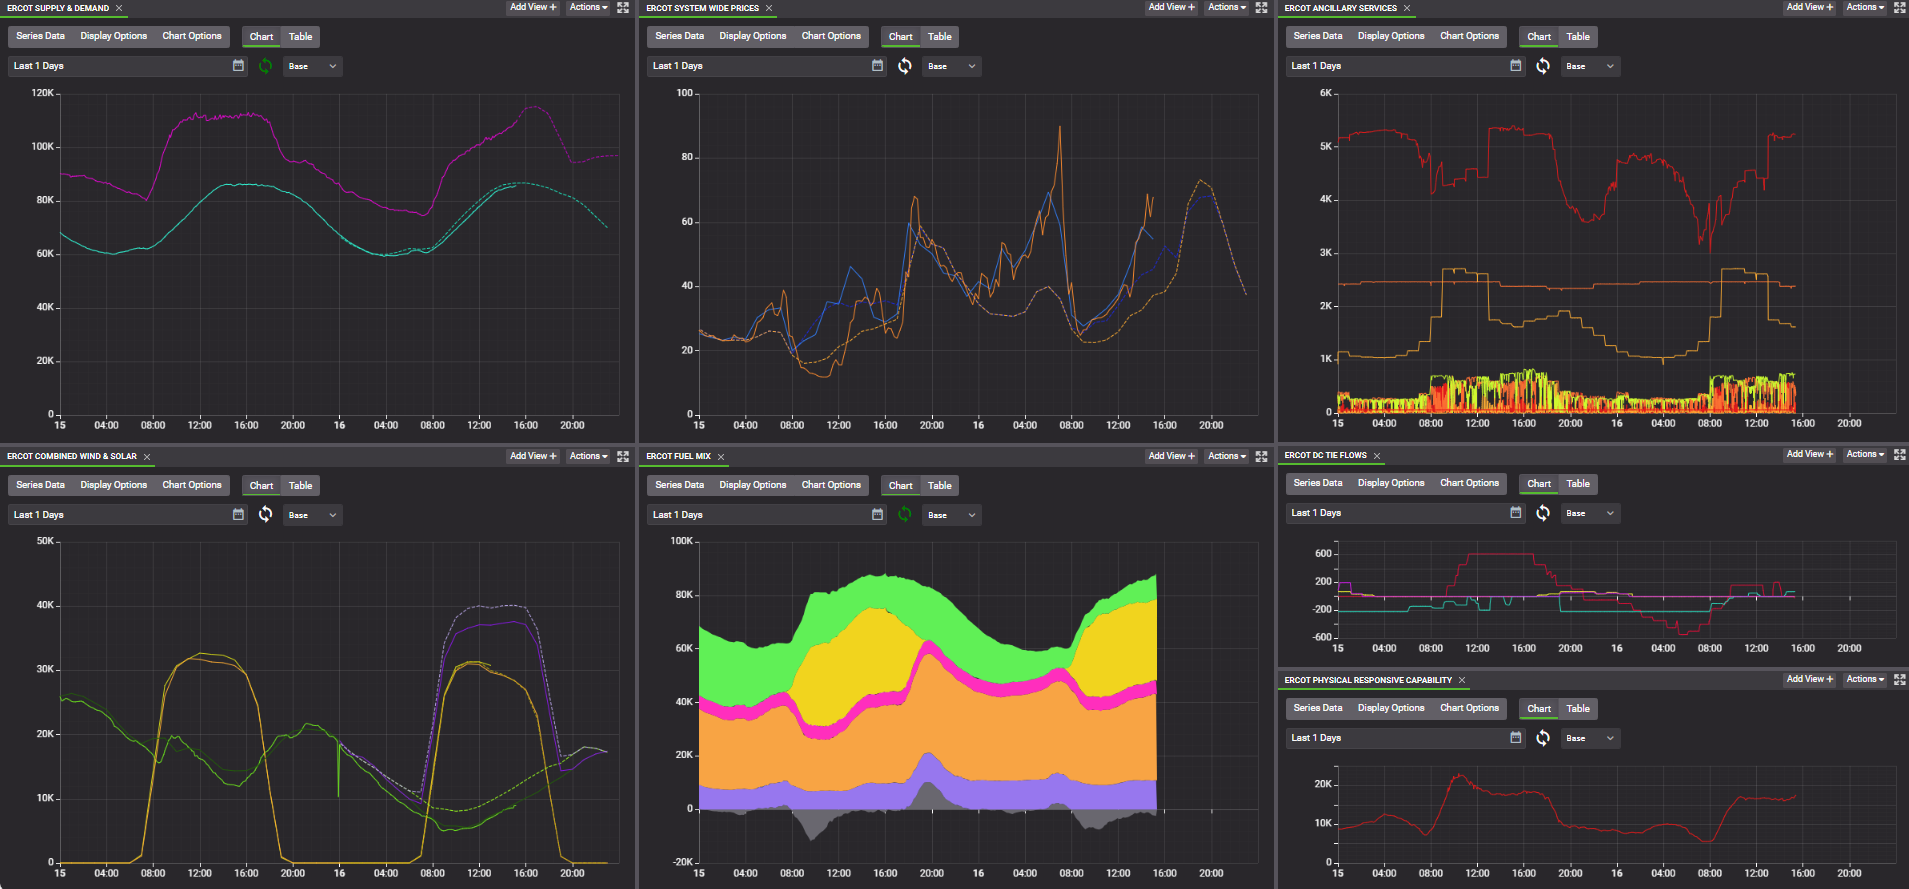
Build custom time series and shareable workbooks around the markets you trade. Bring subscribed Mosaic power market datasets into proprietary models, dashboards and trading systems through Mosaic API and Snowflake delivery options.
Take a guided tour and see how monitoring, forecasting and congestion analysis come together in one workspace.

Advanced grid insights with accurate load forecasts and extensive monitoring enhance trade execution and profitability.
Quickly identify grid opportunities and risks with high-quality mid-term forecasts, expert analysis and streamlined grid analysis.
Ask power market questions in plain language and get expert-level answers in minutes. Grounded in your Mosaic and Panorama data, it retrieves the right data automatically and explains what it means for your positions.
Scenario-based forecasts that look 20 years into the future. Confidently plan around evolving grid dynamics, identify profitable opportunities and support strategic decisions with the most trusted long-term view in power.
Forward-looking grid simulations built into Panorama. Model congestion, nodal pricing, and transmission constraints under realistic future grid conditions, with no separate modeling platform required.
Comprehensive coverage of power markets and insights into emerging energy technologies and project economics.
Tune out the noise, get unbiased evaluations and uncover hidden opportunities with advice you can trust from experienced energy and power intelligence advisors.

ERCOT data shows large loads ramping at different rates as solar and battery additions keep pace, with new supply expected to slow in 2027.

Senate’s bipartisan permitting bill data centers grid interconnection could curb speculative queues and speed transmission buildout.

Validate data center natural gas supply: check pipeline capacity, contracts, routing, and long‑term durability before you commit.

See how Enverus called ERCOT's August 2026 coincident peak a day early and pinpointed the exact peak hour, beating ERCOT's own load forecast accuracy.
Learn how utilities, hyperscalers, and developers can score assets, align stakeholders, and structure power agreements that close faster and withstand scrutiny.

Learn how utilities, hyperscalers, and developers can score assets, align stakeholders, and structure power agreements that close faster and withstand scrutiny.
MISO hit its $10,000/MWh cap on Sept. 2 as evening load surged, solar output collapsed, and imports weakened, triggering an EEA2 alert.

A $1 million-per-MW gap separates buying gas capacity from building it. See why utilities rarely run that comparison, and what it takes to defend the answer.

Most FTR losses come from sound analysis with incomplete visibility. Learn the five pitfalls that separate winning desks from ones that explain away the losses.
Let’s get started!
Let’s get started!
We’ll follow up right away to show you a quick product tour.
Ready to Subscribe?
Ready to Get Started?