
Why operationalizing market data has become a competitive advantage in energy trading
The real cost of market data is not only what an organization pays to access it. It is everything the organization has to do before the data can support a decision.

The cost of market data is easy to see in an invoice. The cost of making it usable is spread across the organization.
A trading organization may already have the provider contracts, benchmark prices, forward curves, settlement values, and proprietary datasets it needs. Yet before an analyst can evaluate a curve, test a strategy, or update a risk position, someone often has to find the right index, data code or dataset, retrieve the data, validate the output, reformat it, and confirm that nothing changed after the initial publication.
That work rarely appears as a single budget line. It is distributed across pricing analysts, trading analysts, risk teams, data engineers, ETRM administrators, and IT. Each task may look small on its own. Together, they create a persistent operating cost that sits between market data and market insight.
The real cost of market data is not only what an organization pays to access it. It is everything the organization has to do before the data can support a decision.
We call this Invisible Data Work: the collection of manual and technical activities required to make trusted market data usable before analysis can begin.
It includes searching for tickers, mapping datasets, downloading exports, reformatting files, maintaining polling jobs, validating scheduled extracts, checking for corrected prices, updating holiday and rollover calendars, troubleshooting failed loads, and supporting one-off requests from business users.
None of these activities improve a trading strategy. None produces a new market view. They simply prepare the conditions for analysis.
Because Invisible Data Work is fragmented across teams and systems. Its total cost is difficult to see. An analyst may spend part of the morning checking a file. An engineer may maintain a scheduled process. A risk manager may reconcile a corrected value. An ETRM administrator may update a calendar. No single activity looks large enough to trigger executive attention, but the pattern repeats every day.
One trading organization described data mapping as the limiting factor in broader API adoption. The data was available. The interface existed. The business still struggled to use it at scale because users could not easily identify the correct symbols and datasets. That is the distinction between technical access and operational usability.
Analysts create value by interpreting markets, evaluating risk, and developing strategies. When they spend time preparing data, the organization loses analytical capacity.
The issue is broader than individual efficiency. Manual preparation slows model development, delays risk updates, increases dependence on a small number of experienced users, and creates additional support work for technical teams. A workflow that depends on a specialist knowing which symbol to use or which file to correct does not scale easily across the business.
Many trading organizations are not getting the full analytical capacity they already employ because skilled teams still spend time preparing data before they can interpret it.
This is why the most important question is not whether an organization has access to market data. The better question is how quickly trusted data becomes usable in the systems where work happens.
Manual ingestion was always inefficient. It matters more as trading organizations invest in cloud analytics, quantitative research, AI-assisted workflows, and faster decision support.
Every advanced analytical process depends on inputs that are timely, consistent, and governed. More models create more demand for reliable data. Faster decisions increase the cost of stale information. More analytical environments increase the number of places where the same data must remain synchronized.
A modern analytics strategy cannot compensate for an unreliable ingestion layer. A more sophisticated model does not remove the need to identify the right dataset, capture corrections, maintain calendars, or deliver updates into downstream systems. It increases the importance of doing those things well.
This is the market data paradox: organizations can invest in increasingly advanced tools while the workflows feeding those tools still depend on scheduled pulls, manual preparation, and disconnected integrations.
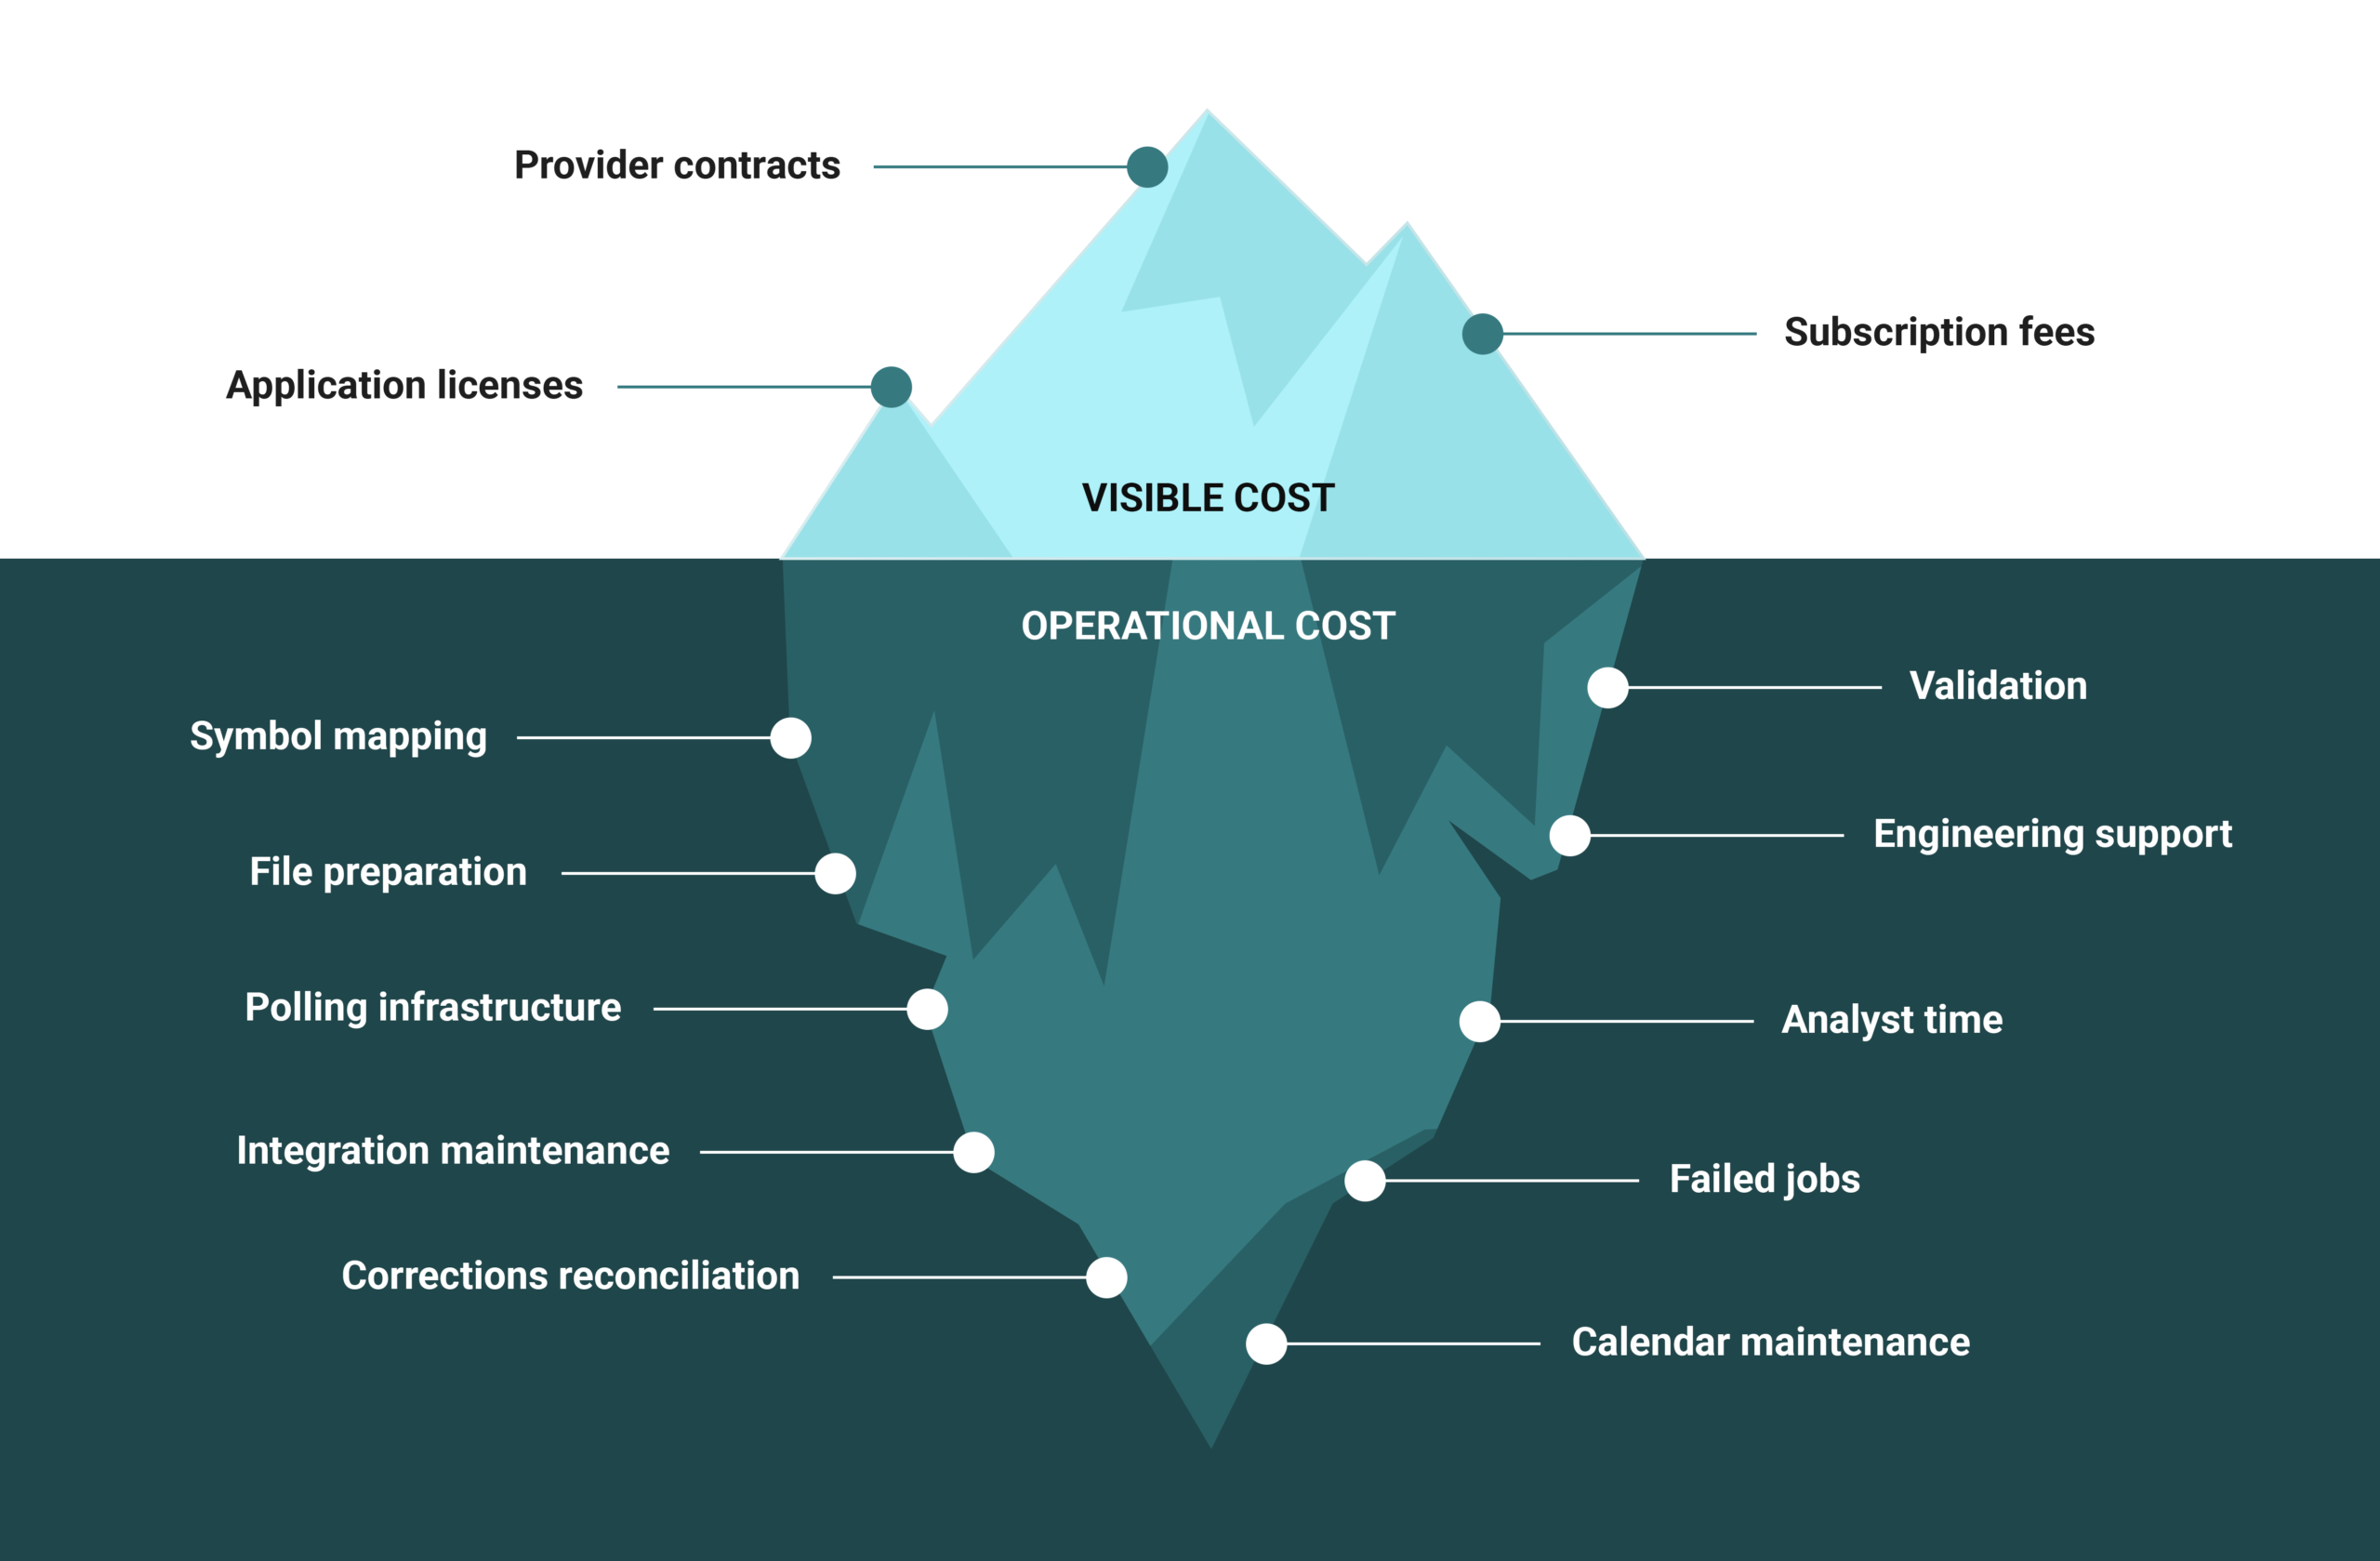
The subscription is the visible cost. Beneath it sits the operational work required to make market data useful.
Above the surface are provider contracts, application licenses, and subscription fees. Below the surface are symbol mapping, file preparation, polling infrastructure, integration maintenance, corrections reconciliation, validation, engineering support, analyst time, failed jobs, and calendar maintenance.
The visible cost is easy to measure. The operational cost is harder to isolate because it is distributed across people, processes, and systems. That does not make it less real. It makes it easier to overlook.
The next step is not another isolated interface. It is an operating model for making trusted market data usable across the organization.
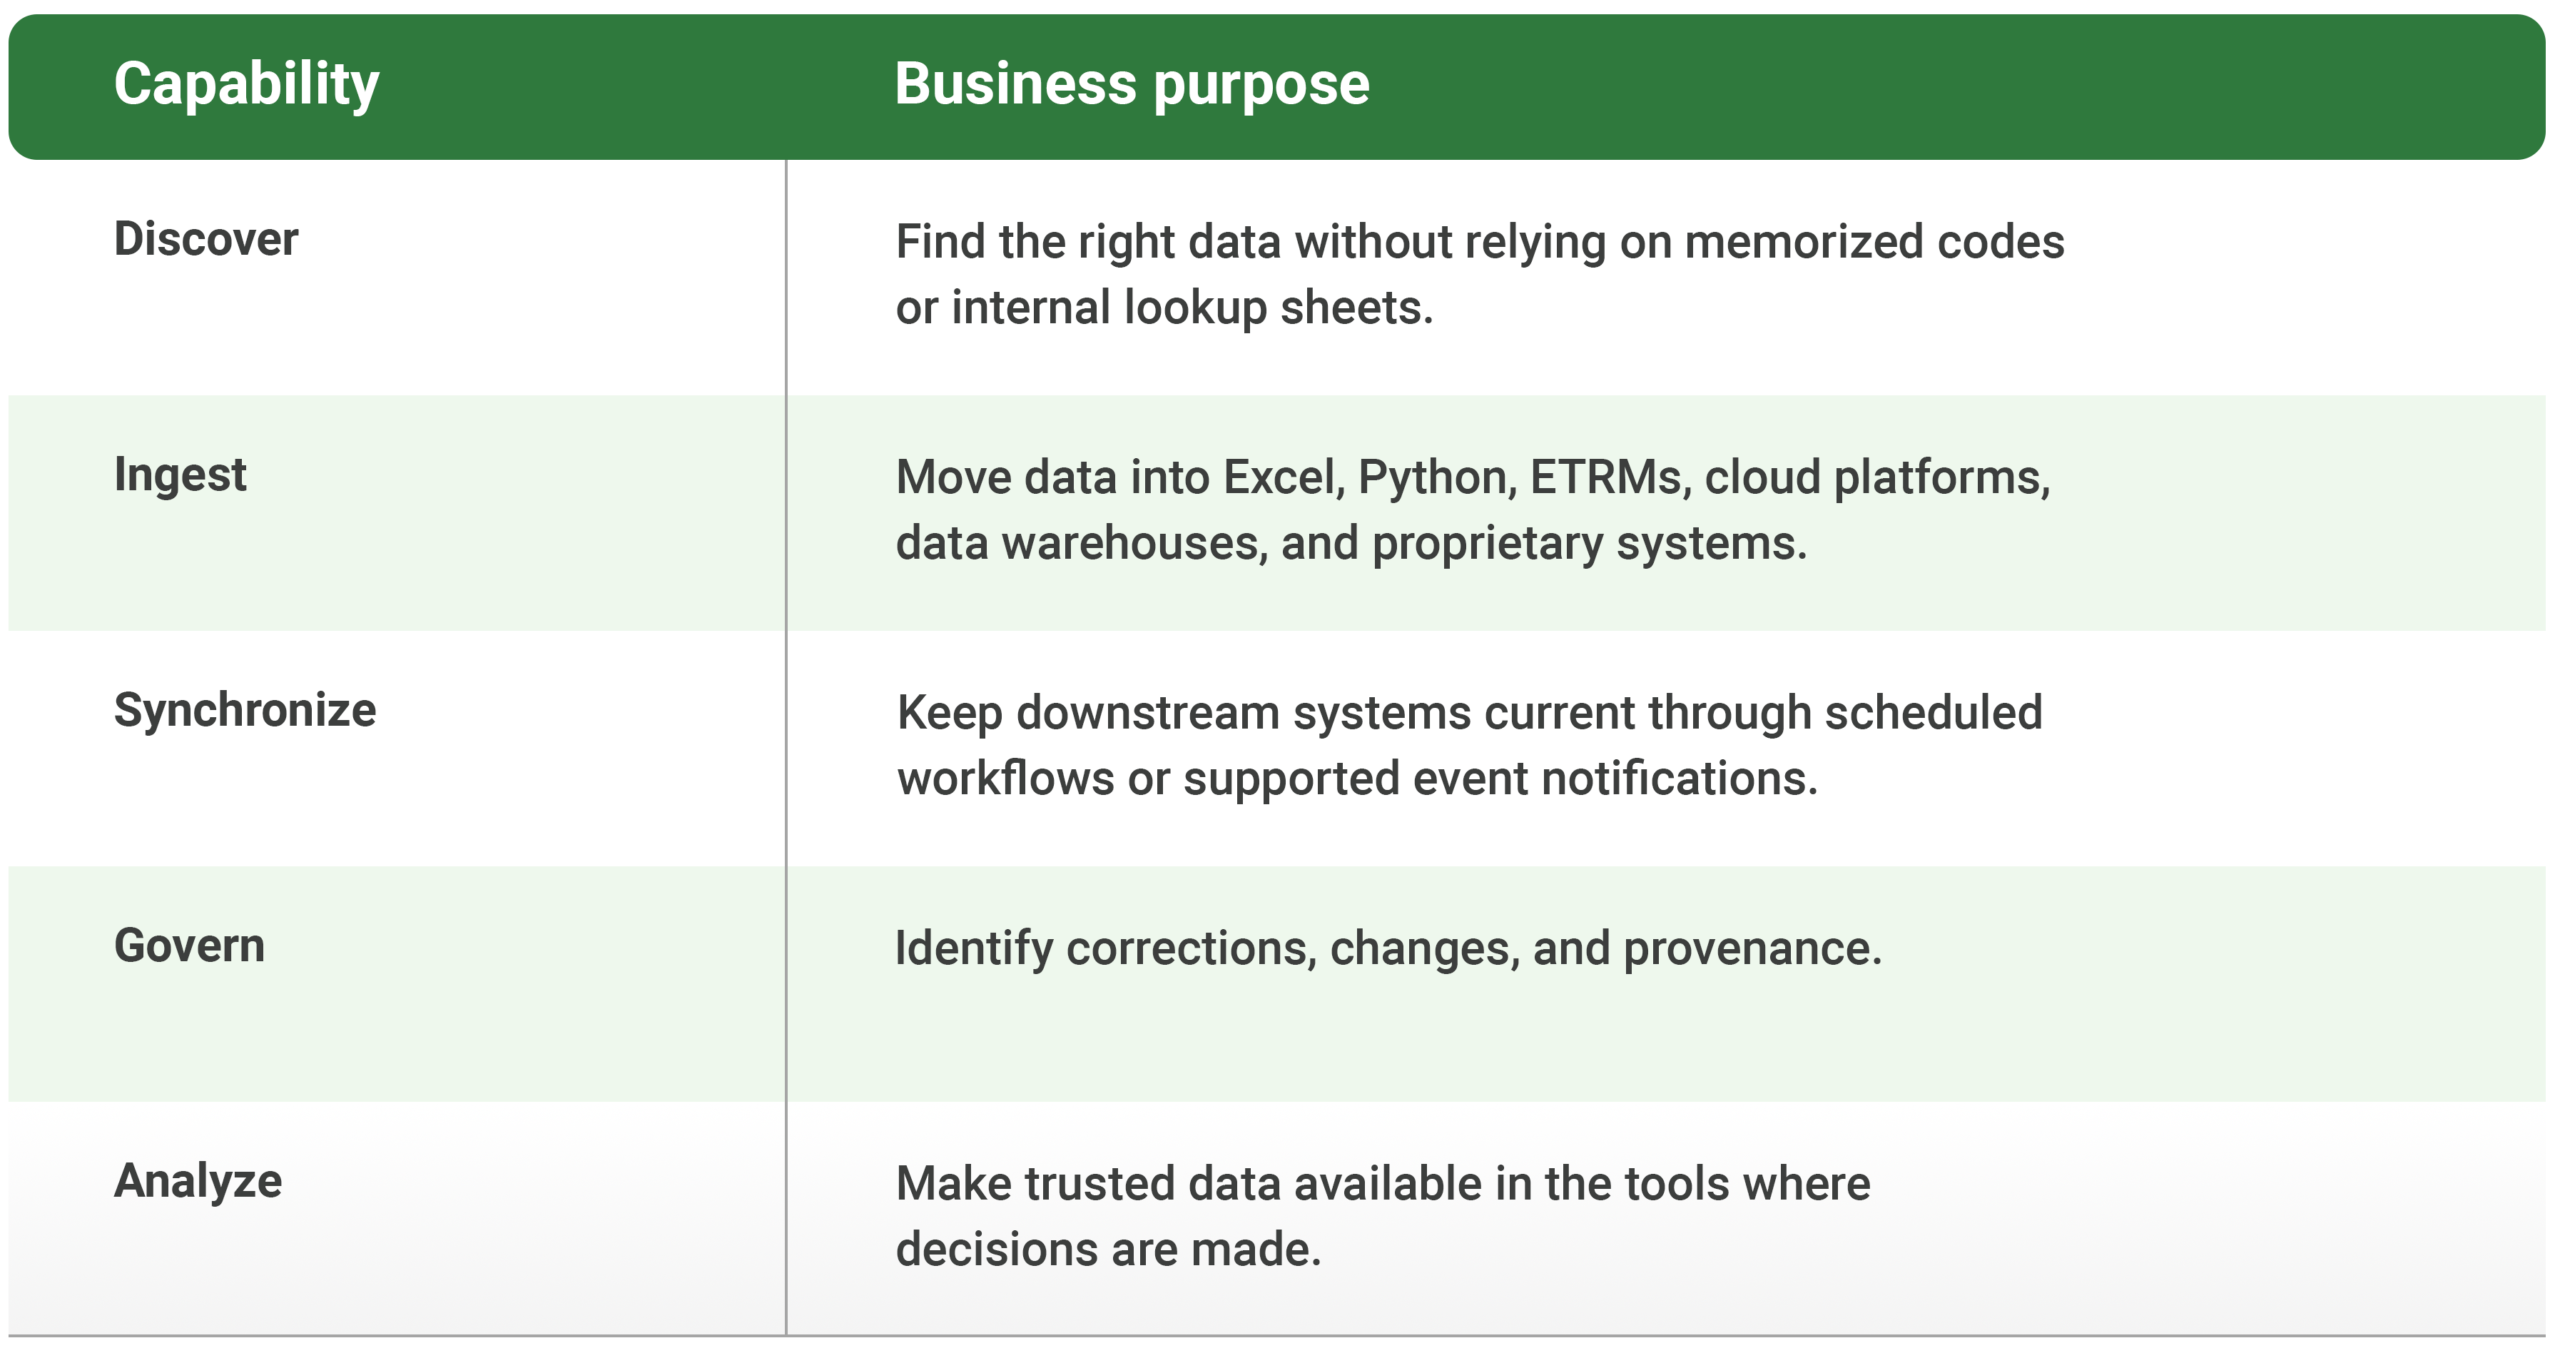
Market data operationalization is the practice of making trusted market data discoverable, ingestible, synchronized, governed, and usable across the environments where decisions are made.
It begins with discovery. Users need to find the right data without relying on memorized codes or internal lookup sheets. It continues with ingestion, moving data into Excel, Python, ETRMs, cloud platforms, data warehouses, and proprietary systems. It requires synchronization so downstream systems remain current through scheduled workflows or event-driven notifications. It requires governance so teams can identify corrections, changes, and provenance. Finally, it makes data available for analysis in the tools where analysts and decision-makers already work.
Ingestion is a critical stage, but it is not the entire problem. Discovery without ingestion creates access without use. Ingestion without synchronization creates stale systems. Synchronization without governance creates uncertainty. Operationalization connects those stages into one business capability.
Across conversations with energy trading organizations, the technology stacks vary, but the operating problems are often similar.
A trading and pricing team described mapping as the limiting factor in API adoption. Another organization said it needed to move toward a more real-time pull to feed downstream execution platforms. A risk-focused team emphasized the need to identify corrections and track what changed over time. Other customers want to preserve their existing provider relationships and licenses while simplifying how data reaches their systems.
These are not separate product requests. They are different expressions of the same operating challenge: market data exists, but it does not become usable consistently across every workflow.
The solution must also respect the reality of a heterogeneous environment. Some analysts work in Excel. Quantitative teams may work in Python. Risk organizations depend on ETRMs. Data engineers manage cloud platforms and custom pipelines. The objective is not to force every team into one interface. It is to make trusted market data usable wherever work already happens.
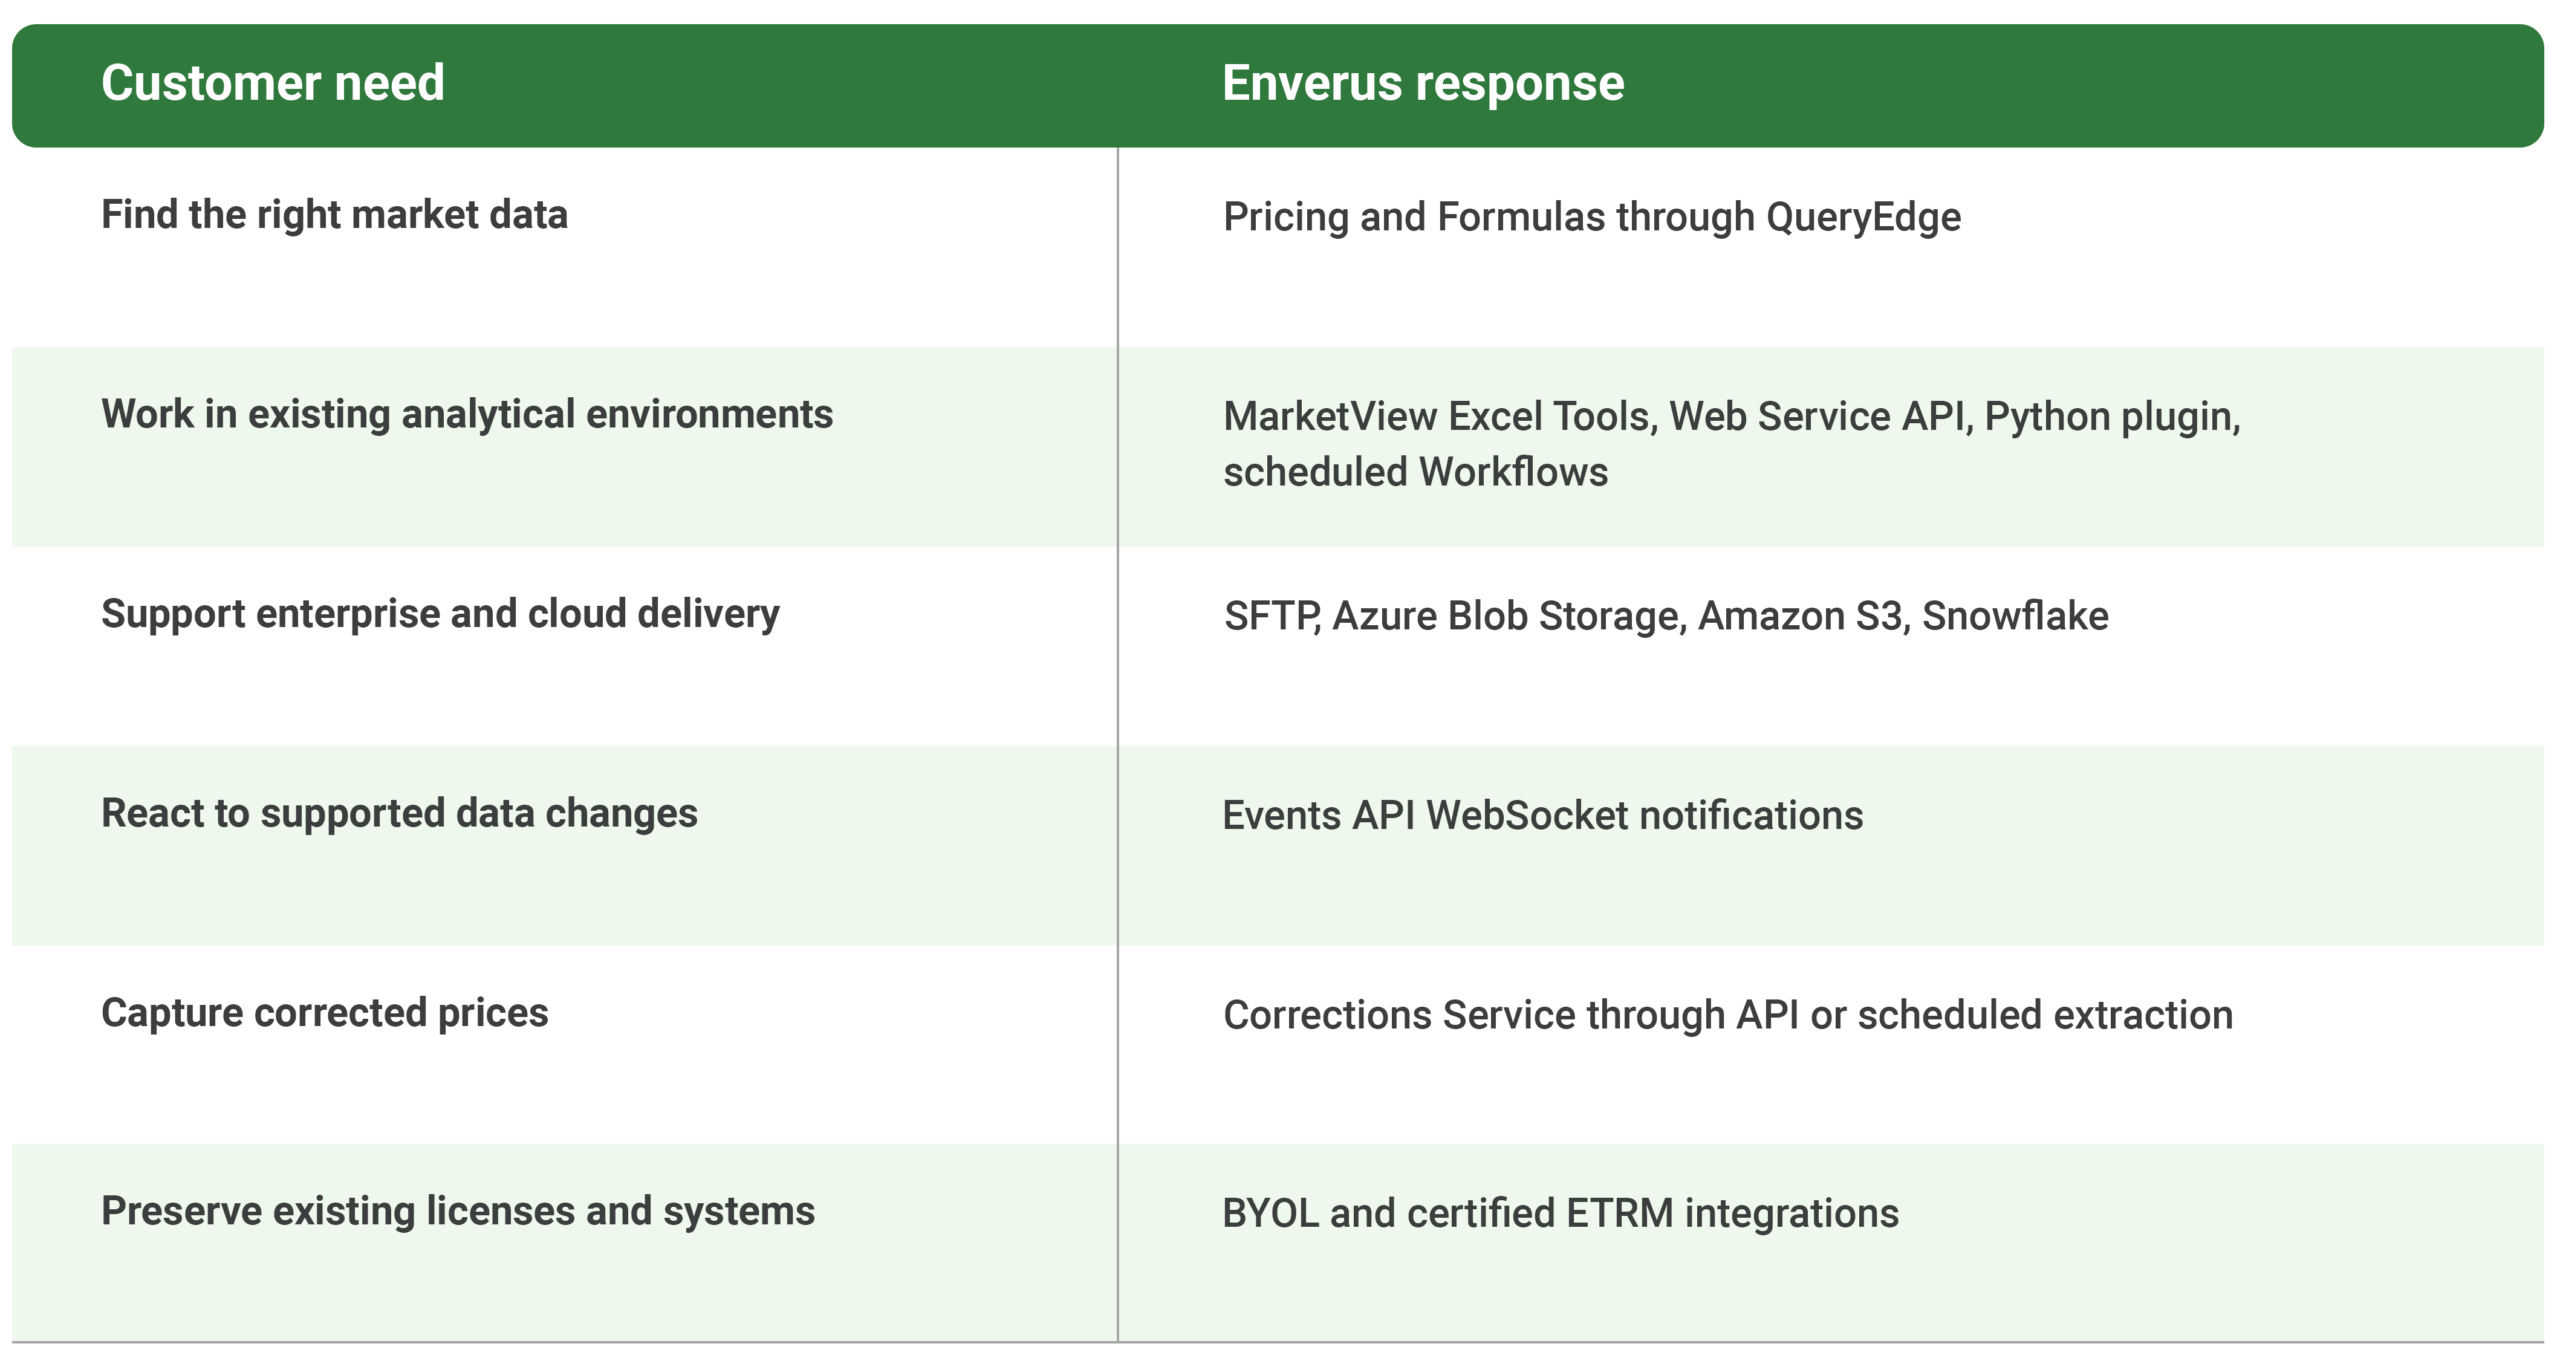
This operating reality is why Enverus has invested in multiple ways to discover, ingest, synchronize, and govern market data.
Pricing and Formulas through QueryEdge helps users find the right symbols and datasets without relying on a data dictionary. MarketView Excel Tools bring live and historical market data, formulas, and forward curves into spreadsheets. The MarketView Web Service API provides programmatic access to pricing, historical data, end-of-day values, forward curves, corrections, live/ intraday dat, calendar details and other supported request types. The Python plugin supports model development and automated analytical workflows without requiring teams to build raw HTTP requests.
Sphere Workflows supports scheduled extraction in formats including CSV, Excel, XML, JSON, text, and Apache Parquet. Delivery options include email, SFTP, Azure Blob Storage, Amazon S3, and Snowflake. The Events API uses WebSocket notifications to alert client systems when supported data events occur, reducing the need for repeated polling. The Corrections Service helps teams identify provider corrections through the API or scheduled extraction workflows. Certified integrations with ION’s OpenLinkEndur, Allegro, TriplePoint (CXL), Right Angle, Fendahl’s Fusion, and Molecule support established trading environments. BYOL allows customers to preserve existing vendor relationships and permissions while using Enverus as a delivery layer.
Across these capabilities, the design principle is consistent: Enverus does not assume that every analyst, model, or system consumes data the same way.
The objective is to reduce the manual work between market data and market insight. That means helping customers find the right information, move it into the environments they already use, keep downstream workflows current, and govern changes with greater consistency.
Every trading organization should periodically ask one question: How much of our analytical capacity is spent producing insight, and how much is spent preparing market data?
That question leads to more practical ones. Where do analysts manually intervene? How are corrections captured? How many integration paths are maintained? Can users find the right data without specialist knowledge? How quickly do supported changes reach downstream systems? Which workflows still depend on a person remembering to act?
The goal is not to replace every system or rebuild the technology stack. It is to identify where trusted market data loses time, consistency, or usability as it moves through the organization.
Every trading organization should periodically ask one question: How much of our analytical capacity is spent producing insight, and how much is spent preparing market data?
That question leads to more practical ones. Where do analysts manually intervene? How are corrections captured? How many integration paths are maintained? Can users find the right data without specialist knowledge? How quickly do supported changes reach downstream systems? Which workflows still depend on a person remembering to act?
The goal is not to replace every system or rebuild the technology stack. It is to identify where trusted market data loses time, consistency, or usability as it moves through the organization.
Map how market data enters your organization and identify sources of Invisible Data Work so workflows can be automated or simplified.

Let’s get started!
Let’s get started!
We’ll follow up right away to show you a quick product tour.
Ready to Subscribe?
Ready to Get Started?