A Market-by-Market Guide to Heat, Congestion, and Price Risk Across 8 ISOs

This report presents Enverus Power Analytics’ summer 2026 outlook for North American wholesale electricity markets — covering ERCOT, SPP, PJM, MISO, CAISO, Mid-C, NYISO, and ISO-NE. It examines weather drivers, supply stack evolution, transmission changes, new builds, and price and heat rate forecasts for June through August 2026.
The analytical foundation for all regional forecasts is Enverus’s ENSO analog year methodology: identifying historical years with similar Oceanic Niño Index (ONI) patterns and using them as the basis for temperature, wind, and load projections. For 2026, the primary analog years are 2018 and 2023 across all markets, with the team increasingly weighting 2023 as models trend toward a stronger-than-expected El Niño.
This report is intended for traders, resource planners, utility operations teams, renewable developers, and power market analysts who need a rapid, expert-level orientation to summer 2026 risk across all ISOs. All price and heat rate forecasts are based on Enverus Power Analytics’ proprietary stack modeling and should be verified against current market data before use in trading decisions.
Senior Director, Power Analytics. Rob began his career as a hydrologist for the Federal Government before moving into power markets. He worked for Pacific utilities and Bonneville Power in the Northwest, then moved to Houston in 2008 to join Deutsche Bank before spending several years at EDF Power Trading as Head of North America Power Analytics. He joined Enverus in 2018.
Director, Power Analytics. Adam brings approximately 20 years of power market experience, with roughly half that time at independent power producers — including International Power and Edison Mission — and the remainder on the information and analytics side of the industry.
Kenneth Curtis
Director, Power Analytics. Kenneth has over 20 years of power and wholesale market experience, including short-term physical and financial trading across most major US markets. Prior to joining Enverus, he served as an East Power Trader at Twin Eagle and a Power Trader & Asset Manager at EDF Trading.
Manas Trivedi
Principal Power Analyst. Manas holds a PhD in Electrical Engineering from Clemson University and previously worked at ERCOT, first as an Applications Developer and then as a subject matter expert in Congestion Revenue Rights modeling and analysis.
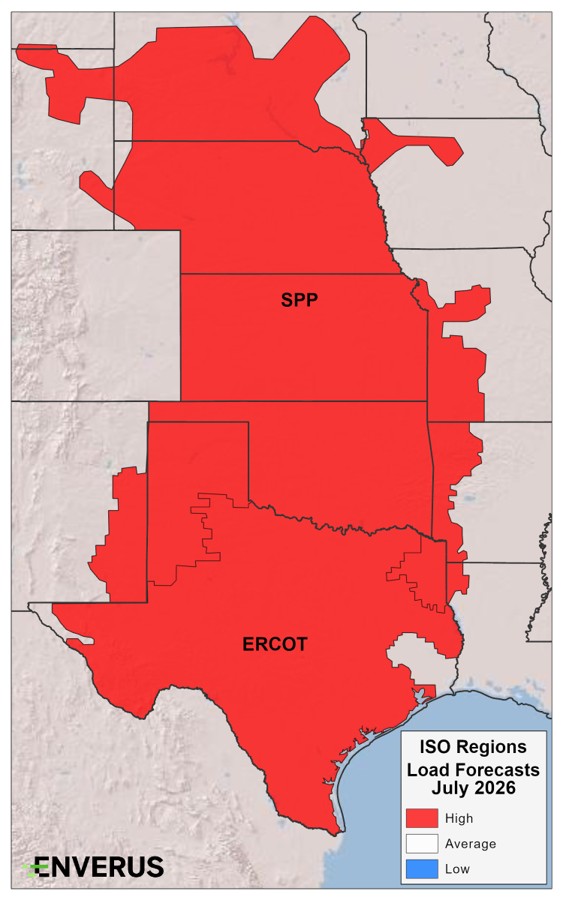
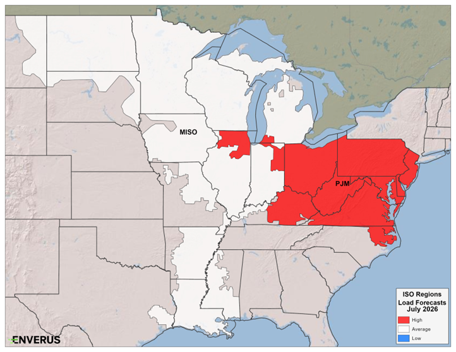
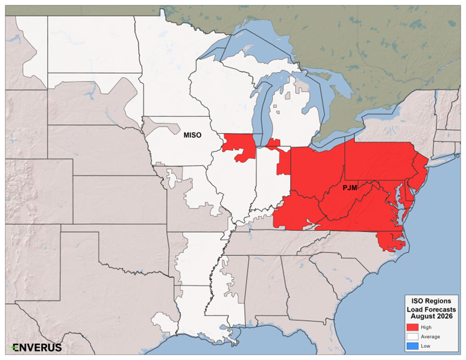
The table below summarizes the dominant risk driver, bull scenario, and bear scenario for each market. It is intended as a quick-reference orientation before reading the full chapter for each region.
ERCOT
Bullish
2023 heat analog + low wind + drought
SPP
Moderately Bullish
Southern heat bleeding north through July–Aug
PJM
Bullish (volatile)
Beddington-Black Oak outage + capacity tightness
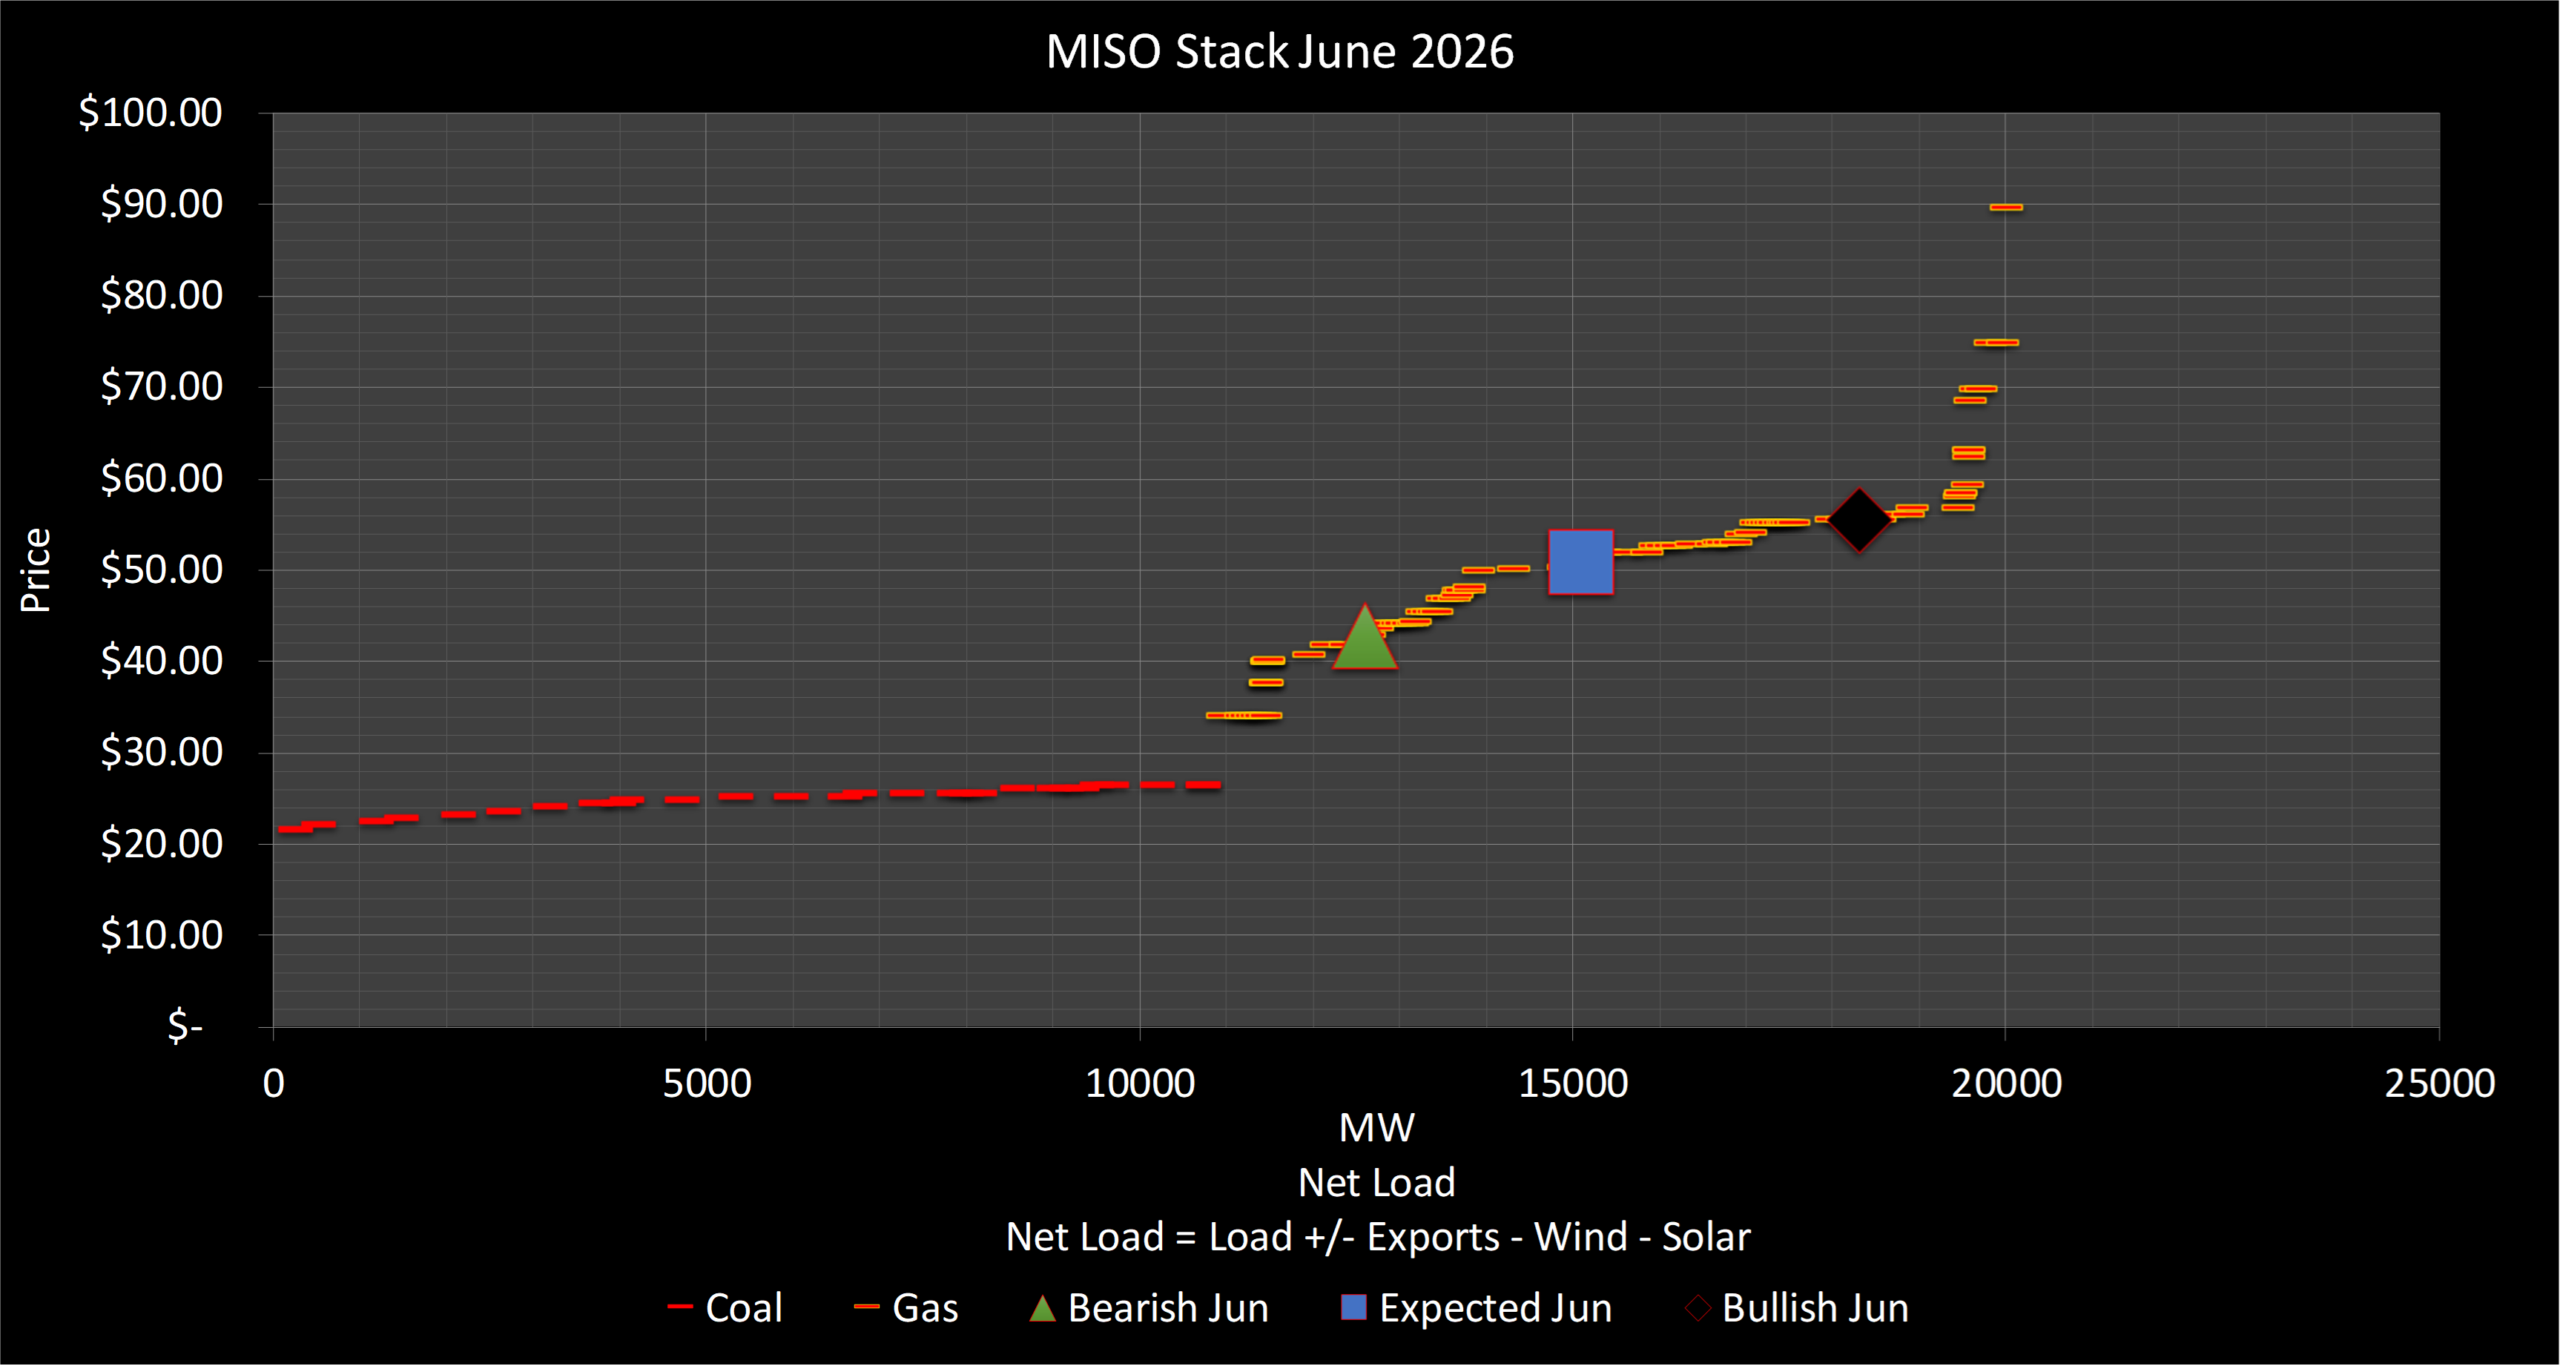
MISO
Moderately Bullish
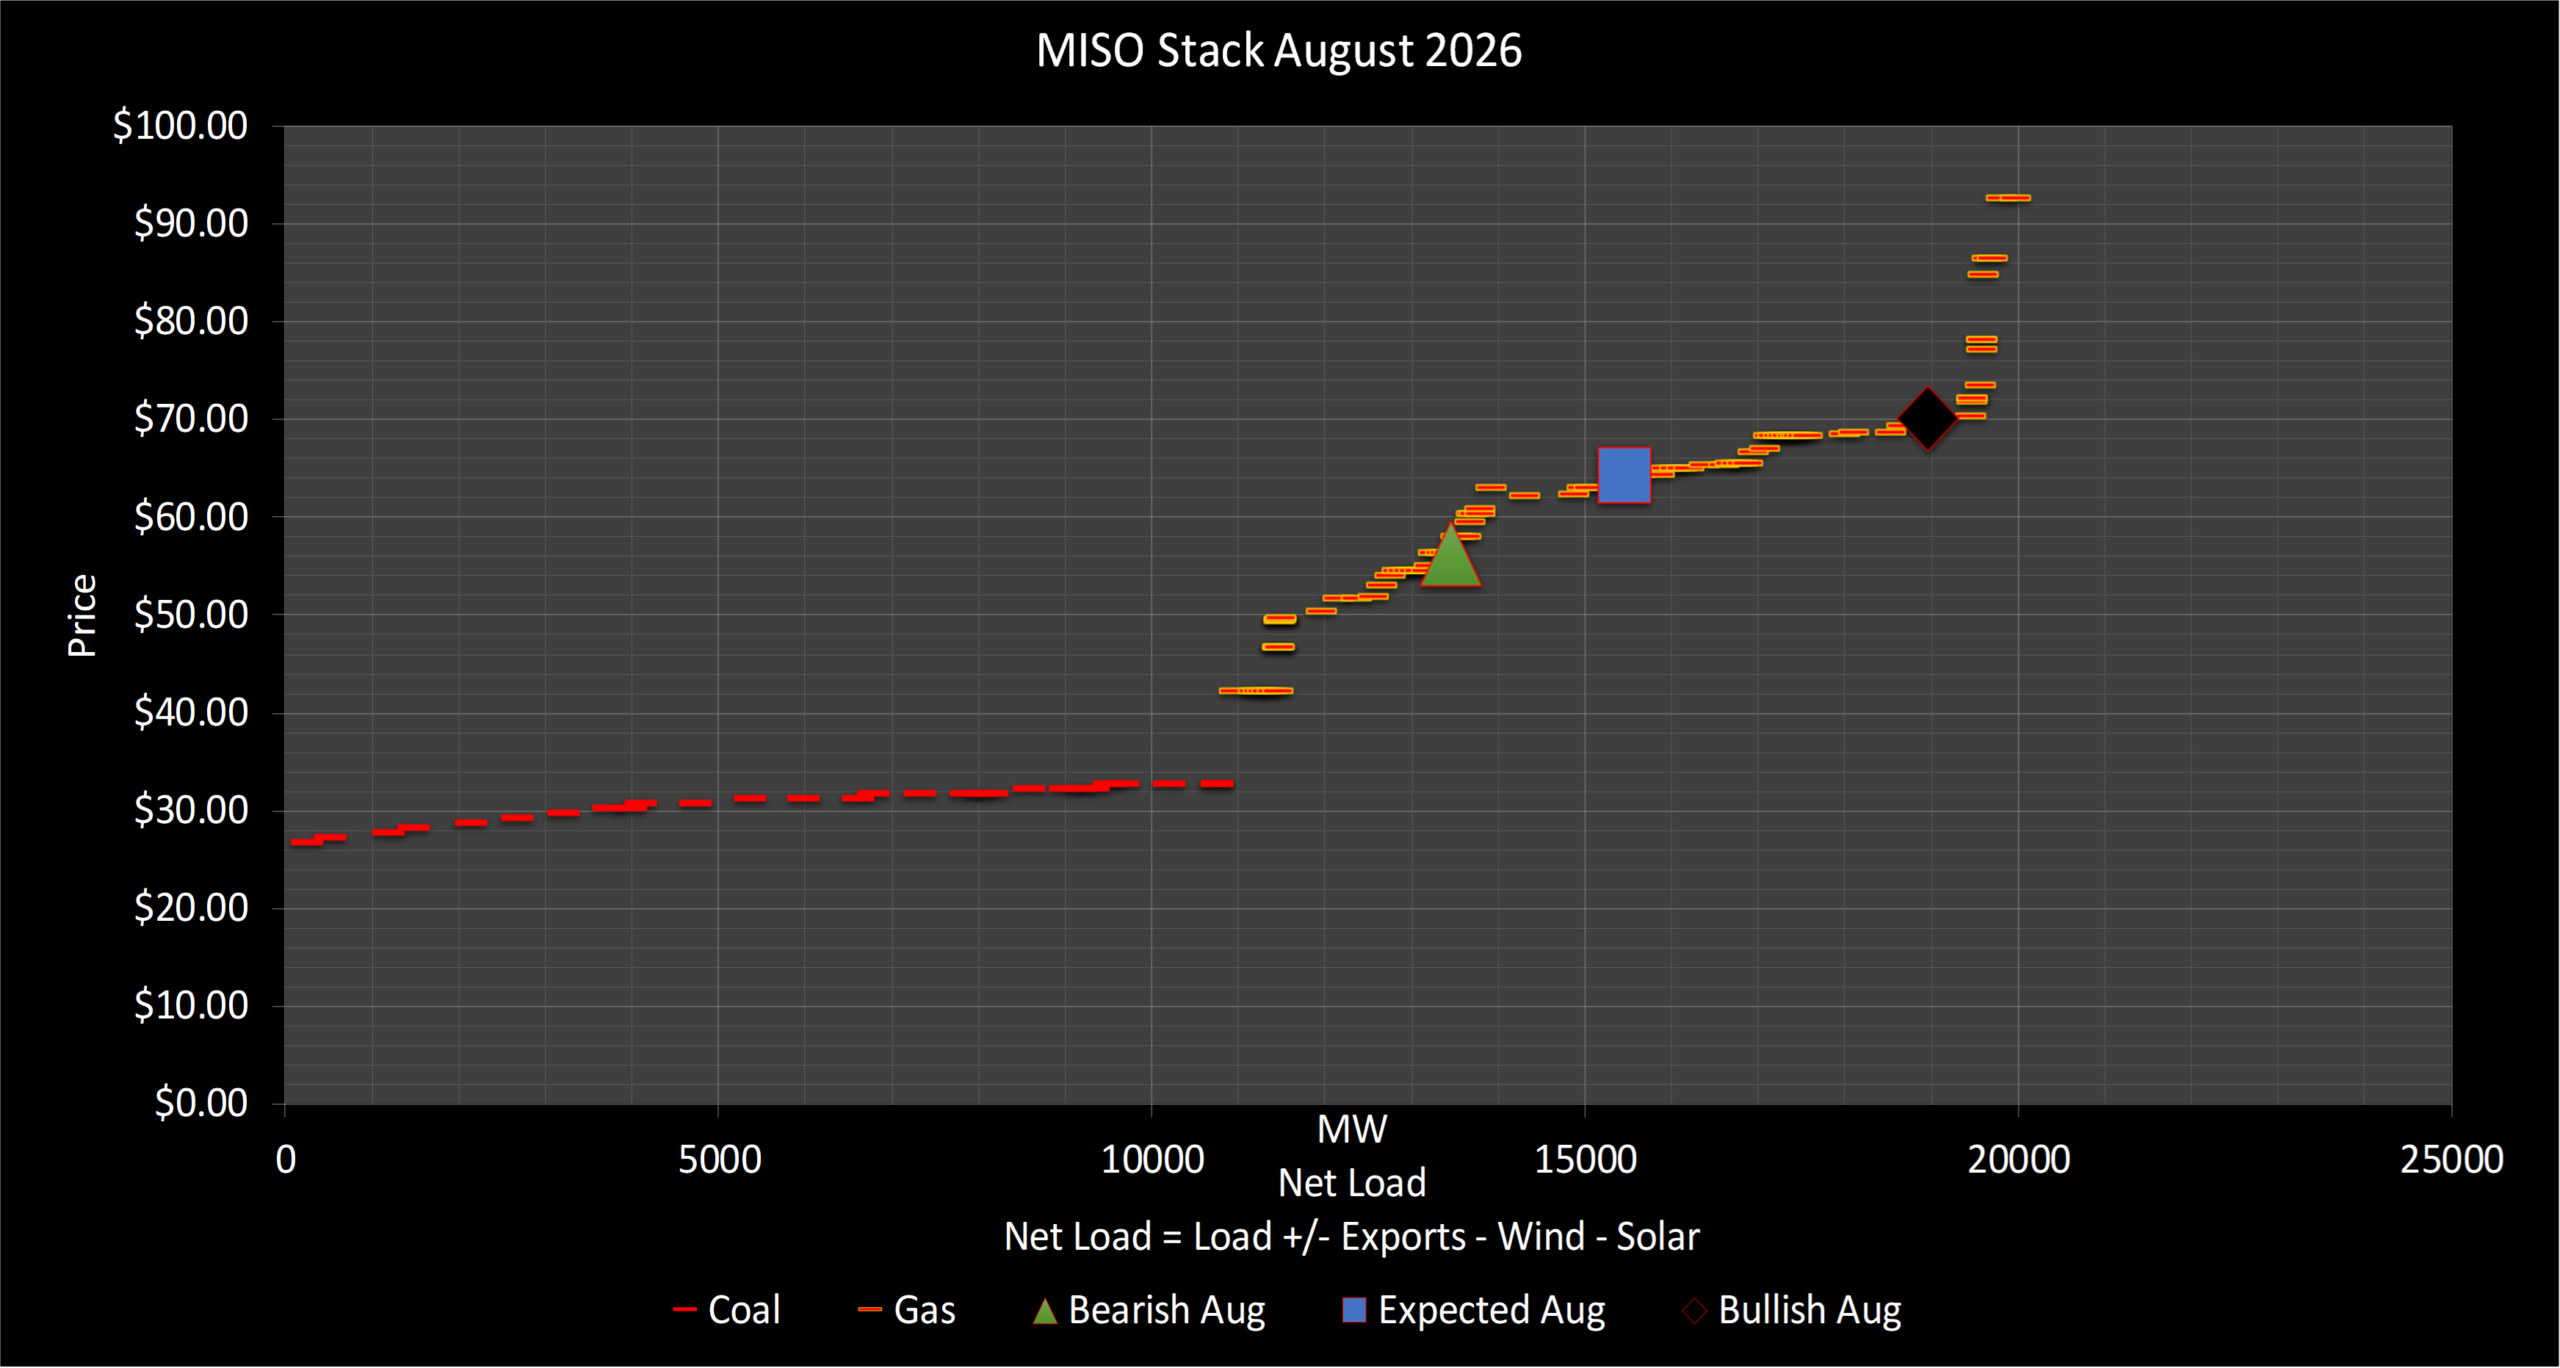
Orange County COD + Great Lakes cooling moderating start
CAISO
Bearish (with upside)
Sunzia + battery saturation + EDAM dynamics
Mid-C
Bullish (June); Neutral (July–Aug)
Canadian hydro surge in July; data center load growth
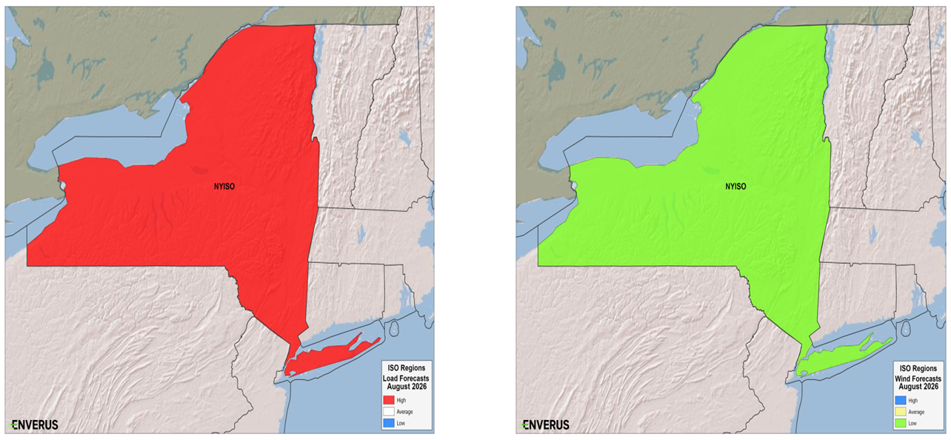
NYISO
Moderately Bullish
CHPE start + July heat in Zone J
ISO-NE
Moderately Bullish
NECEC curtailment risk during evening solar ramp-down
Every Enverus summer outlook begins with the same question: what does the current state of the El Niño–Southern Oscillation (ENSO) tell us about the coming season? ENSO conditions — measured by the Oceanic Niño Index (ONI), a three-month running mean of sea surface temperature anomalies in the Niño 3.4 region — have a well-documented influence on North American temperature patterns, precipitation, and atmospheric pressure regimes.
For summer 2026, global climate models have consistently shown a moderate-to-strong El Niño developing through the June–August period. The statistical average of model forecasts points to a JJA ONI of approximately +0.5 to +0.8 — squarely in moderate-to-strong El Niño territory. Models have been trending warmer as spring has progressed, and the Enverus team has progressively shifted its weight toward the higher end of that range.
The methodology works by identifying historical years with a similar ENSO pattern — specifically, the transition from La Niña to El Niño conditions — and using those years as analogs for temperature, wind, and precipitation forecasts. For 2026, the two analog years that best fit that pattern are 2018 and 2023. Their average ONI during JJA is approximately +0.4, though 2023’s individual reading of around +0.8 more closely matches the current model consensus. As a result, the Enverus team is increasingly leaning on 2023 as the primary analog year across all markets — and any market participant who traded power in the summer of 2023 knows what that means.
When you average the 2018 and 2023 analog years and overlay current drought and soil moisture conditions, a consistent pattern emerges across the country:
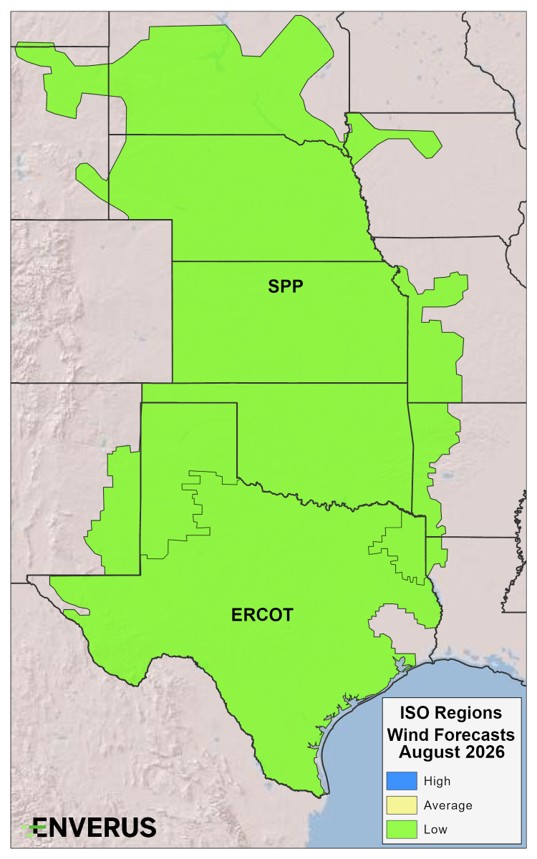
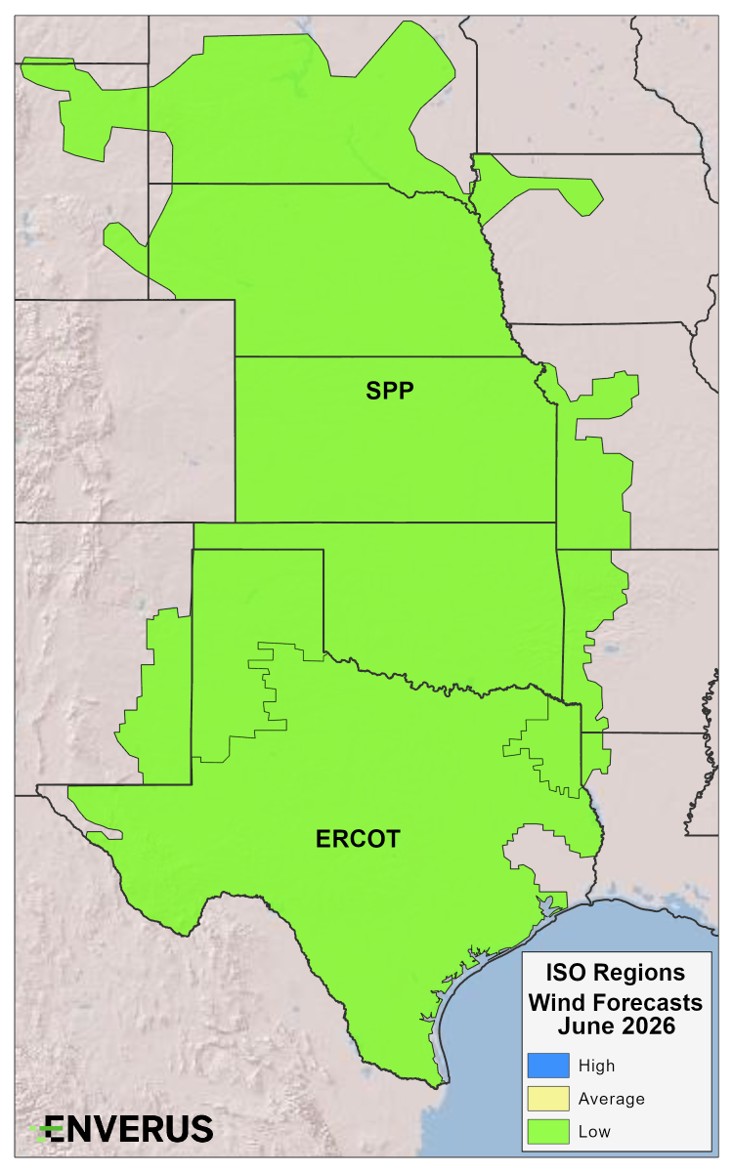
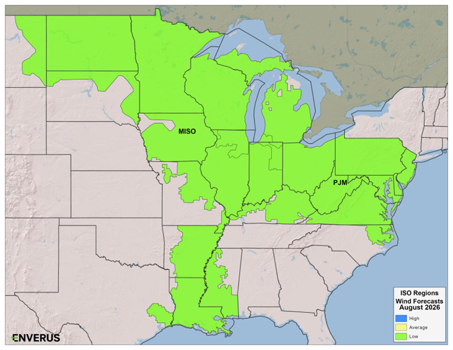
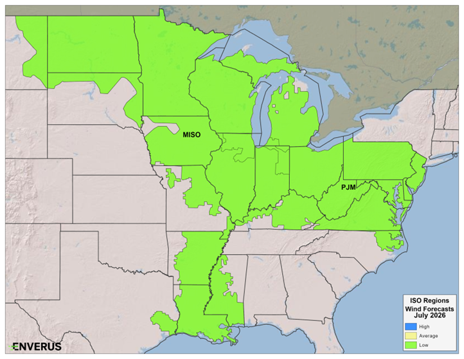
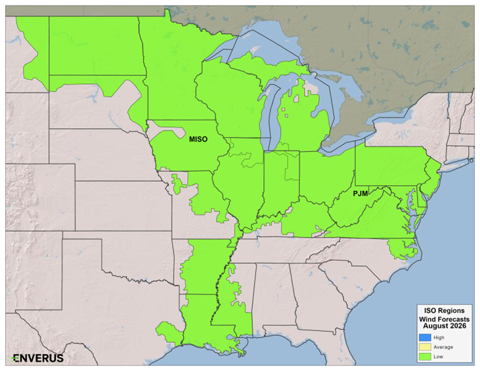
One theme cuts across every single market in this outlook: wind generation is expected to be below average across much of the country for the bulk of the summer. The dominant high-pressure ridge that drives the heat also suppresses the atmospheric flow that drives wind generation. This is not a regional quirk — it is a structural feature of the El Niño analog pattern that shows up in ERCOT, SPP, PJM, MISO, and the Northeast alike.
The implications are significant. In markets that have become accustomed to heavy wind offsetting summer thermal demand — particularly ERCOT and SPP — the combination of extreme heat and low wind generation is the highest-risk scenario for supply adequacy and price spikes. The 2023 analog year, which produced the most extreme summer power prices many of these markets had ever seen, was defined precisely by this combination.
Perhaps the most important analytical tension in this summer outlook is the gap between headline load growth announcements and actual measured demand growth. Across nearly every ISO covered in this report, year-to-date load growth figures are running well below the levels implied by announced data center projects, hyperscaler build-outs, and electrification commitments.
In ERCOT, despite an enormous batch study queue of approved large load connections, measured grid utilization has been extraordinarily flat — most months within 50 megawatts of each other. In PJM, year-to-date on-peak load growth is running under 1%. In MISO, similar signals are emerging. The pattern appears to reflect two dynamics: first, the gap between interconnection approval and actual energization (projects that are approved but not yet drawing power); and second, a growing trend of behind-the-meter build — large customers constructing their own generation assets, removing load from the wholesale grid entirely.
This matters enormously for forward price risk. A bullish summer heat scenario on top of flat load growth looks very different from the same weather scenario on top of 4–5% load growth. The supply stack has continued to add solar and batteries, providing a cheaper backstop at moderate load levels. But on the extreme days — sustained 95+ degree weather, weak wind, overnight heat that prevents demand recovery — the flat load growth assumption breaks down and the 2023 analog reasserts itself.
The load growth that the market is pricing into forward curves may be more aspirational than actual. Utilization is running well below approved capacity across most ISOs. This suppresses the base case but does not reduce the tail risk on extreme weather days.
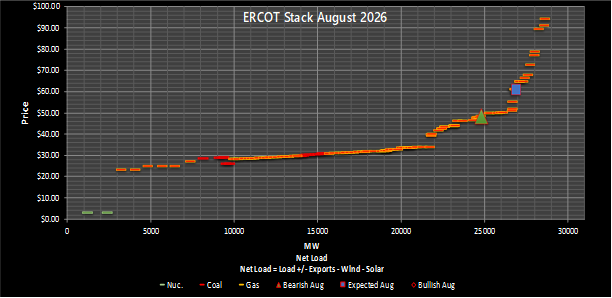
The theme for ERCOT this summer is straightforward: hot, dry, and low wind. The 2023 analog year is the primary lens, and the setup — building ridge of high pressure, strong Gulf of Mexico sea surface temperatures, drought conditions across much of Texas, poor soil moisture — closely mirrors conditions that produced the most extreme summer in ERCOT’s history.
One notable factor is the Atlantic hurricane season. Under El Niño conditions, increased upper-level wind shear tends to suppress hurricane formation, reducing the risk of storm-related market disruption. While this does not eliminate hurricane risk entirely, it is a modest bearish factor relative to the broader bullish setup.
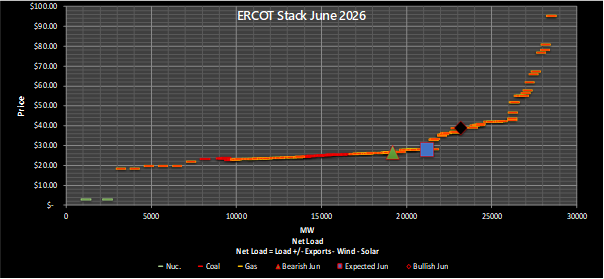
June: The season opens with sustained, strong cooling load — particularly notable for warm overnight lows that prevent demand recovery and keep daily demand elevated even before peak afternoon hours. Drought conditions amplify heat as ridges form. Analog year temperature data shows ERCOT system-weighted average highs in the mid-90s, with overnight lows in the mid-70s creating a high floor for cooling demand. The risk is asymmetric: a hot June day is price-sensitive while a cool day still stays on the expensive portion of the supply stack.


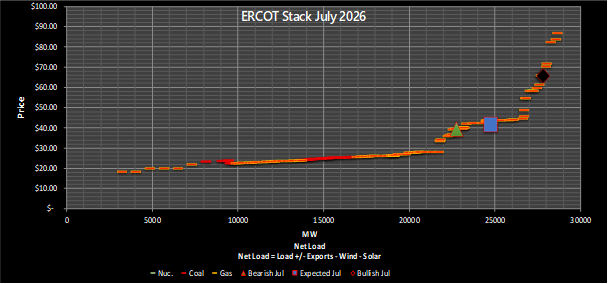
July: Unrelenting heat defines the month. Both analog years show average highs approaching or exceeding 95–100°F, with overnight lows staying in the mid-to-upper 70s — the kind of sustained warmth that keeps cooling load compounding overnight and day-over-day. Warm Gulf sea surface temperatures and drought conditions reinforce the heat. The MJO phase becomes an important intra-month variable: phases 1, 2, and 8 favor ridging and ERCOT heat, while phases 4 and 5 can introduce troughing and brief relief. Statistically, the first two weeks of August tend to produce the most extreme heat waves, but late July is equally likely as a trigger window. Wind generation is expected to be below average across the month as the dominant high-pressure pattern suppresses atmospheric flow.

August: The defining characteristic of August is the “baked-in” nature of the heat. Low soil moisture levels across Texas make triple-digit highs easier to achieve and harder to break, and the ridge tends to anchor most firmly this month, creating a high floor for daily demand. Both analog years show system-weighted average highs in the mid-to-upper 90s, with the 2023 analog showing overnight lows approaching 80°F — the kind of sustained overnight warmth that makes August the most dangerous month for sustained demand. The latter half of August is when MJO transitions and weak “backdoor” fronts from the northeast can begin to test the ridge’s resilience. Without those disruptions, the bullish risk remains dominant through the month.

Year-to-date load growth across ERCOT is running at approximately 2% since the start of 2025 — well below the 4–5% figures implied by the batch study approval queue. The disconnect between approved and energized large load is striking: ERCOT’s own data shows the approved large load total approaching 9 GW, while actual measured utilization across those connections is nearly flat, with most months within 50 megawatts of each other.
There are early signs of real load growth in specific locations. The Sanderson Switch area in North Houston has seen approximately 1 GW of additional on-peak demand since 2023 — measurable, consistent, and geographically concentrated. The Permian Basin’s Far West region continues to see oil and gas electrification demand that is more certain and closer to connection than hyperscaler announcements.
The supply stack evolution since August 2023 is significant. Solar and battery storage additions have substantially changed the shape of the daily supply curve. At any level of net load, it is cheaper to serve that load today than it was two years ago — a structural change that places a ceiling on prices during non-extreme conditions. The question for summer 2026 is whether the heat analog overwhelms that cheaper backstop.
ERCOT congestion for summer 2026 is expected to concentrate around four primary constraints:
The ERCOT price setup reflects a market that is cheaper to serve at moderate temperatures than it was in 2023, but faces potentially equal or greater heat risk:
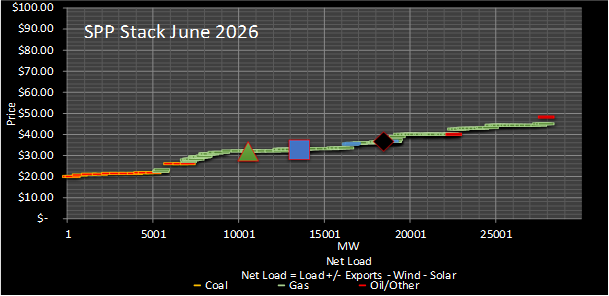
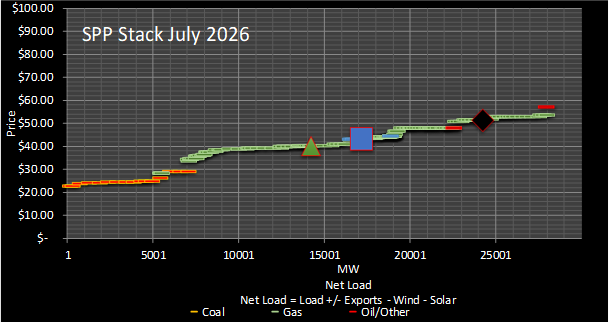
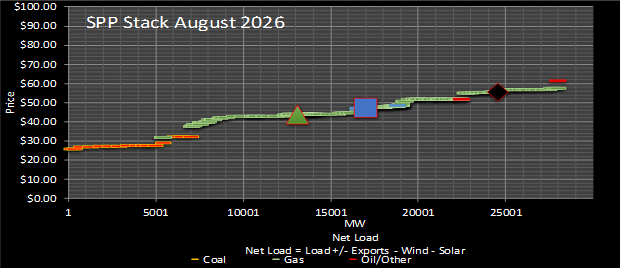
SPP’s summer setup is bullish but geographically differentiated — southern heat builds from the start while the northern plains follow several weeks behind as the Great Lakes cooling influence wanes.
June: Heat builds slowly across the SPP footprint. The northern areas — Kansas, Nebraska, and the Dakotas — remain influenced by the cooler Great Lakes air mass and are expected to start the summer at or near average temperatures. Analog year data shows average highs in the upper 80s to low 90s system-wide for June, with Oklahoma City running similarly. Wind generation should be relatively near average, with some risk of suppression as ridge development intensifies. Limited South Hub congestion risk in this early phase.
July: The most consistent heat month for SPP. Both analog years show the northern plains warming materially, with system-weighted average highs in the low-to-mid 90s and OKC reaching into the upper 90s and low 100s on peak days. Overnight lows rise to the point where cooling load can compound day-over-day. Wind generation is expected to be below average as persistent ridging suppresses atmospheric flow. This is the window when North Hub-South Hub dynamics are most likely to become price-significant.


August: Heat risk is geographically differentiated. Oklahoma and the southern plains carry the greatest upside risk, where persistent ridging and drought conditions create the most favorable setup for extended heat waves — OKC analog highs range into the upper 90s to 107°F. The central and northern plains are expected to run normal to just above normal, with some relief creeping in from the Dakotas by late month. Wind speeds tend to be below average under strong ridging, reinforcing the bullish supply picture for the month.


SPP congestion for summer 2026 is characterized by familiar, systemic constraints rather than new or surprising risks:
Unlike ERCOT, SPP appears to be largely skipping the solar build phase that has transformed other markets. While MISO to the east has seen strong solar expansion, SPP remains a wind-dominant market dependent on key thermal generators for price stability during hot, low-wind days. OPPD and NPPD have been forward-thinking on capacity additions — new gas units provide some backstop. Basin Electric is also building new gas capacity. Load growth in SPP has been more consistent than ERCOT, with particular concentration in oil and gas electrification (Permian Basin west, Bakken north) and early data center activity around Omaha (Meta) and Oklahoma (Google).
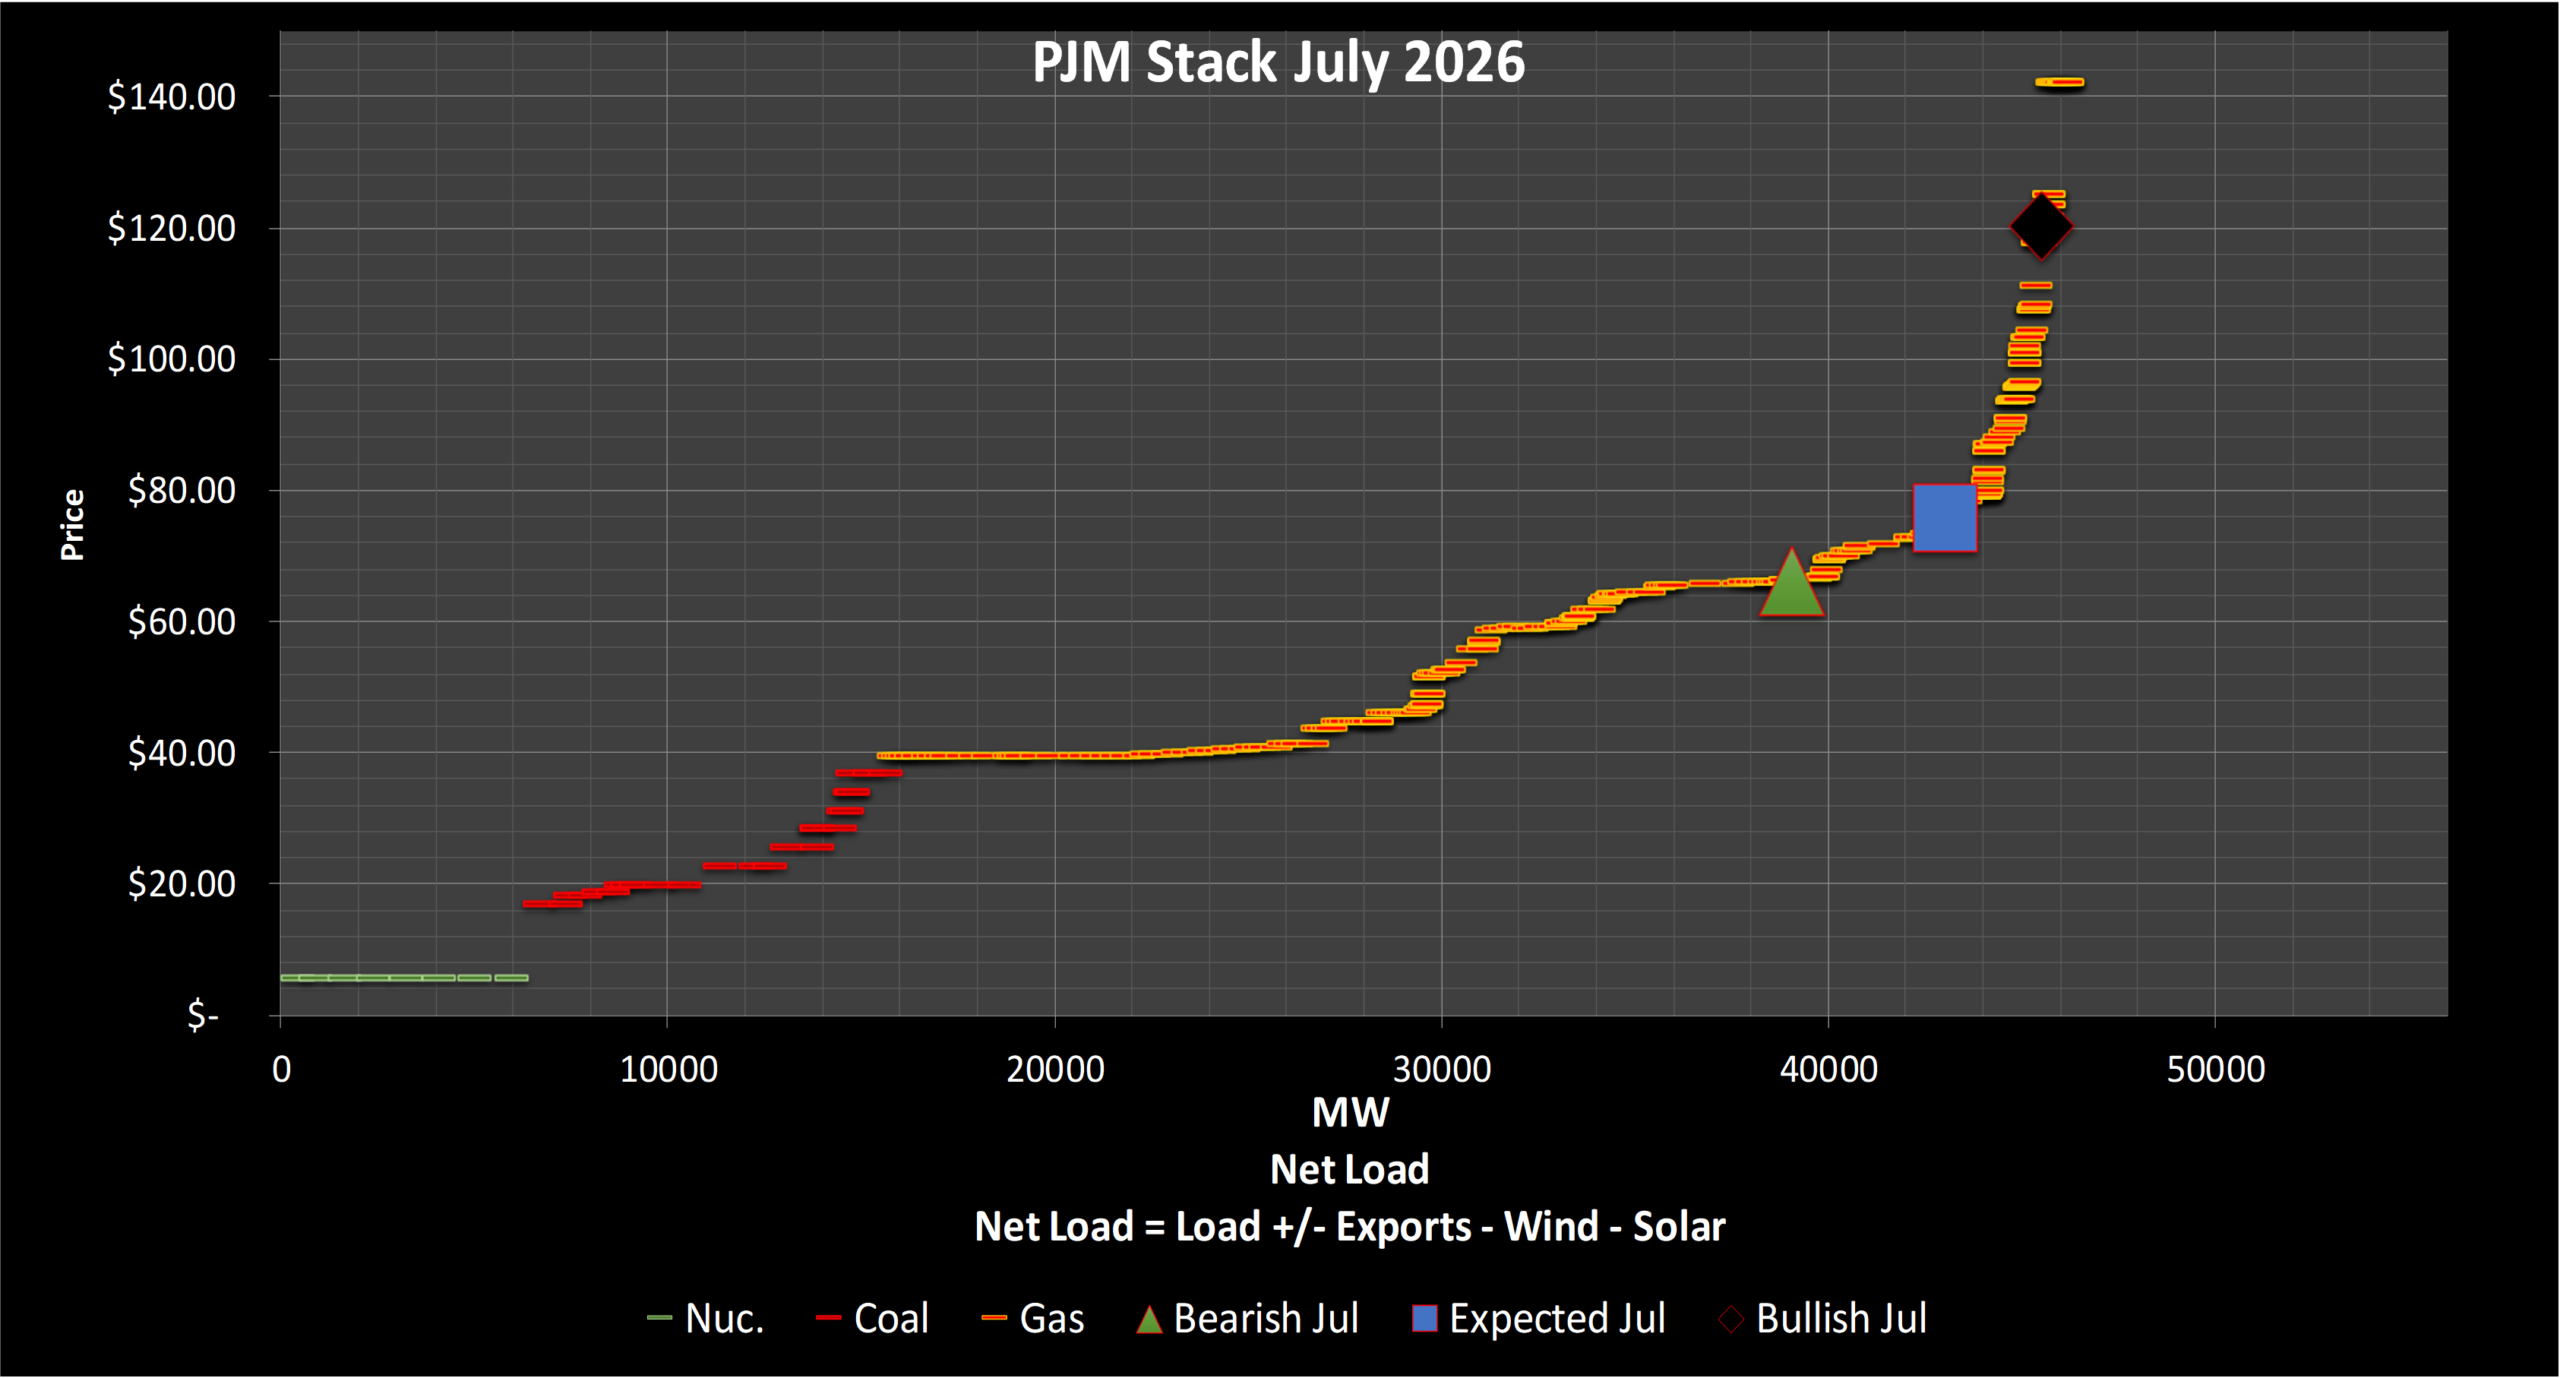
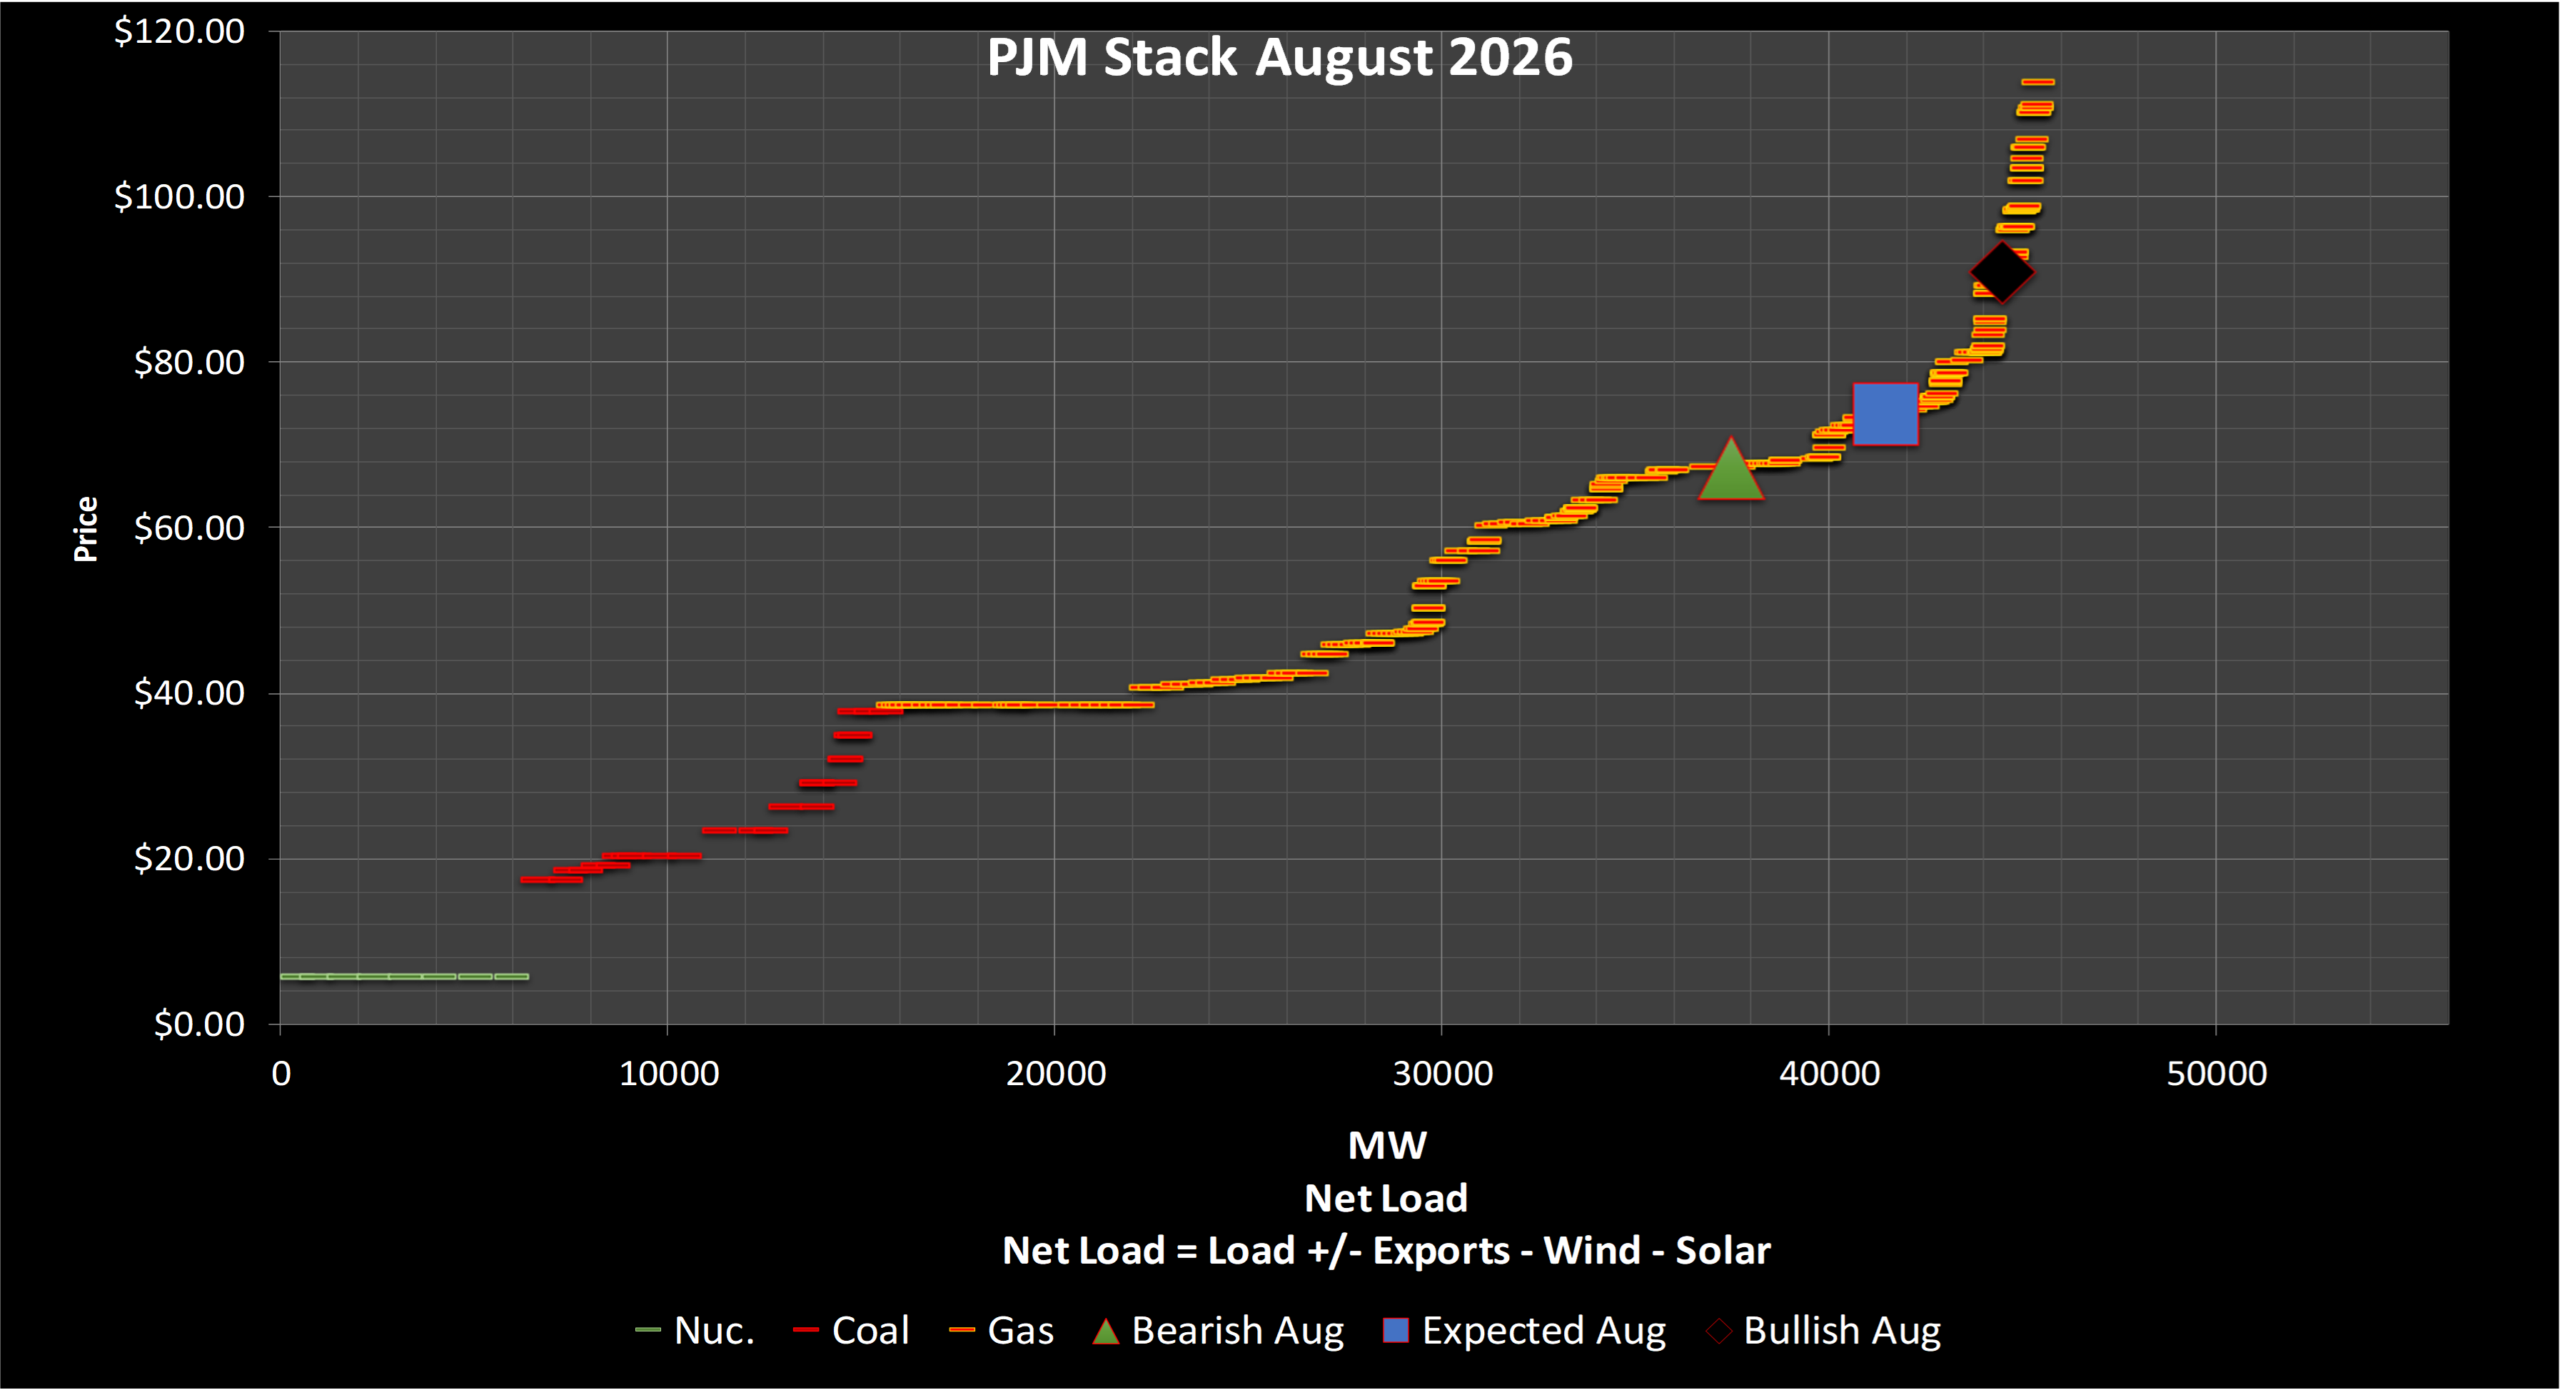
PJM’s weather setup for summer 2026 leans bullish, with the 2023 analog year taking increasing weight as models trend toward a stronger El Niño. The Dominion region (Virginia and the Carolinas) is showing growing drought conditions, a key ingredient for above-average heat. The Great Lakes influence may blunt the very start of summer — June could see a cooler open in the northern parts of the RTO — but by July, the broader heat pattern is expected to dominate. An early May heat wave — with temperatures approaching 99°F in parts of the Mid-Atlantic — provided an early preview of the summer pattern and suggests the cool-June scenario may not materialize at all.
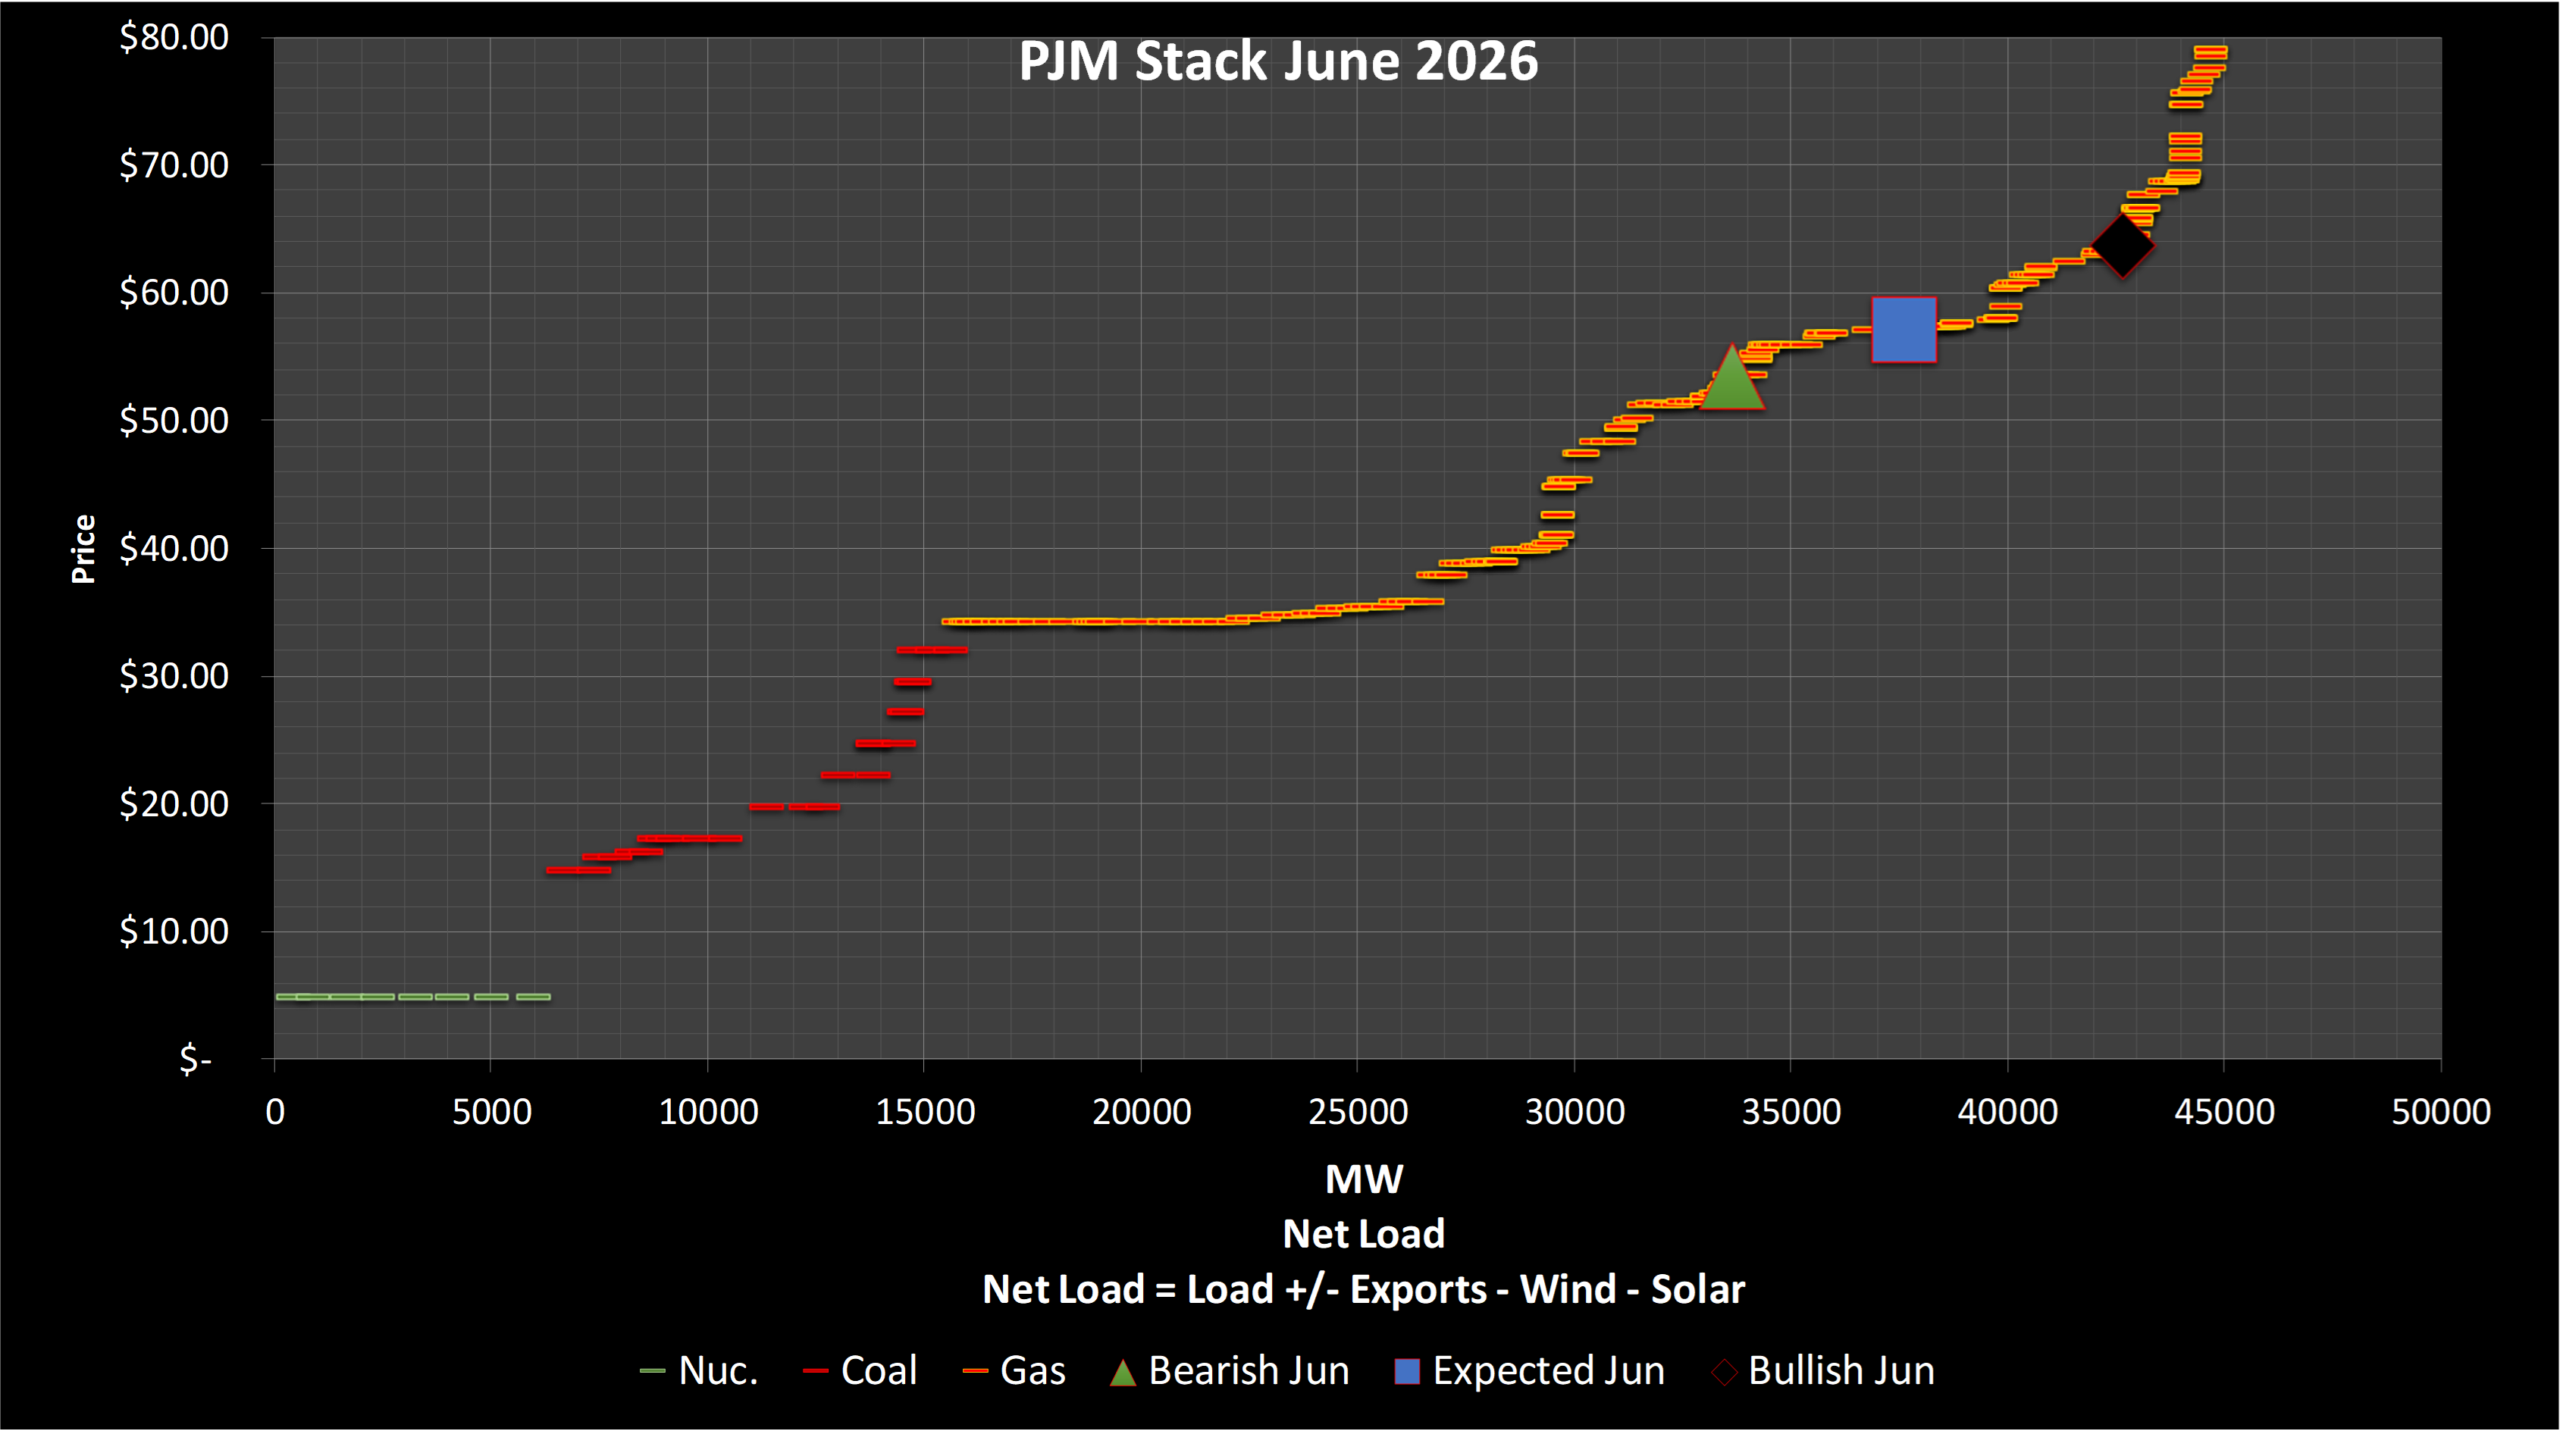
June: The analog years point to mostly below-average temperature anomalies — the 2018 analog shows a handful of warmer days with highs above 90°F in Chicago, Philadelphia, and D.C., but overall PJM is expected to start the summer on the softer side. The Beddington-Black Oak outage creates bullish congestion pressure that counteracts the moderate demand picture, keeping risk asymmetric to the upside. Wind generation is expected near average, providing some relief on moderate days. Below-market heat rate base case despite supportive outage profile.
July: Full summer heat arrives. Both analog years skew above-average load rather than flat average, reinforcing a firmer demand outlook. The 2023 analog stands out as the warmer of the two, with one to two Chicago days above 95°F alongside below-average wind — supporting higher net load risk. D.C. failed to reach 95°F in either analog year, which tempers the case for sustained, broad-based Mid-Atlantic heat-driven upside. Congestion risk is front-loaded into the first half of the month, adding a further layer of price asymmetry to an already bullish temperature setup.

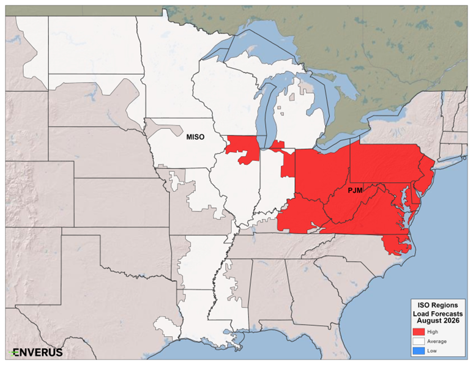
August: Above-average load conditions expected, consistent with both analog years. The 2023 analog shows roughly 15% of the month (approximately 5 days) above 95°F in Baltimore and D.C. — a meaningful tail-risk scenario. Soil moisture deficits in the Dominion region, if they persist, are a heat amplifier that would support the more bullish outcomes. Some transmission relief is expected mid-month, though above-average demand is expected to keep the supply picture tight.
Congestion in PJM this summer is heavily shaped by a specific set of planned transmission outages. Key windows to track:
The new supply story for PJM this summer is notable primarily for what is not coming: no combustion turbines, no combined cycles. A handful of solar additions are expected, but nothing at the scale that would meaningfully shift the supply stack. The larger story is offshore wind: the Coastal Virginia Offshore Wind Project (approximately 2–2.5 GW) is continuing to ramp, but analysts are treating this as a 2027 story, not summer 2026.
On retirements, the headline is: none expected. Units that have been flagged for retirement — including AES Shady Point (Elwood) — are expected to receive further DOE order extensions. At the Enverus Involved conference in May 2026, the Assistant Energy Secretary signaled a clear commitment to preventing further retirements across US power markets. As a result, the supply stack entering summer 2026 is the same stack that served last summer’s demand, minus any unit-specific outages or derates.
The most structurally significant development in PJM for summer 2026 is not a weather forecast or a transmission outage — it is the growing tension between what PJM’s own planning studies say about adequacy and what the capacity market is signaling.
PJM’s RTEP 2034 study delivered a stark conclusion: in worst-case peak load scenarios, the RTO does not have enough megawatts. This is a planning-study statement about physical shortfall, not a market price signal.
Simultaneously, PJM’s capacity collar — designed to prevent affordability shocks — has been constraining how high capacity prices can go. The market is telling developers that capacity is valuable and should attract new build, but the collar is preventing the price signal from fully transmitting.
The practical summer implication is twofold: first, reserves are genuinely tight, and the 5 GW threshold below which PJM’s operating reliability curve steepens sharply is a real risk on the hottest days. PJM’s April 2026 heat wave, which coincided with a high-outage season, gave a preview of how quickly reserve cushion can erode. Second, PJM has signaled it intends to move away from piecemeal capacity market fixes toward a more fundamental redesign — potentially incorporating bilateral contract structures similar to CAISO’s resource adequacy framework.
PJM’s RTEP 2034 study says the RTO is physically short in worst-case scenarios. The capacity collar says prices can’t go higher for affordability reasons. These two signals are in direct conflict — and the resolution will define PJM’s investment trajectory for the next decade.
PJM year-to-date load growth shows on-peak growth under 1% and off-peak growth just under 2%. As with other markets, this underperformance relative to announced data center and hyperscaler activity is being watched closely. One hypothesis is underutilization: projects are approved and under construction but not yet at full power draw. Another is the behind-the-meter trend — large customers building their own generation rather than drawing from the grid.
The Dominion region re-entering RGGI is an additional structural factor. Virginia’s carbon compliance costs will increase the marginal cost of gas generation in the Dominion zone, supporting a $1–$3 West Hub premium in the base case and potentially $2–$5 under higher RGGI price scenarios.
Last summer’s West Hub heat rates — 24.1 in June, 28.0 in July, and 18.8 in August — provide a useful baseline against which to read this summer’s setup. The 2026 outlook is meaningfully tighter across all three months, driven by the Beddington-Black Oak outage, above-average demand expectations, and RGGI cost pressure in the Dominion zone.
MISO’s summer setup is more nuanced than PJM’s. The Great Lakes — which came into this summer with anomalously cold surface temperatures following a harsh winter — are expected to moderate early-summer temperatures across the upper Midwest. The start of summer in MISO may feel more like 2018 than 2023, particularly in Indiana, Illinois, and the northern portions of the footprint.
June: The most moderate month for MISO. Both analog years point to mostly below-average temperature anomalies, supporting below-average demand with stronger wind generation. The 2018 analog is the warmer of the two, with occasional days above 90°F for Chicago, but these are isolated events rather than sustained heat. Wet soils across much of the upper Midwest are a key moderating factor, suppressing heat build-up through the early weeks of summer.


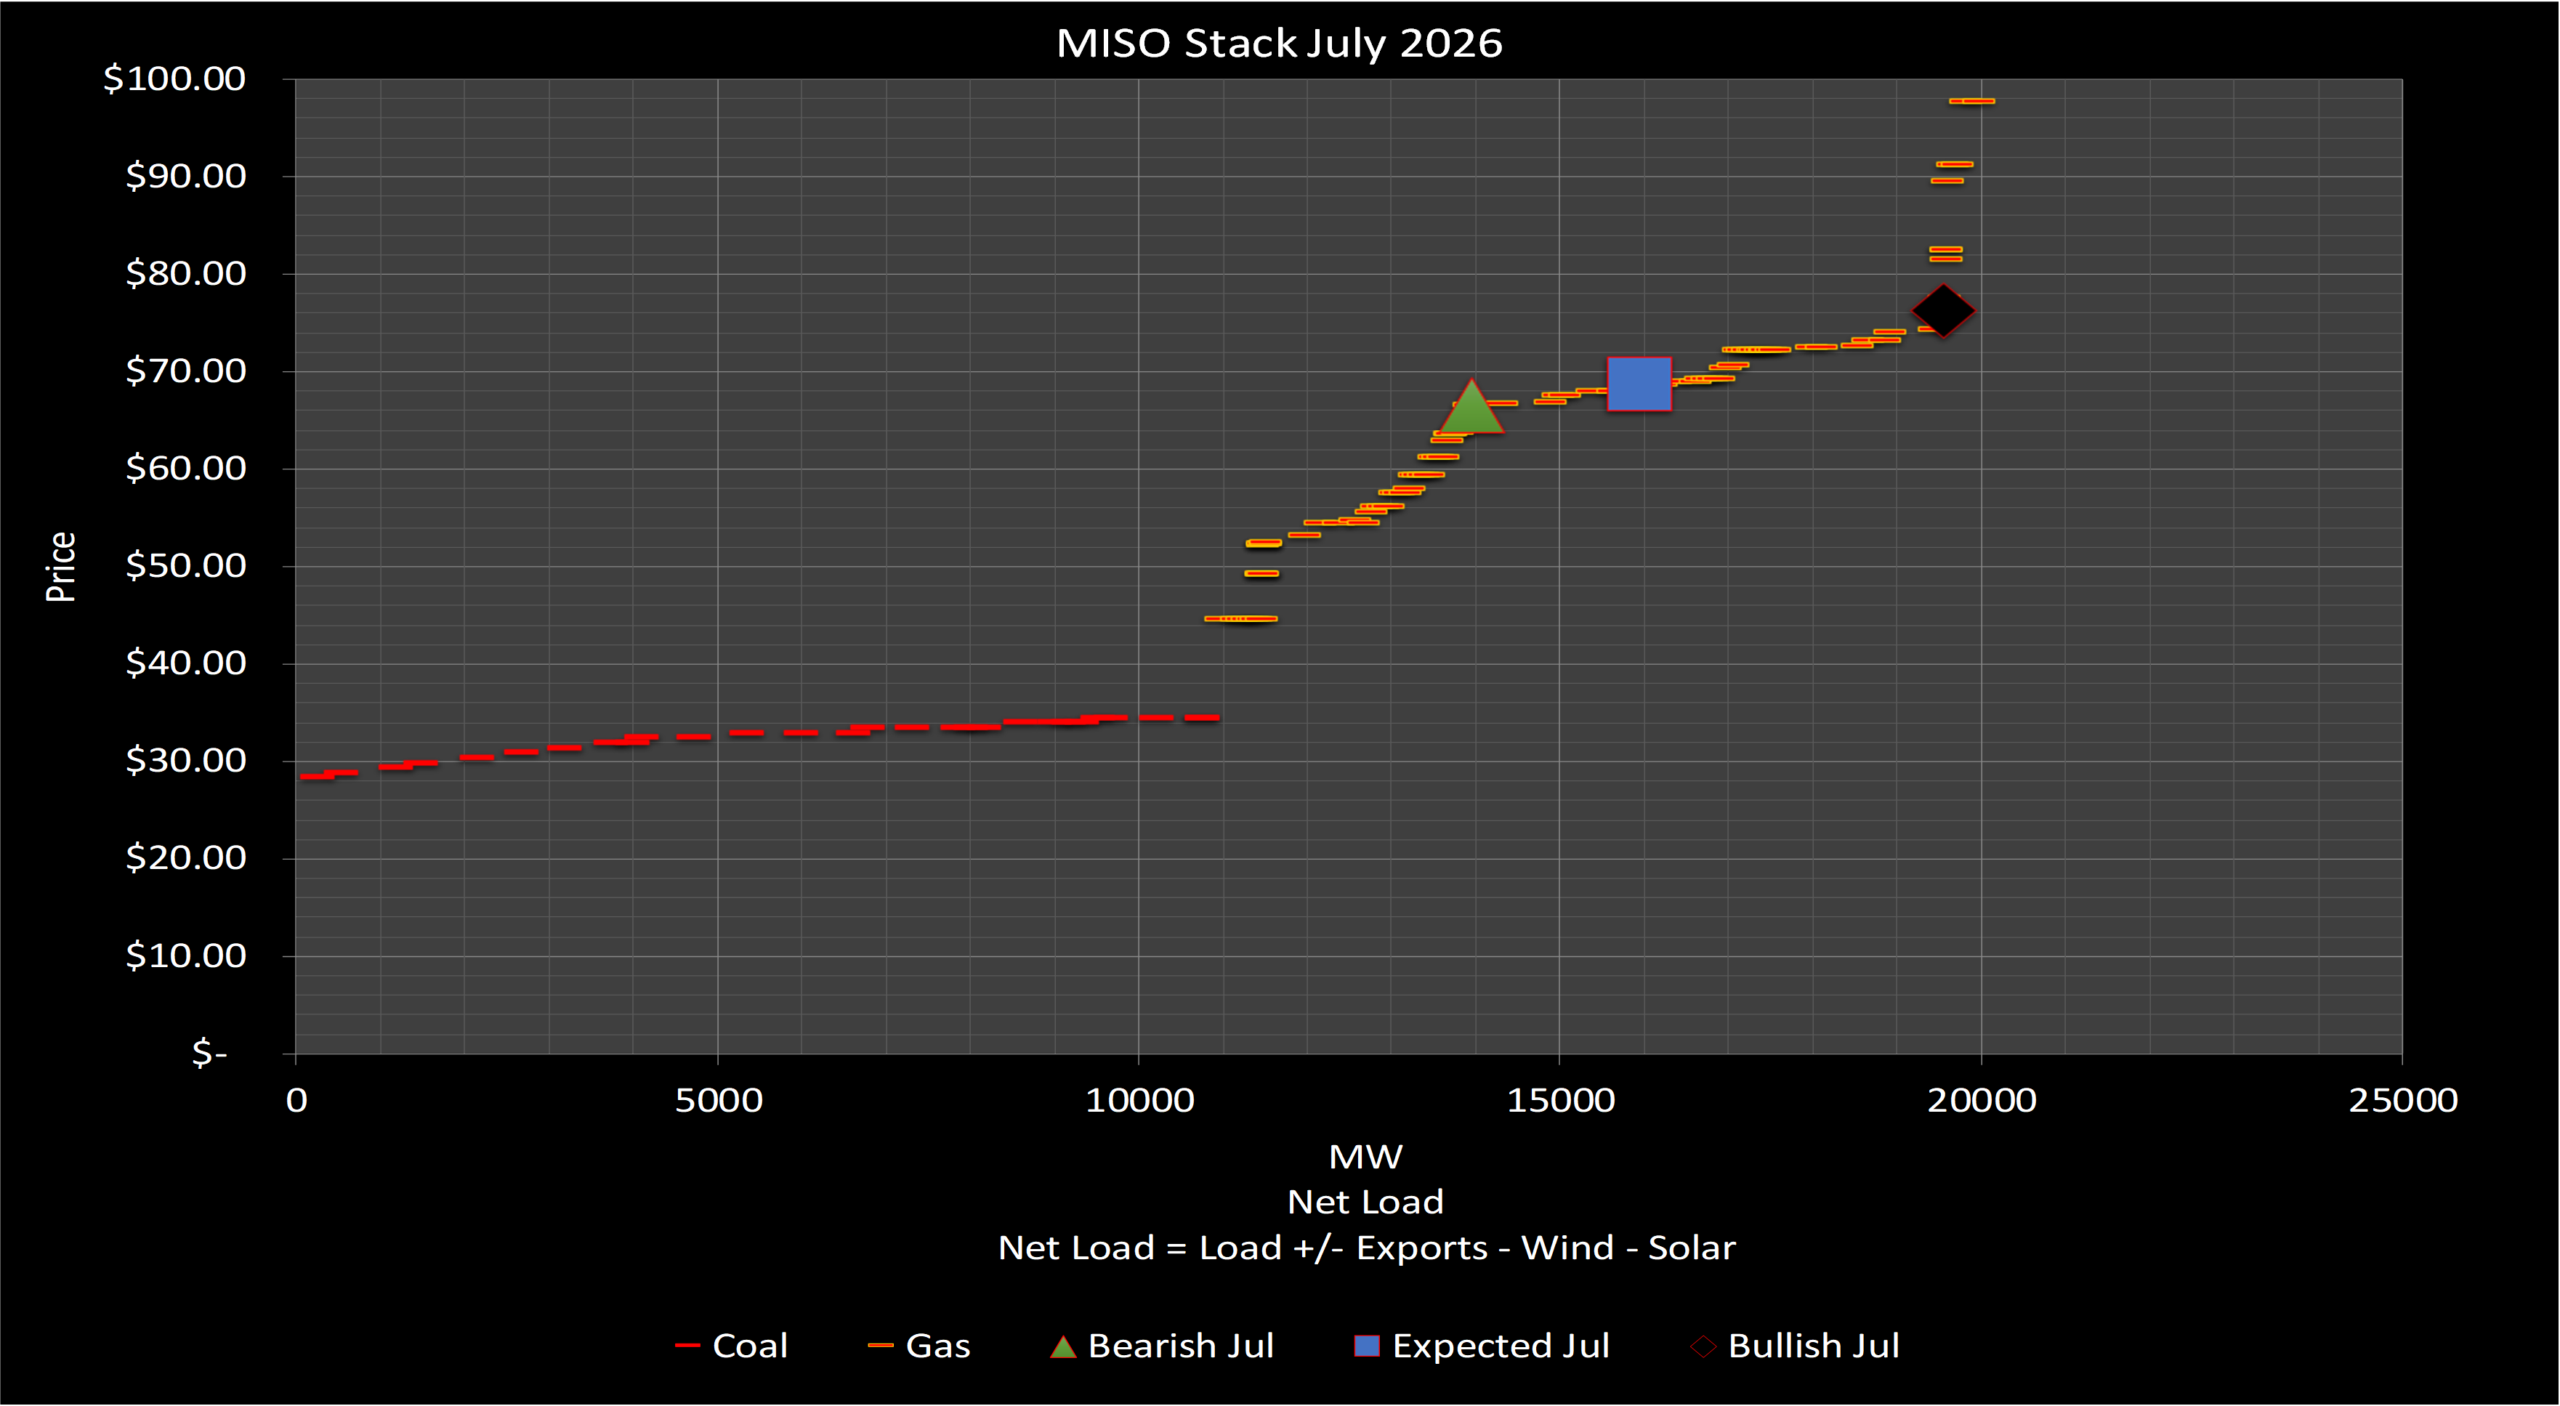
July: MISO breaks out. The Great Lakes cold surface anomaly is transient — as soils dry and lake temperatures normalize, the broader El Niño pattern takes hold. Both analog years skew above-average load in July, with the 2023 analog showing one to two Chicago days above 95°F alongside below-average wind. Typically PJM and MISO share July as their hottest month, and this setup points to a similar outcome. Front-loaded congestion risk early in the month amplifies the price sensitivity of any weather surprise.

August: Above-average temperatures expected to continue, consistent with both analog years. The 2023 analog shows roughly 15% of the month above 95°F in the broader region. The Great Lakes influence remains a mild moderating factor for the northern portions of the MISO footprint — peak loads may not reach the same sustained levels as July, though the overall heat picture remains bullish.
In contrast to PJM, MISO is actually adding gas generation this summer. Two projects stand out:
MISO year-to-date load growth shows on-peak under 1% and off-peak approaching 2%. The off-peak figure is interesting because it matches the early data center load signal seen in ERCOT and PJM — those loads tend to be 24/7 and show up in off-peak first. MISO South in particular has attracted significant hyperscaler attention, and the off-peak trend is worth watching as a leading indicator.
MISO’s Planning Resource Auction (PRA) results sent a different signal than PJM’s capacity market in the most recent auction. Prices declined 30–40%, though they remain at an elevated level near $400. This suggests that the supply-demand balance in MISO, while not comfortable, is not as critically tight as PJM. The Expedited Resource Addition Study (ERAS) process — MISO’s mechanism for accelerating new supply — has several notable projects in the pipeline, including approximately 1 GW of gas generation in Louisiana (Franklin Farms, Entergy) that will serve the hyperscaler demand surge in MISO South. A smaller project, Red Oak Hills in the upper Midwest, is closer on the timeline and worth monitoring.
Last summer’s Indy Hub settled at notably modest heat rates — 16.29 in June, 19.92 in July, and 15.56 in August — reflecting the cooler, wetter conditions that characterized MISO’s 2025 summer. The 2026 setup is considerably more bullish: above-average load expectations, front-loaded congestion risk from the PJM 765kV outage in July, and the Orange County unit still ramping mean the base case is materially higher across all three months, with July carrying the most significant upside volatility.
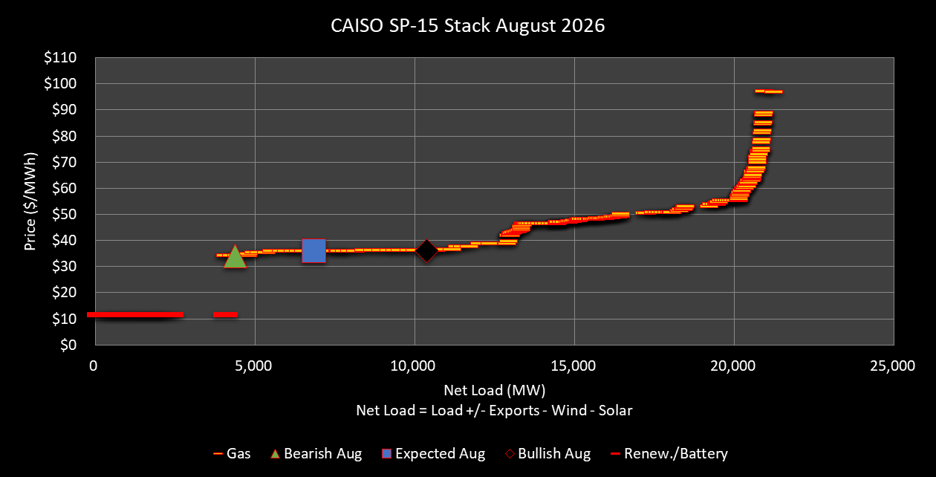
California’s summer setup is genuinely complex. The macroeconomic weather picture — El Niño, building ridges, the 2023 analog — points to heat. But a growing number of CAISO-specific factors have been pushing the Enverus team’s view more bearish on California power prices even as the temperature forecast remains warm.
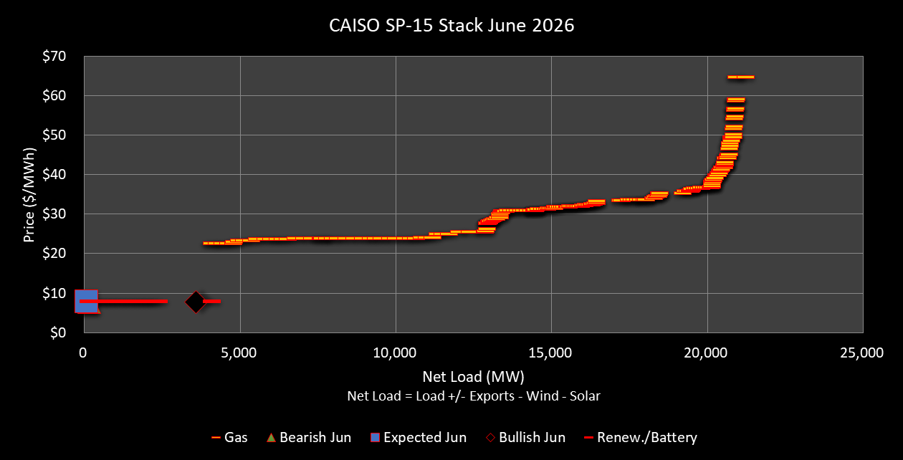
June: Temperatures are expected to come in slightly below the historic average for the SP-15 region — the analog years show a population-weighted average of 64.9°F against a historic norm of 65.6°F. Coastal areas benefit from strengthening temperature gradients between the coast and the interior, which should support near-to-above-average wind generation through much of the month. Below-average load is the base case. Precipitation risk skews to below average, though the month generally runs dry. The Sunzia and battery supply picture means prices are unlikely to reach the gas stack on average days.
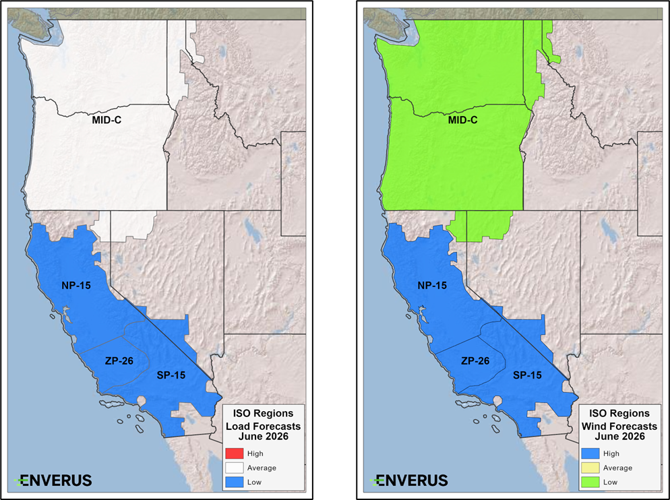
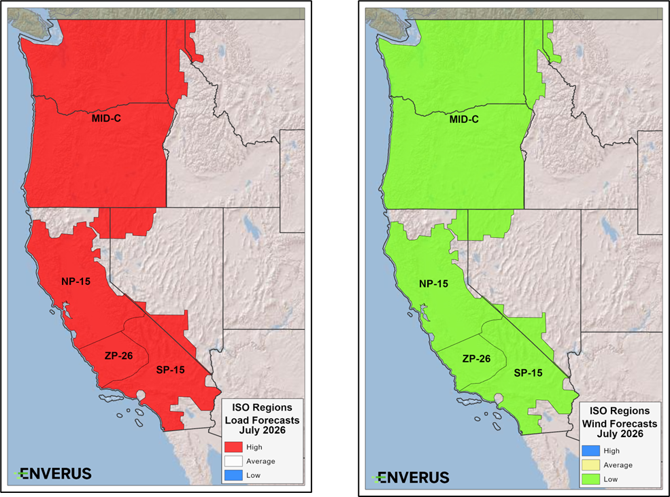
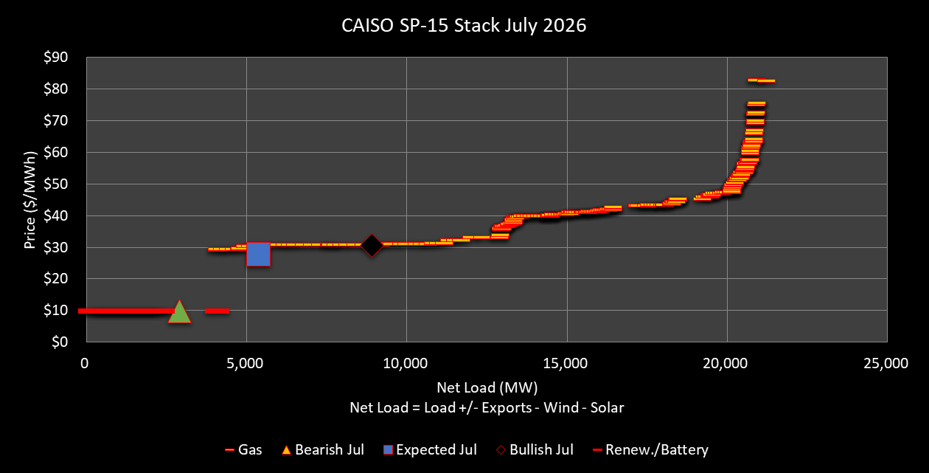
July: Temperatures move into above-average territory, with the analog years averaging 71.0°F against a historic SP-15 norm of 69.1°F — above average load is the result. Wind generation is expected to be below average as temperature gradients between coast and interior degrade and general heat dominates the atmospheric pattern. Precipitation looks below average. Pricing is expected to move onto the gas stack, with the bull case close to market if heat runs strong and coastal wind is low.
August: Temperature conditions continue to look above average, with the analog years averaging 72.8°F against a historic SP-15 norm of 70.7°F. Despite a hot interior, the coast stays relatively cooler, and wind generation is expected to stay around average as coastal pressure gradients remain partially intact. The key wildcard is precipitation: 2018 was extremely dry while 2023 brought significant monsoonal moisture to southern California. The team leans toward the 2023 outcome — if that develops, cloudy and humid days would suppress solar output while keeping load elevated, historically among CAISO’s most price-bullish conditions.

California’s hydro story for summer 2026 was set in winter. Despite near-average total precipitation, an exceptionally warm winter prevented snowpack from accumulating. The story of the winter was warm temperatures, not dry conditions — and the outcome is a severe snow drought that has left reservoir inflows well below seasonal norms.
State water authorities have been managing storage conservatively, prioritizing agricultural deliveries. Shasta outflows are expected to run at approximately 50–70% of historical average through the summer. The result: below-average hydro generation is baked in for the entire June-August period. This is a structurally bullish input — but it is competing against a lot of bearish pressure from other sources.
The CAISO interconnection queue has been effectively stalled for several years, with FERC’s new interconnection reform rules only beginning to move the needle. The queue continues to be dominated by batteries and solar — with wind nearly absent. The trend is increasingly batteries-only, as solar projects face additional permitting and siting challenges.
New solar additions in southeast California continue to pile into an already congested area, setting the stage for further curtailment records. Conversely, new battery additions around the Bay Area should provide some relief to the Moss Landing congestion zone that has been a recurring issue. The net effect on prices is more supply competing for a limited set of high-value peak hours — inherently bearish for average prices even if tail-risk days remain significant.
The most consequential new development in CAISO for summer 2026 is the Sunzia wind transmission project. Sunzia entered the CAISO real-time market on April 9, 2026, and was integrated into the day-ahead market in May 2026. As of May 2026, it was delivering approximately 1.0–1.3 GW, with capacity to grow through the summer.
The market impact has been immediate and visible. Sunzia delivers power into CAISO during the evening hours — specifically around hours 22–23 (10–11 PM local time), exactly when the sun has set and batteries have historically stepped in to serve residual load at elevated prices. Sunzia is now competing directly with those batteries in that window, suppressing the price formation that defined CAISO’s summer evening peaks for the past two years.
The Extended Day-Ahead Market (EDAM) went live on May 1, 2026, with Pacific Gas & Electric participating. Early observations from the Enverus desk have been surprising:
Markets Plus — the SPP-operated day-ahead market for the Interior West — remains on track for an October 2027 launch. Unlike EDAM, Markets Plus will include a virtual trading component, which is expected to be a meaningful differentiator for participants wanting active price discovery. Bonneville Power continues to plan for participation.
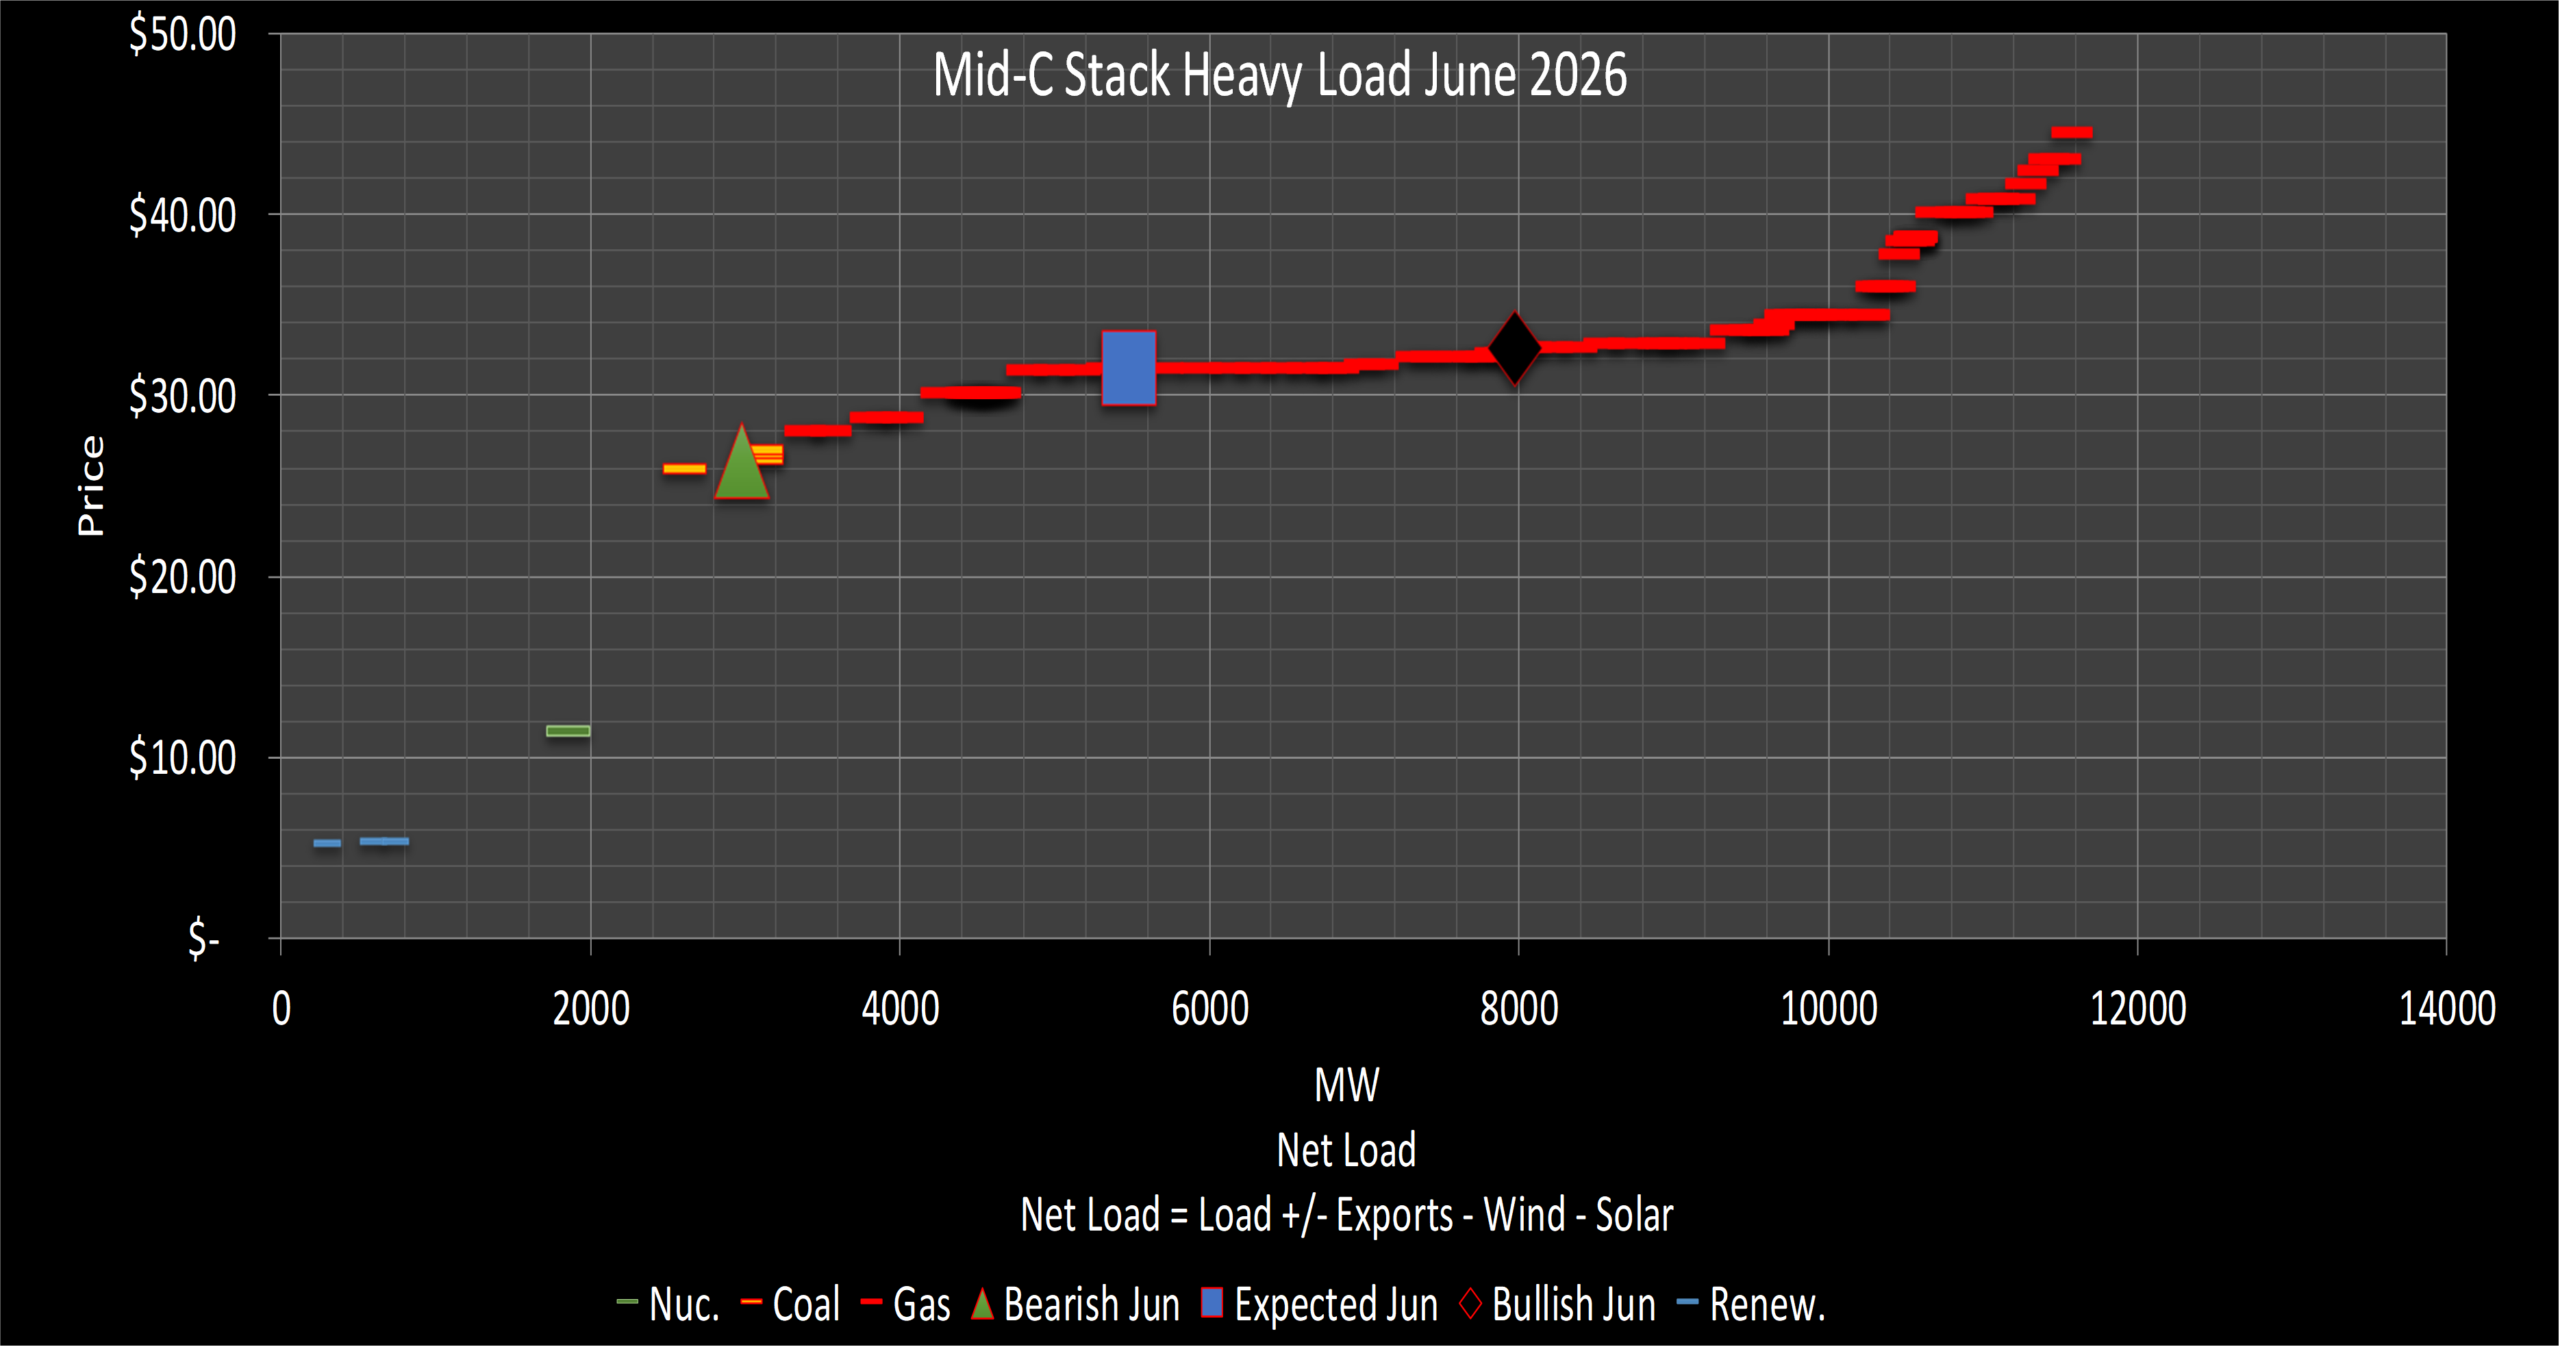
The Pacific Northwest and Interior West face a hot summer in 2026, consistent with the broader El Niño pattern, but the market story is shaped as much by hydro generation as by temperature. Both analog years point to warm temperatures across the region, with the heat concentrated in the Interior West rather than the coast. June is expected to start warm, with risk of late-month heat waves — the 2018 analog produced Portland highs of 98–101°F in late June. The key wildcard is the two-basin hydro situation: US Columbia Basin snowpack is severely depleted, while Canadian Basin snowpack is record-high, creating a pronounced seasonal hydro generation profile that dominates Mid-C price formation through the summer.
June: Warm weather expected, with risk of extreme heat spells later in the month. Wind generation should be near average. Hydro generation is low — US runoff has already peaked with little snowpack remaining, and Grand Coulee is still filling. This combination makes June the most bullish month for Mid-C: warm temperatures, limited hydro, and BPA actively managing reservoir fill create a tight supply picture.
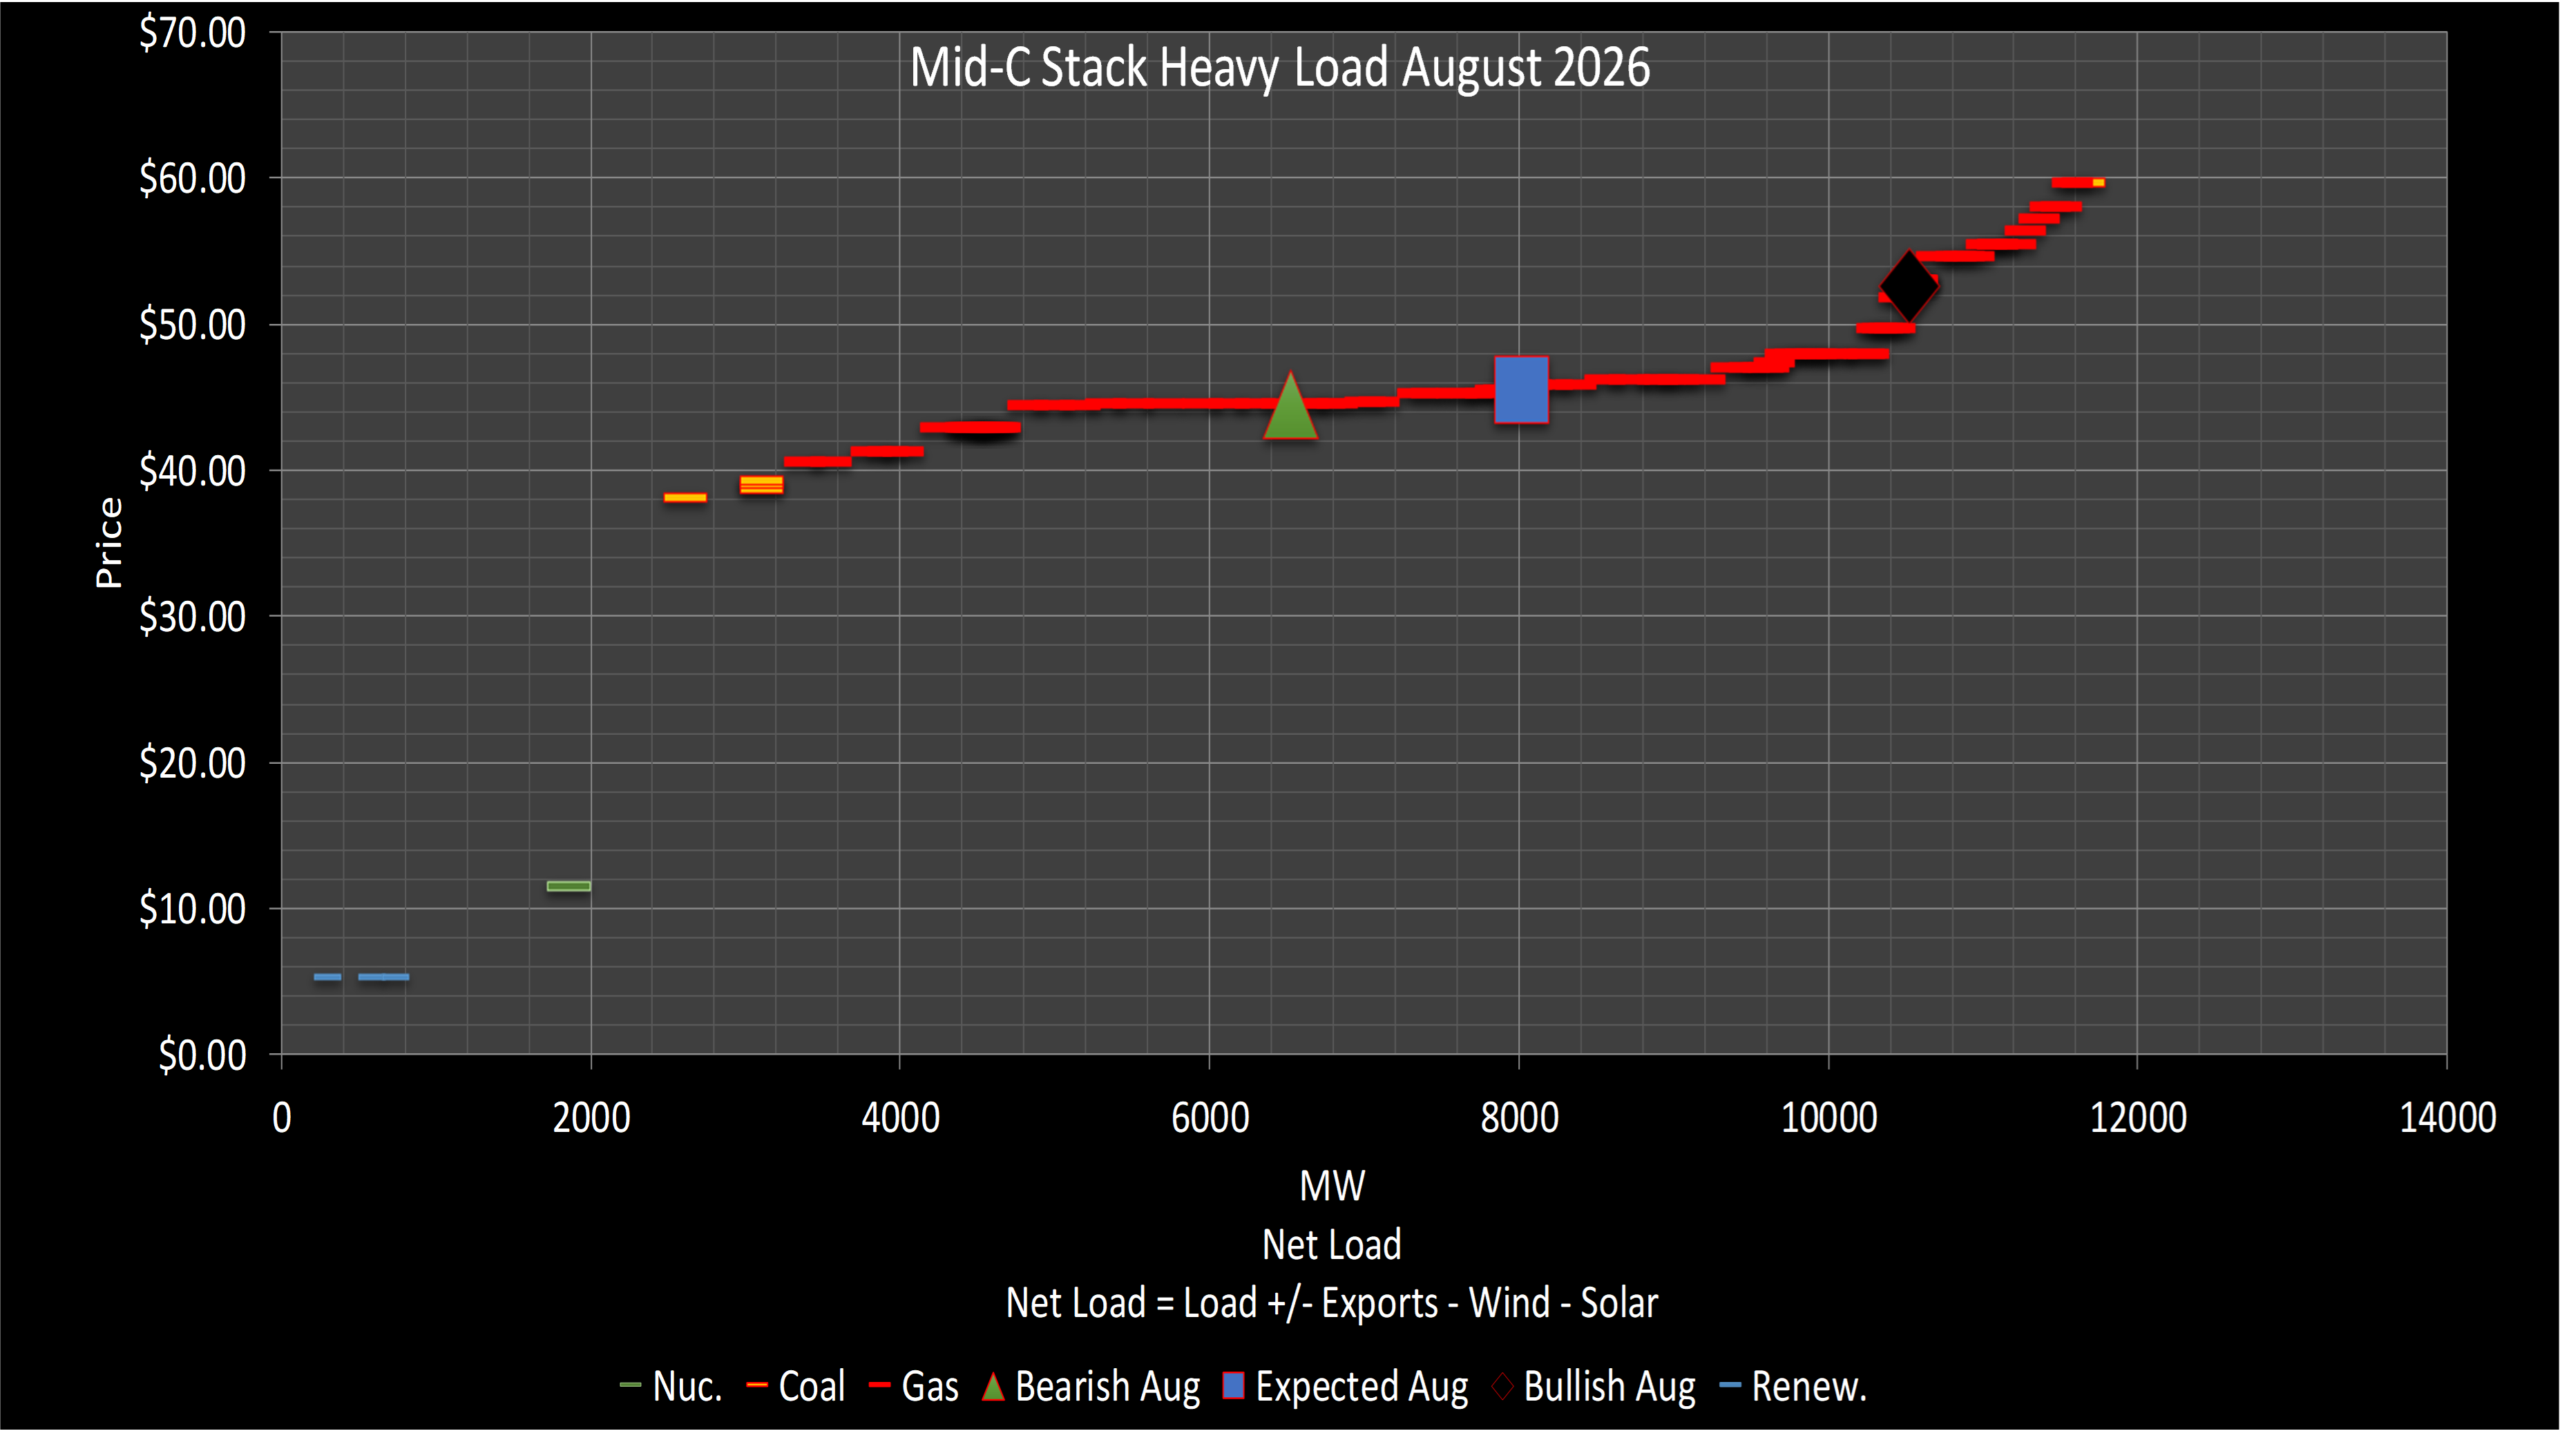
July: Hot weather continues across the region, with many days in the 90s expected. The average Portland temperature for July is 70°F — the analog years average 71°F. The dominant market dynamic shifts from weather to hydro: Canadian Basin water begins hitting US reservoirs and generators in volume, dramatically increasing generation. The hydro surge is the primary moderating factor on July prices despite continued heat.
August: Hot weather continues, with both analog years showing above-average temperatures through the month. The 2023 analog in particular showed extreme early August heat — 103°F on August 2nd and 105°F on August 3rd — followed by sustained mid-to-upper 90s through the month. As Canadian water flows taper off, the hydro buffer diminishes, increasing the risk that extended heat events push prices materially higher. August carries the most significant upside tail risk of the three months.
Mid-C’s summer 2026 hydro situation is best understood as two completely different watersheds with opposite conditions. The US Columbia Basin entered summer with a severe snow drought — a warm winter produced far less snowpack than normal, and what snow existed has already melted. Flows in US tributaries are well below the most recent USBR STP forecast. In practical terms, US runoff peaked early and is already declining.
Canada tells a completely different story. Record snowpack in many Canadian Basin locations, abundant storage, and a later melt season means that Canadian water will be hitting US reservoirs and generators through July and into August. Grand Coulee, which will be filling through early summer, acts as a storage and dispatch mechanism that translates that Canadian hydro into generation when the market needs it.
The net forecast: near-average summer hydro generation for the Mid-C region as a whole, with a pronounced July hump driven by Canadian inflows. Generation is expected to be trending lower at the margins and is subject to downside risk if Canadian melt is slower than expected.
The Northwest is seeing genuine load growth of approximately 2–3% year over year — more than most other regions. The data center story is increasingly centered on the Interior West, with the Utah 9 GW data center complex (10-year build timeline) as the marquee announcement. A large data center in Reno has drawn so much power that surrounding communities are being displaced into the wholesale market — a specific, localized example of the supply adequacy pressure building across the region.
EDAM’s May 1 launch gives the market its first real visibility into Interior West load and price formation. Previously, much of this demand was opaque to wholesale market participants. As more participants join EDAM through 2027, the picture will sharpen considerably.
The Washington state carbon market continues to be a significant factor in Mid-C price formation. Allowance prices, which fell during the pre-election period in 2024 as the state released additional allowances, have tightened again post-election. The ongoing effort to integrate Washington’s market with California and Quebec adds another layer of regulatory uncertainty. California’s legislature is actively discussing revisions to its carbon market structure. The combined effect is elevated and uncertain carbon costs for thermal generation in the Pacific Northwest.
New York’s summer 2026 setup leans warm across all three months, with the 2023 analog carrying the most weight as models continue trending toward a stronger El Niño. The 2023 comparison is particularly relevant for the region: that year produced sustained heat along the Atlantic Seaboard through July and August, and the analog signal for 2026 points to a similar pattern. Drought conditions present in parts of New England and growing soil moisture deficits across the Northeast are additional heat amplifiers, though a wetter precipitation trend — if it continues — could put a modest cap on the most extreme heat days.
June: The analog years point to average temperatures with near-average wind generation. There is upside risk from the 2018 analog, which brought a handful of days where daytime highs broke above 90°F across the region. Overall, June is a relatively moderate risk month — heat is possible but not expected to be sustained.
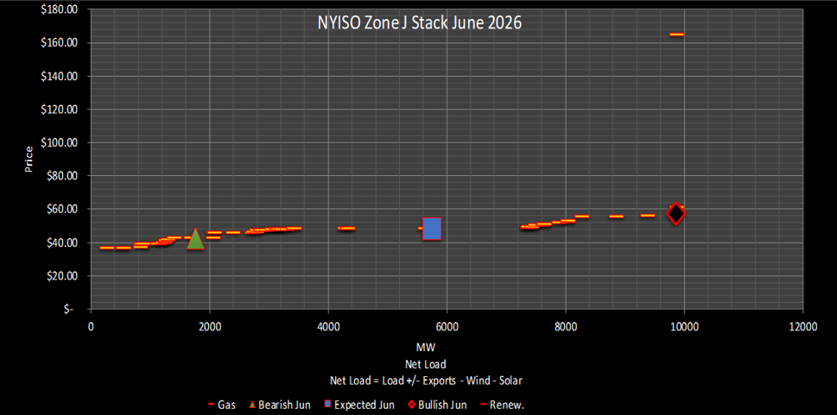
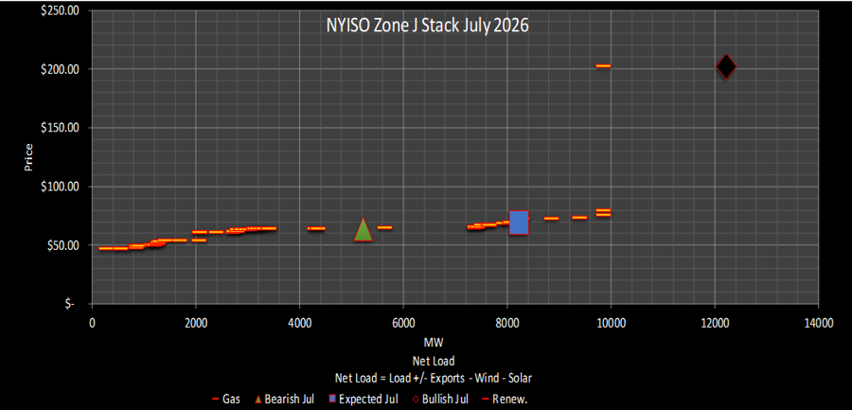
July: The peak risk month for NYISO. The 2023 analog points to sustained, broad-based heat rather than isolated spikes — prolonged above-average temperatures with warm overnight lows preventing demand recovery. Low wind generation is expected to accompany the dominant high-pressure pattern, reducing renewable offset. July is where the 2026 bullish case for New York is most likely to materialize.
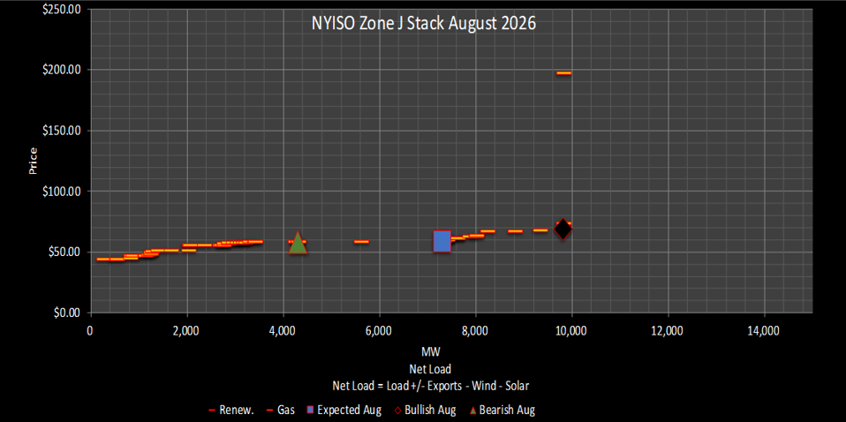
August: Above-average temperatures expected to continue, consistent with both analog years. The heat dome established in July tends to anchor firmly in early August before any meaningful breakdown risk. Soil moisture conditions — if they remain dry — support a high floor for daily demand through the month.
The single most important market structure change in NYISO for summer 2026 is the Champlain Hudson Power Express (CHPE). This 1.25 GW HVDC line connects Hydro-Québec directly to Astoria, Queens, bypassing the traditional upstate-to-downstate corridor entirely. Partial operations and testing began in the first week of May 2026, with full operations expected in June.
The market implications are significant and already beginning to show:
New York load growth for summer 2026 is expected to be minimal. The Northeast has not seen the data center build activity that has characterized ERCOT and PJM, and demand-side growth is not expected to be a material driver of summer price formation.
RGGI remains a structural upward force on heat rates in both New York and New England. Carbon compliance costs raise the marginal cost of thermal generation, and the trend has been consistently upward since 2021. NYISO heat rates have risen materially over this period, a pattern expected to continue.
CHPE’s effectiveness depends on Hydro-Québec’s ability to deliver sustained flows. HQ reservoir conditions entering summer 2026 are described as near-average — slightly below average in the most recent data, but sufficient to support the expected flow levels on both CHPE and the existing Phase 1 and Phase 2 bidirectional ties. Phase 1 and Phase 2 operate as market-economics-driven ties — they import when New York prices justify it and export when HQ needs the capacity. CHPE is a dedicated import line providing base-load support.
Last summer offered a sharp reminder of how non-linear New York price formation can be. NYC Hub heat rates reached 25.6 in June and 26.1 in August — but surged to 33.0 in July, when sustained heat and gas price volatility drove the market well above what the supply stack alone would imply. The 2026 forecast carries a similar asymmetric profile: a below-market base case driven by CHPE’s bearish influence on Zone J, with significant tail risk on the days when heat, low wind, and gas volatility align simultaneously.
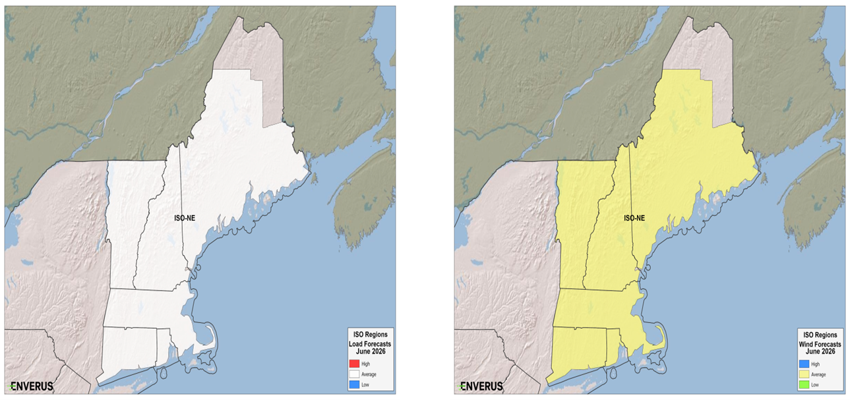
New England’s summer 2026 weather outlook closely mirrors New York’s, given the region’s geographic proximity and shared atmospheric drivers. The 2023 analog year is the primary reference, pointing to a warm-to-hot summer with below-average wind generation across all three months. Drought conditions present in parts of New England, combined with soil moisture deficits that have been building since spring, are heat amplifiers that support a bullish temperature outlook. The one moderating factor to watch is the regional precipitation trend — if the wetter precipitation pattern that developed through spring persists, it could limit the intensity of peak heat events, particularly in June.
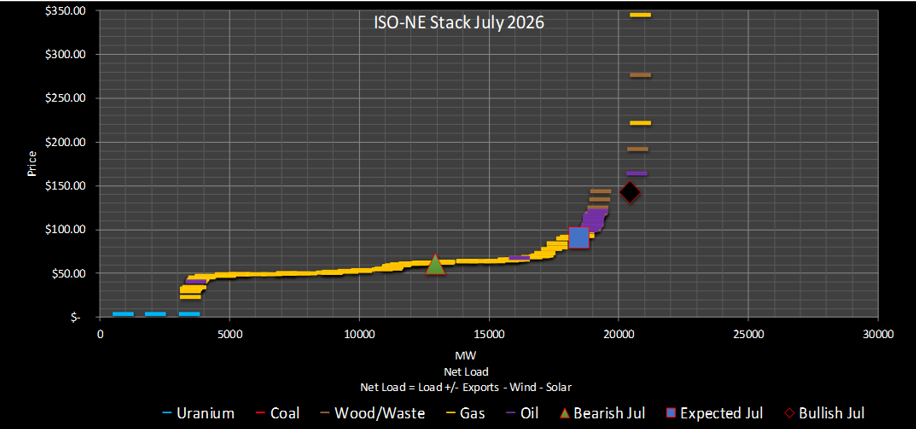
June: Average temperatures expected, with near-average wind generation. The analog years suggest June will be the most moderate of the three summer months — heat is possible but not expected to be sustained across the full month. The primary upside risk is an early-season heat wave extending into the region from the Mid-Atlantic.
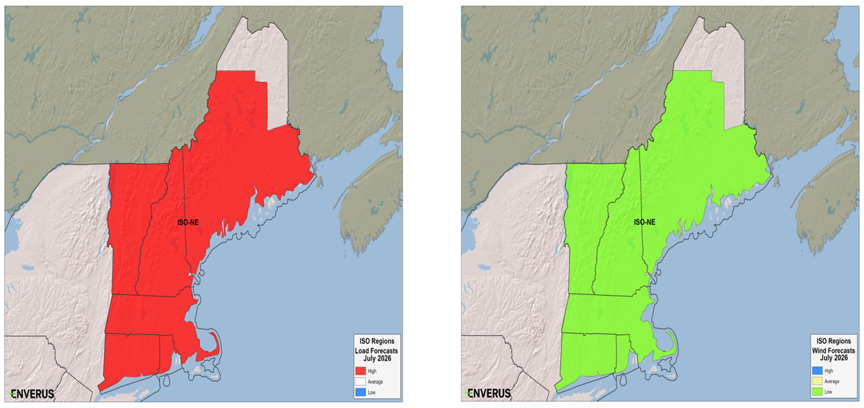
July: The peak risk month for ISO-NE, consistent with the NYISO outlook. The 2023 analog points to sustained above-average temperatures rather than isolated spikes — the kind of prolonged heat that keeps overnight lows elevated and prevents demand recovery. Low wind generation expected throughout the month under the dominant high-pressure pattern.
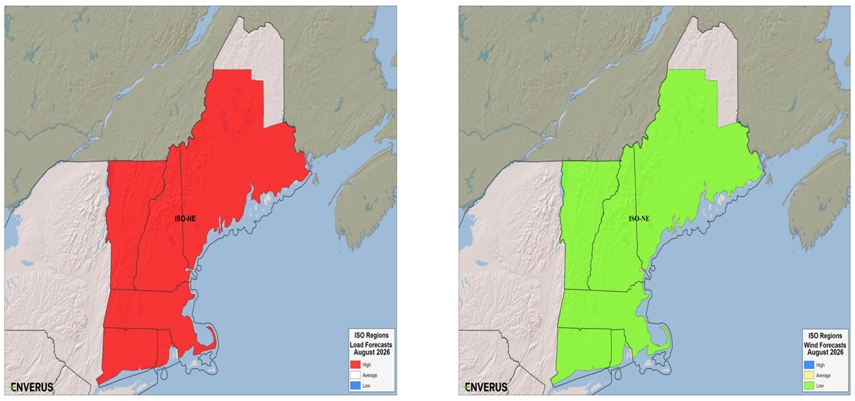
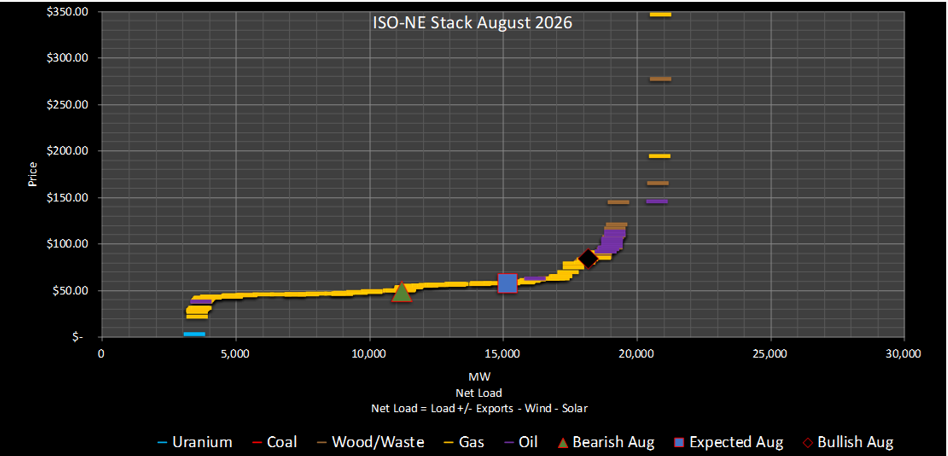
August: Above-average temperatures expected to continue through August. Both analog years show heat extending well into the month, with the 2023 analog in particular showing above-average highs through the third week of August. The combination of sustained heat and the evening demand pattern driven by solar ramp-down makes August a high tail-risk month despite the slightly lower base case relative to July.
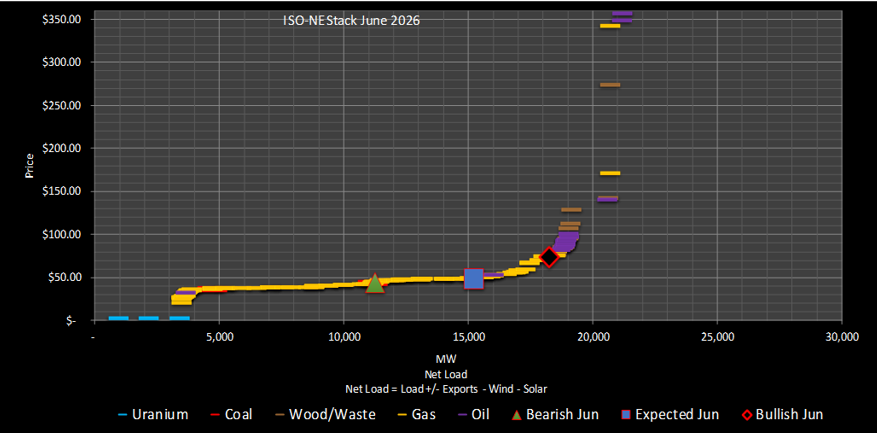
ISO-NE’s summer 2026 market structure has been fundamentally changed by the New England Clean Energy Connect (NECEC), a 1.2 GW HVDC line from Hydro-Québec that became the dominant import path into New England when it began operations in January 2026. The line provides substantial base-load support to the ISO and is already suppressing spring pricing in mild-day conditions.
Importantly, NECEC did not simply lower New England electricity prices across the board. It changed where and when congestion occurs. The largest single congestion spike observed since the line went into service came immediately after its January start, when weather-driven north-to-south flows pushed the Maine-to-New Hampshire interface hard. That said, Enverus projects the NE:NH congestion trend to decrease through the summer — driven by lower expected wind generation in Maine and strong demand in southern New England states — leaving the primary risk as evening price spikes rather than persistent interface congestion.
NECEC has produced a distinct new hourly pattern in ISO-NE markets:
This dynamic — midday congestion, evening scarcity risk — is the defining feature of ISO-NE summer 2026 market structure.
Vineyard Wind (806 MW total capacity across 62 turbines) is partially operational, with 44 turbines producing approximately 572 MW as of May 2026. Full commercial operation has been delayed for legal reasons; a resolution could allow formal COD in late spring or early summer 2026. When delivering power, Vineyard Wind has a bearish effect on daytime energy pricing in southern New England, particularly when aligned with strong NECEC imports. The Pure Solar project (approximately 70 MW) in Connecticut will add to midday price suppression and increase the evening ramp.
Like NYISO, ISO-NE is not seeing meaningful load growth from data centers or other new demand. Summer 2026 will not be a demand-growth story in New England — it will be a transmission flow, solar shape, and import curtailment story.
New England’s 2025 summer heat rates were notably flat across the season — 18.4 in June, 20.6 in July, and 21.3 in August — reflecting a relatively uneventful summer from a price formation standpoint. The 2026 outlook is structurally different: not because demand has grown, but because NECEC has changed the congestion map and introduced an evening scarcity risk that did not exist in prior summers. The base case is below market across all three months, but the tail risk scenarios — particularly in July — are materially more severe than recent history would suggest.
Every regional market has its own dynamics — specific congestion nodes, specific transmission projects, specific analog year weightings. But stepping back across all eight ISOs, five structural themes emerge that are shaping every market simultaneously. These are the themes that matter most for participants with multi-region books, strategy teams thinking about the second half of 2026, and organizations making resource planning decisions.
Announced capacity — data center approvals, hyperscaler commitments, electrification targets — and actual grid utilization are running in completely different directions. In ERCOT, the batch study queue contains approximately 9 GW of approved large load, yet measured utilization at those connections is nearly flat month over month. In PJM, year-to-date on-peak load growth is under 1%. In MISO, the off-peak signal is emerging but has not yet translated to peak demand.
The primary explanation appears to be a combination of two factors: construction and interconnection lag (approved projects simply haven’t been built yet) and a structural shift toward behind-the-meter generation (large customers building their own gas plants, solar, or wind rather than drawing from the grid). The latter trend has potential to become a permanent feature of demand dynamics, not a temporary gap.
The investment implication: the forward curve may be pricing load growth that doesn’t arrive on schedule. The risk management implication: when load does arrive — in a sudden surge after a long lag — markets may be structurally under-prepared.
The traditional power market assumption — that the highest-risk, highest-price period is midday peak demand — is now outdated in most US markets. The evening solar ramp-down has replaced midday as the primary risk window in ERCOT, CAISO, PJM, and ISO-NE simultaneously.
The mechanism is consistent: solar generation ramps hard through the late afternoon, suppressing prices, and then collapses at sunset. Net load surges at the same moment that the cheapest daytime resources are going offline. In CAISO, Sunzia has now entered this exact window, displacing batteries that previously commanded premium prices in hours 22–23. In ISO-NE, NECEC curtailment during the evening ramp is the primary scarcity risk. In ERCOT, Sanderson Switch congestion and North Houston basis are both driven by the post-solar, post-sunset demand surge. In PJM, the Dominion zone’s growing utility-scale solar is producing increasingly sharp evening ramps.
The practical consequence: participants who are managing around a midday peak are increasingly managing the wrong risk. The valuable hours are moving to the 5–9 PM window across virtually every market.
Three major transmission projects came online in time for summer 2026 — CHPE in New York, NECEC in New England, and Delaware 345kV in ERCOT Far West. All three were framed publicly as supply additions that would reduce prices. In all three cases, the market reality is more complicated.
CHPE is bearish for Zone J but has changed the A-to-J vs. K-to-J spread relationship in ways that create new basis opportunities and risks. It does not simply lower all New York prices uniformly. NECEC did not reduce congestion in New England — it changed its location and timing, shifting it toward the Maine-New Hampshire interface at midday rather than the evening peaks seen previously. The Delaware 345kV line in ERCOT Far West is expected to be fully absorbed by oil and gas load growth almost immediately after energization, providing little net relief.
The lesson for market participants: new transmission creates new price relationships as much as it resolves existing ones. The traders who understand where congestion moved, not just that it moved, are the ones who capture the basis.
PJM’s RTEP 2034 study delivered a physical shortfall signal. The capacity collar is preventing the market signal from transmitting to developers. Units facing retirement are being held online by DOE orders. And PJM has signaled it wants to redesign the capacity market entirely rather than continue patching it. This is a market in structural transition, and summer 2026 will be a real-world stress test of the gap between what the planning studies say is needed and what is actually available.
MISO is on a different trajectory — its most recent PRA showed prices declining rather than rising. But the MISO South hyperscaler buildout, if it materializes at the scale announced, will change that picture. The off-peak load growth signal already appearing in MISO data is the leading indicator to watch.
CAISO’s resource adequacy framework, and the ongoing debate about its carbon market, add further uncertainty for the Western market. The broader point is that capacity adequacy — long considered a solved problem in most US markets — is a live issue in 2026 in ways it has not been in a decade.
Across multiple markets and multiple analysts, one variable stands out across every market covered in this outlook as the dominant price formation factor above weather, supply stack position, and congestion: natural gas price volatility.
In NYISO, gas volatility was explicitly described as controlling power prices more than the supply stack. In PJM, RGGI-driven gas cost increases in the Dominion zone create a direct price transmission path. In CAISO, gas price spikes on extreme heat days are the mechanism for the bullish scenarios. In ISO-NE, gas is the marginal fuel during evening demand peaks and the variable that determines whether scarcity events reach triple-digit prices or stay manageable.
The structural backdrop: LNG export capacity from the US Gulf Coast continues to grow. The Costa Azul LNG facility in Baja California, Mexico, is targeting a Phase 1 startup in June 2026 (nameplate capacity 0.43 Bcf/d) and is expected to draw on Texas gas supply, creating additional export demand pressure on ERCOT-area gas prices. At the same time, domestic gas storage levels and production trajectory remain uncertain heading into the second half of 2026. In past summers, power markets priced weather risk as the dominant variable. In 2026, the risk distribution may be shifting toward gas basis and export dynamics.
The analysis in this report is drawn from Enverus Power Market Publications — a suite of daily, weekly, and quarterly research products covering all major North American wholesale electricity markets. Enverus Power Analytics combines proprietary stack modeling, ENSO-based weather forecasting, and deep market expertise to deliver forward price and heat rate forecasts, congestion analysis, and capacity updates to trading desks, utilities, developers, and investment firms across the country.
DISCLAIMER
This report contains forward-looking statements and market forecasts based on Enverus Power Analytics’ proprietary models and historical analog methodology. Forecasts are subject to change without notice. Specific heat rate and price figures should be verified against original source materials before use in trading or investment decisions. This report is for informational purposes only and does not constitute financial, trading, or investment advice. Enverus makes no representation or warranty as to the accuracy or completeness of the information contained herein.
© 2026 Enverus. All rights reserved.
Let’s get started!
Let’s get started!
We’ll follow up right away to show you a quick product tour.
Ready to Subscribe?
Ready to Get Started?