For years, natural gas pipelines were a straightforward asset class — stable throughput, predictable demand, reliable returns. That’s changing fast. The AI boom is driving a surge in power demand that’s reshaping how gas moves through the U.S. interstate pipeline network, creating new risks and opportunities that most investors aren’t yet equipped to see.
AI Data Centers Are Driving Natural Gas Demand Faster Than Models Expected
Hyperscale data center campuses are now routinely planned at 500 MW to over 1 GW of power demand, but grid interconnection timelines for projects of that scale run five to seven years. AI companies can’t wait that long. Natural gas is filling the gap — not as a transitional fuel in the policy sense, but as the only commercially practical option for delivering large-scale, always-on power to facilities that can’t tolerate downtime
~2% increase in total U.S. gas consumption from a category that barely existed 2 years ago
2.1 Bcf/d of incremental demand from behind-the-meter projects through 2030. Source: Enverus Intelligence® Research (EIR)
The result is a surge in gas-fired generation, much of it planned behind the meter. According to Cleanview, at least 46 data centers representing roughly 56 GW of combined capacity now plan to generate their own power on-site; 90% of those projects announced in 2025 alone, with approximately three-quarters of identified generation equipment running on natural gas. EIR projects about 2.1 billion cubic feet per day (Bcf/d) of incremental gas demand from behind-the-meter projects through 2030 — roughly a 2% increase in total U.S. gas consumption, driven by a single demand category that barely existed 2 years ago. Morningstar DBRS estimates nearly 18 Bcf/d of new pipeline capacity will come online in 2026, the largest annual addition since 2008.
What Happens When Data Center Energy Demand Disappears from Market Data?
What makes this trend particularly consequential for investors is that behind-the-meter consumption removes demand from the places where the market traditionally observes it. Gas consumed by a grid-connected power plant shows up in dispatch data, ISO reports, and spot market activity. Gas consumed by an on-site facility pulling directly from a transmission lateral often doesn’t. It bypasses the grid, the organized market, and much of the reporting infrastructure that analysts rely on.
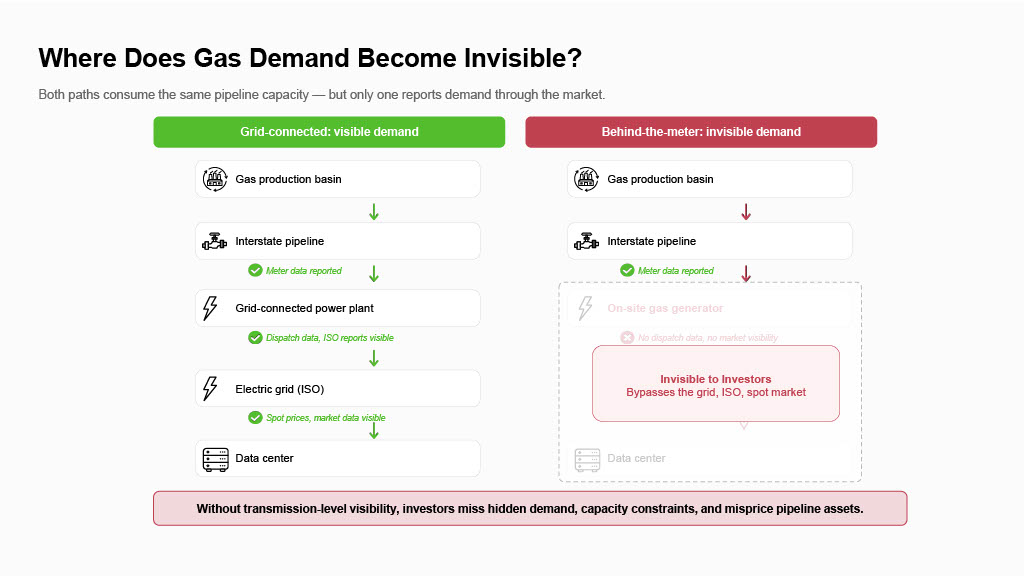
This creates three risks that don’t fit neatly into existing investment frameworks.
First, price spikes you didn’t see coming. When large-scale gas demand concentrates along corridors designed for a different demand profile, basis differentials can widen unexpectedly. Without corridor-level flow visibility, portfolio managers get surprised by regional price spikes that were building for months.
Second, capacity constraints hiding in plain sight. Approximately 30,000 transmission meters span the U.S. interstate network, but utilization data is scattered across individual operator postings in inconsistent formats, making system wide analysis prohibitively manual.
Third, demand that doesn’t show up in your models. Behind-the-meter consumption bypasses the grid, the organized market, and the reporting infrastructure analysts rely on. Without transmission-to-demand connectivity, investors are modeling pipeline revenue against incomplete demand pictures and mispricing assets accordingly.
These risks arrive in a market where capital is actively flowing. PwC reported that global energy M&A values rose 27% in 2025, and Deloitte tracked $57 billion in midstream deals alone.
Case Study: When Hidden Gas Demand Changes a Midstream Valuation
The scenario: A PE firm bids on a pipeline asset at 8–10x EBITDA based on steady utilization and comfortable remaining capacity.
Without better data: The deal team underprices near-term upside and misses medium-term capacity risk — potentially misjudging the asset’s value by hundreds of millions.
The blind spot: Three behind-the-meter data center projects are in development along the same corridor, invisible to grid data and interconnection queues, consuming enough gas to materially change the system’s capacity picture.
With daily flow visibility: The team sees the demand coming, adjusts their throughput model, and prices the deal accordingly.
Consider a private equity firm evaluating a midstream acquisition — a pipeline system serving a corridor between a production basin and a growing demand center. The operator’s projections show steady throughput growth, and historical utilization rates suggest comfortable headroom. Stable pipeline assets in this market are commanding 8–10x EBITDA multiples and at that price, getting the utilization picture wrong is a costly mistake.
What the deal team may not see: three behind-the-meter gas generation projects totaling 1.5 GW of planned capacity are in development along the same corridor. None appear in grid interconnection queues because they’re designed to bypass the grid entirely. A single 1 GW data center consumes approximately 140 MMcf/d of natural gas according to EIR — so the combined demand from these projects would consume a meaningful share of the system’s remaining capacity.
Without daily, meter-level flow data connecting transmission volumes to downstream demand, the deal team’s throughput model understates both the near-term upside (higher utilization) and the medium-term risk (capacity constraints that could trigger shipper competition or force capital-intensive expansion sooner than projected). The investment thesis doesn’t change direction, but the risk profile changes materially.
From Operational Data to Financial Signal
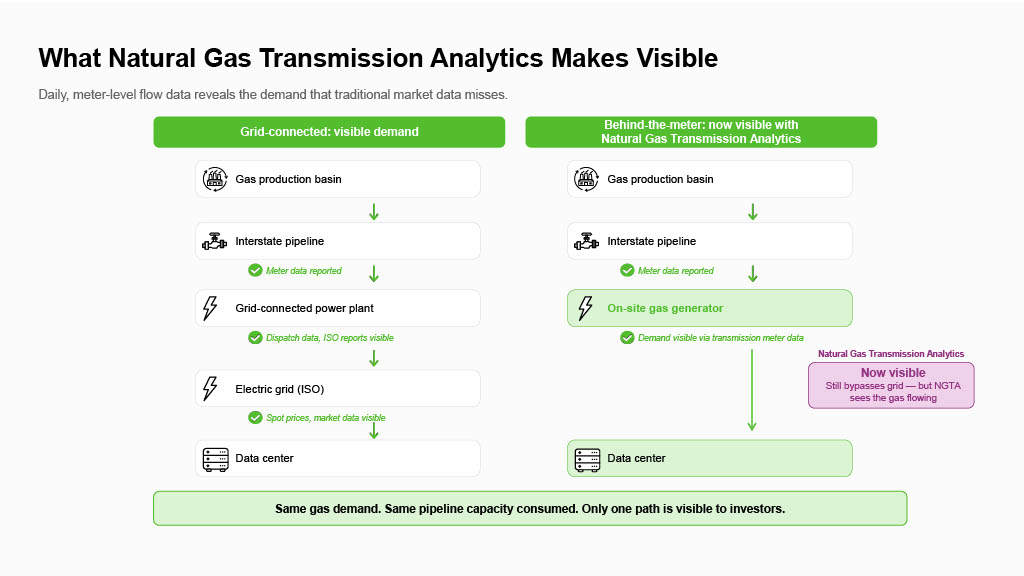
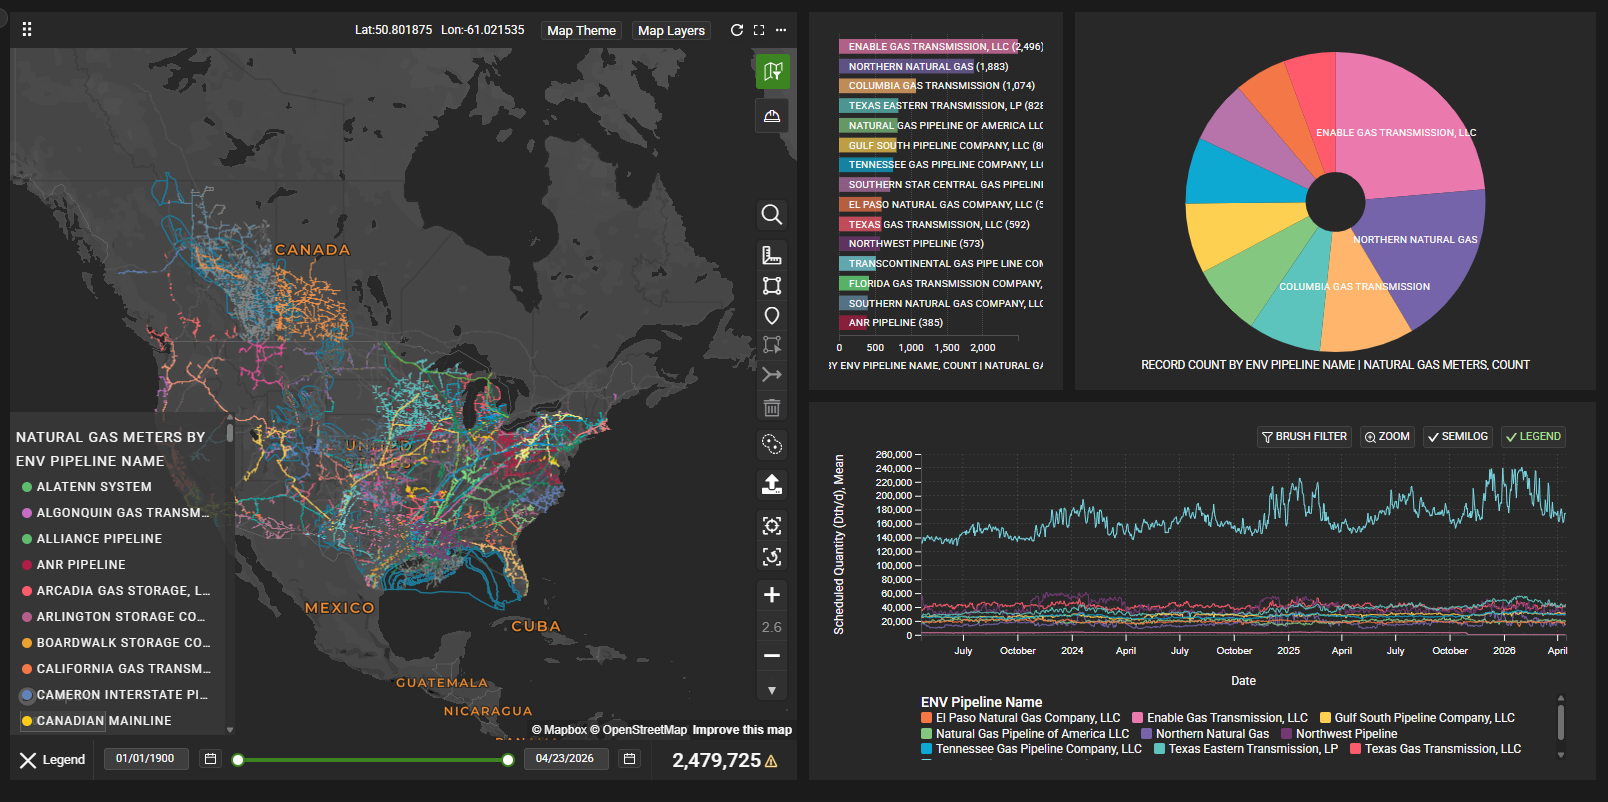
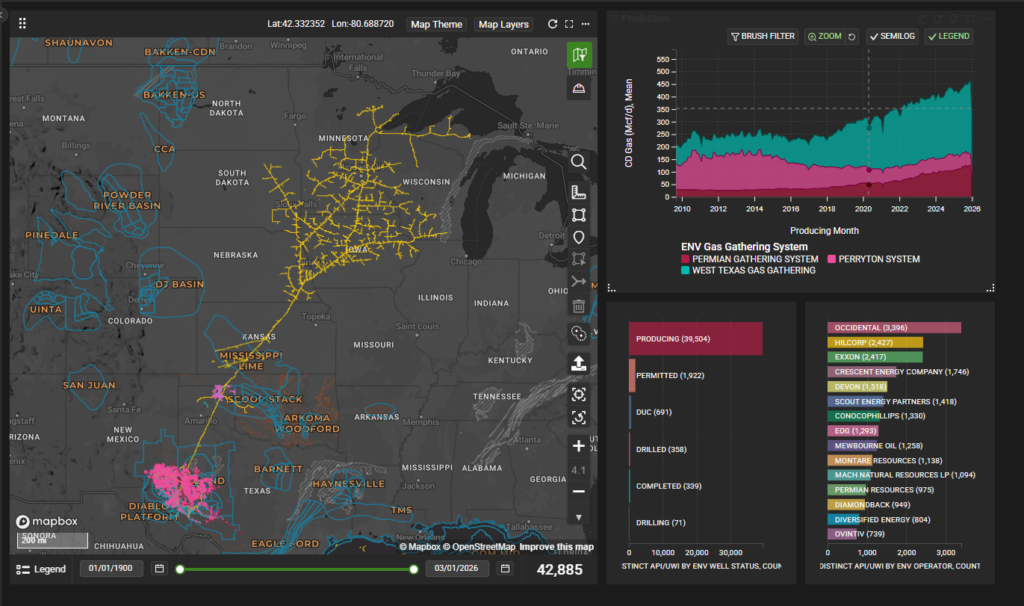
Gas transmission data, historically an operational input for pipeline schedulers, is becoming a financial data layer. Enverus Natural Gas Transmission Analytics, delivered within Enverus PRISM®, normalizes data from approximately 30,000 transmission meters across every major U.S. interstate system into a single, daily-updated dataset. Users can track gas movement from basin to market hub, monitor where capacity is tightening, observe shifts in route share and basin exit dynamics, and connect transmission flows to real end-use demand — including power generation, LNG export, industrial consumption, and behind-the-meter load.
For infrastructure investors, that means stress-testing acquisitions against actual throughput trends. For commodity funds, it means seeing corridor-level utilization shifts that foreshadow basis moves. For utilities and IPPs, it means tracing fuel supply reliability from basin to delivery point and seeing whether competing demand is emerging along the same corridor.
The natural gas transmission network was built for a world where demand growth was gradual and predictable. That world is over. The firms that integrate pipeline-level data into their investment process will see constraints, demand shifts, and basis risk earlier than those still relying on quarterly summaries and forward curve extrapolation. The pipes haven’t changed — but what’s flowing through them has.

About Enverus Intelligence® | Research, Inc. (EIR)
Enverus Intelligence® | Research, Inc. (EIR) is a subsidiary of Enverus that publishes energy-sector research focused on the oil, natural gas, power and renewable industries. EIR publishes reports including asset and company valuations, resource assessments, technical evaluations, and macro-economic forecasts and helps make intelligent connections for energy industry participants, service companies, and capital providers worldwide. See additional disclosures here.