Monthly FTR auctions move fast, and missing even one of the fundamentals can throw off an entire month’s positioning. This playbook breaks down the seven factors that consistently move congestion and pricing, from weather and load growth to constraints, outages, and regulatory shifts, so nothing gets missed before the next auction window.
Investors and traders looking to participate in ISO-administered FTR auctions have to navigate a complex landscape of shifting policy and grid topology. That’s especially true for the monthly auctions, which happen far more often than their annual counterpart and demand a faster, more repeatable prep cycle.
Renewable energy and related infrastructure keep adding complexity to power markets, though the runway looks different than it did a few years ago. Under 2025’s One Big Beautiful Bill Act, wind and solar projects generally must begin construction by July 2026 or be placed in service by the end of 2027 to retain federal investment and production tax credit eligibility. That’s a sharp pull forward from the original phase-down schedule under the Inflation Reduction Act. Energy-community and Environmental Justice Area credit adders remain in place for qualifying projects, but the accelerated timeline is already changing the pace of new generation reaching the queue.
Whether trading, hedging, or a blend of both, market participants shape their view of how systems and topology are changing with a complex array of data and analytical tools. To confidently bid and succeed in FTR auctions requires a rigorous methodology to track market events like outages to accurately inform FTR positions, trades and risk strategies.
In this e-book, we’ll walk through the factors FTR traders need to review as they prepare for each month’s FTR auction cycle, and the same factors apply at a longer time horizon to annual auctions.
Weather
Load growth
Recently bound constraints
Generation and transmission outages
New, retiring generation, load and transmission
Project delays
Regulatory considerations
Throughout this e-book, we’ll also show how AI-powered tools can shorten your monthly prep cycle. Power Analyst delivers instant, structured answers to your power market questions using data you already subscribe to, while Power Flow Studio lets you build forward-looking grid scenarios that test how changing conditions could move congestion and pricing well ahead of your next auction window.
Weather
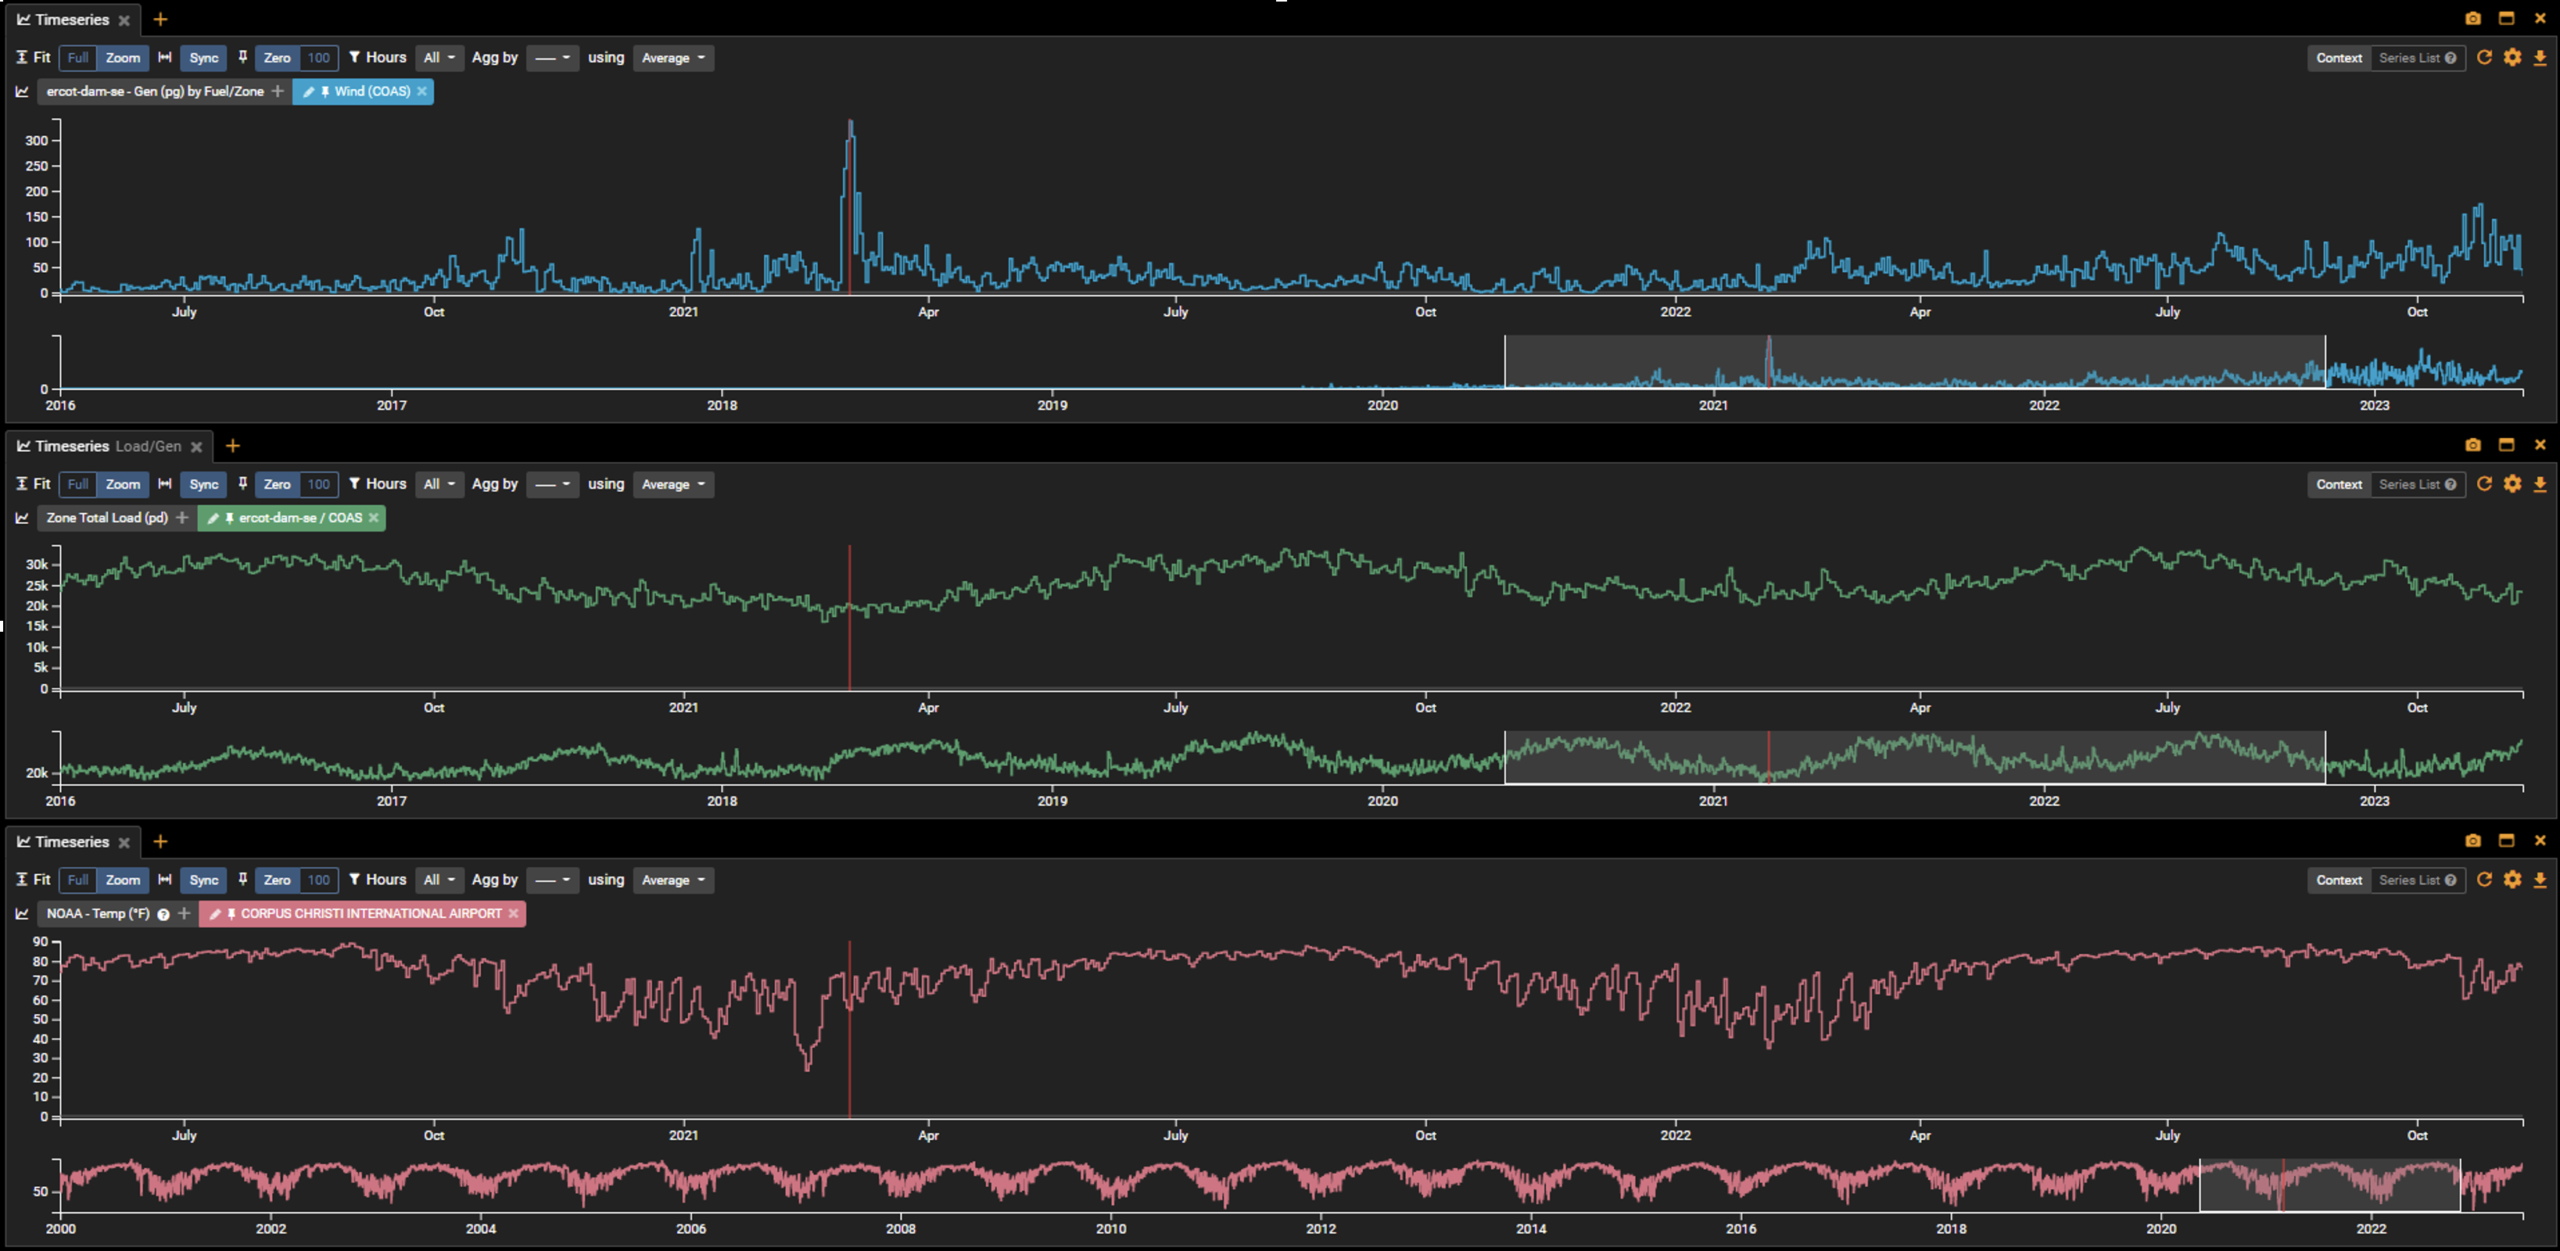
Weather has become one of the most important variables shaping grid conditions as wind and solar capacity keeps expanding across U.S. power markets, and accurately anticipating how it will move load, generation, and congestion is critical to building a resilient monthly trading strategy. Temperature swings alter heating and cooling load while wind and solar output are highly sensitive to atmospheric conditions, so traders who understand these relationships can better anticipate which paths might become constrained under a specific weather scenario, especially during extreme events.
Looking at analog years and similar weather patterns
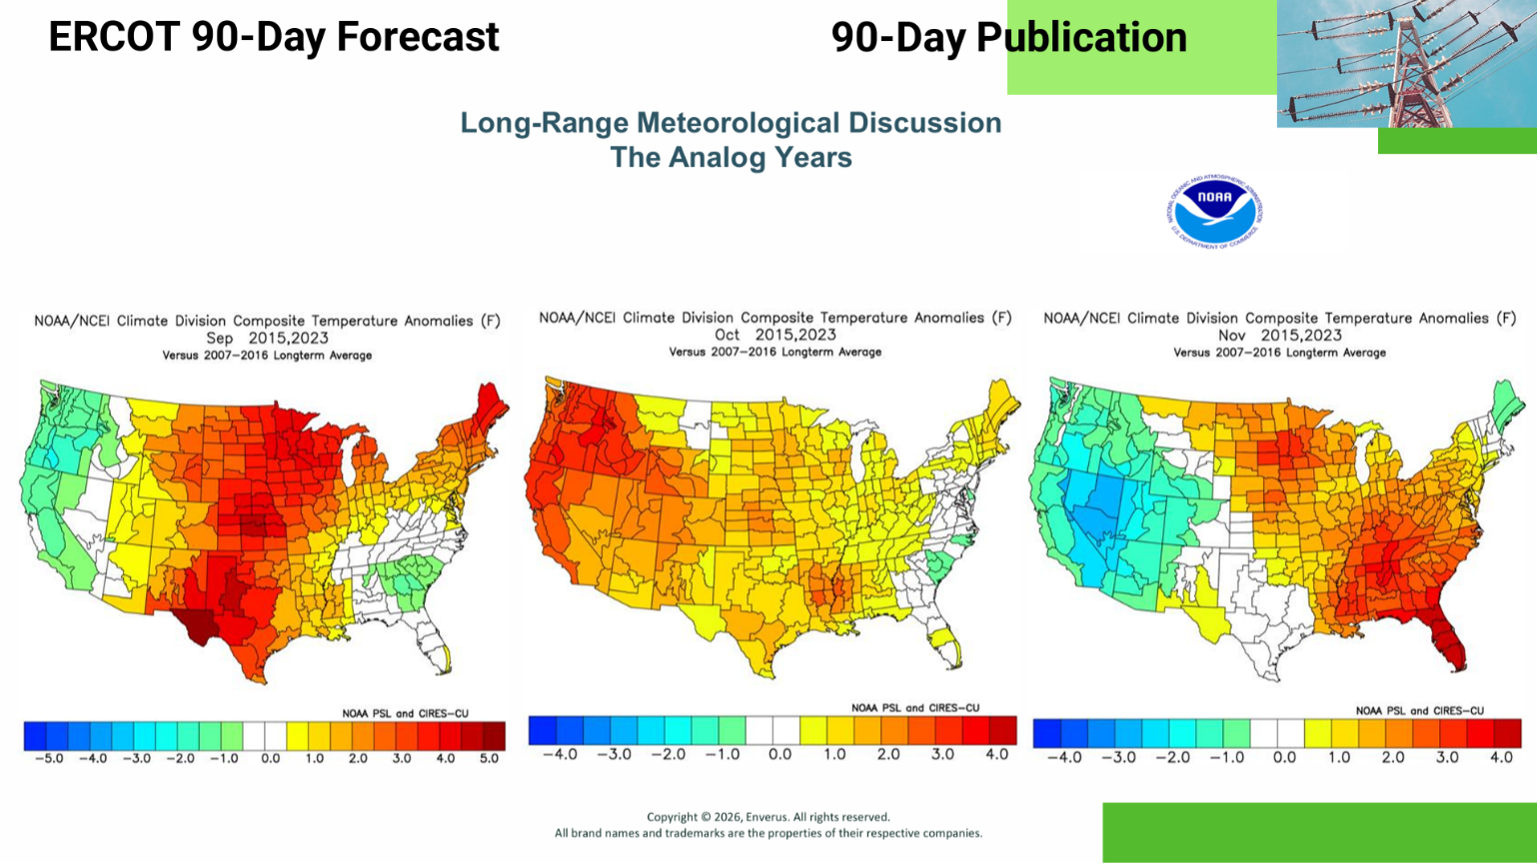
One starting point to study the weather and its impact on the grid is by examining analog years that had similar weather patterns and observing what occurred. If you identify a year where similar weather conditions occur, you can examine what the grid looked like and which paths bound, and that can help you narrow down your areas for interesting paths. Grid infrastructure changes constantly though, so if the analog year you’re comparing to is more than a couple years back and there have been significant changes to the power infrastructure since then, the historical view of the grid becomes a less reliable indicator of what the grid looks like under similar weather conditions.
Enverus ERCOT 90-Day Forecast Report
Looking further out
Seasonal and sub-seasonal forecasts help traders prepare for these longer-term trends too. Ocean-atmosphere patterns like El Niño and La Niña can drive persistent weather anomalies that shape a region’s power market for months at a time, bringing wetter, milder winters to some areas and drier, hotter conditions to others, and each of those has its own effect on load and generation.
Understanding these patterns, and roughly when they’re expected to show up, helps traders anticipate how congestion and pricing might shift heading into an auction.
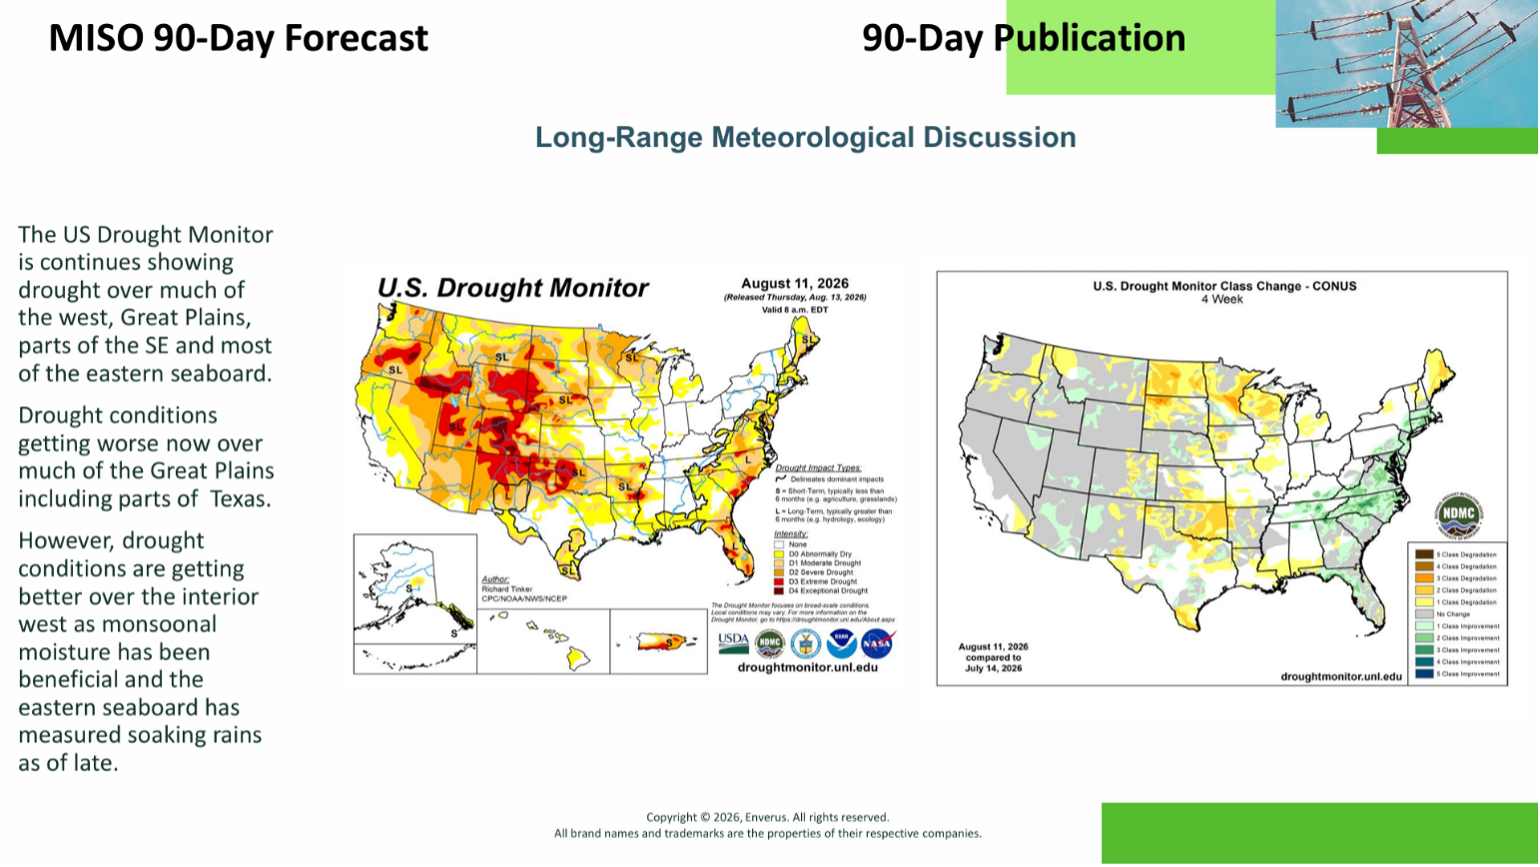
Enverus MISO 90-Day Forecast Report
Monitoring drought conditions
Monitoring drought conditions is also an important weather factor that can impact both load and power generation. When droughts occur, temperatures rise, causing higher load demand as water plays a critical role in keeping surrounding areas cool. Hydro power generation and thermal plants rely on water to generate power, so droughts will have a negative impact on how much power these power plants can generate, which can translate into unexpected congestion and price volatility right when auction positioning matters most.
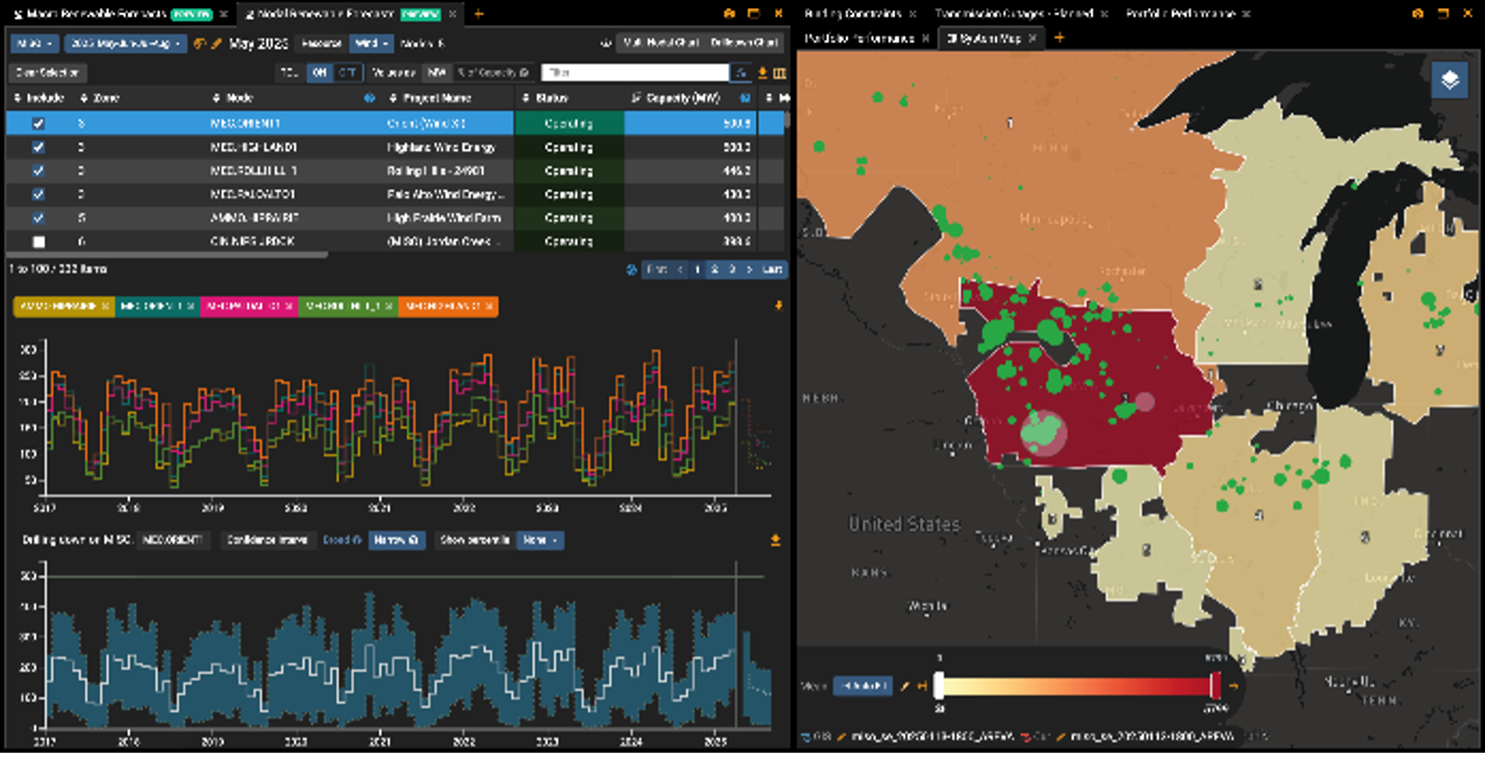
The Enverus Mid-Term Nodal Renewable forecasts relate seasonal weather forecasts to nodal and regional generation distributions for the upcoming FTR auctions.
Load Demand Growth
Infrastructure vs. demand
Demand refers to the amount of electricity that consumers need from the power grid at any given time. Understanding an area’s demand is important because it sets expectations for power prices and identifies potential areas where the power infrastructure may not be able to support the demand.
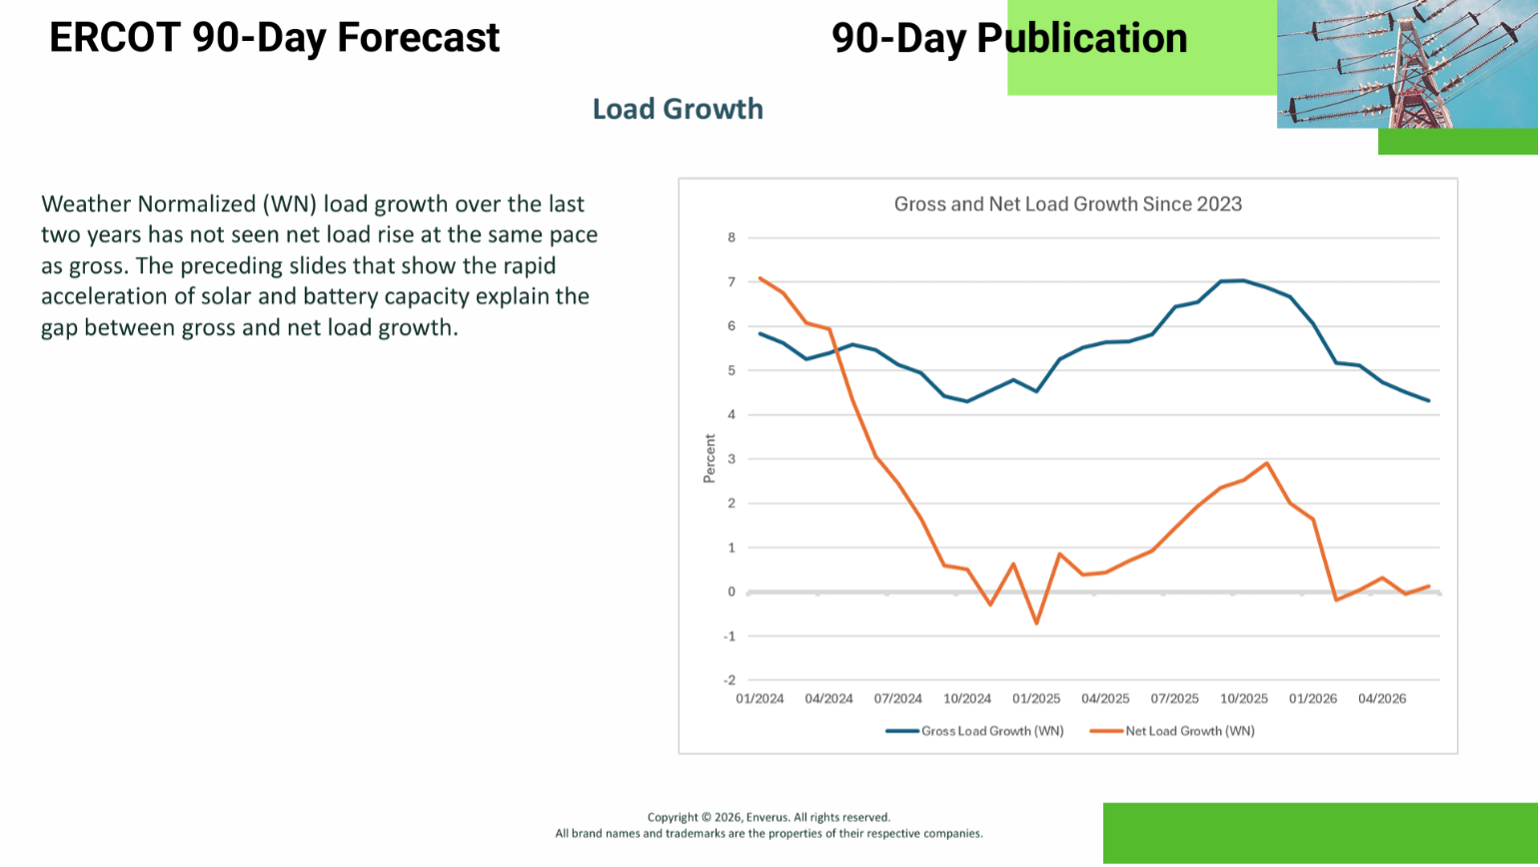
To predict where these potential areas may occur, it is helpful to investigate the expected growth in future load demand in an area, particularly if there are significant increases in demand. Rapid population or industrial growth, as well as the introduction of Bitcoin and rig operators, can result in significant increases in load demand.
It is also important to consider when these demand spikes will occur. Bitcoin miners and some manufacturers, for example, require electricity 24/7, which can affect off-peak hours more than morning or evening peaks, and power operators must adjust their operations to meet these changing demands.
Enverus ERCOT 90-Day Forecast Report
Bound Constraints
Identify constraint drivers
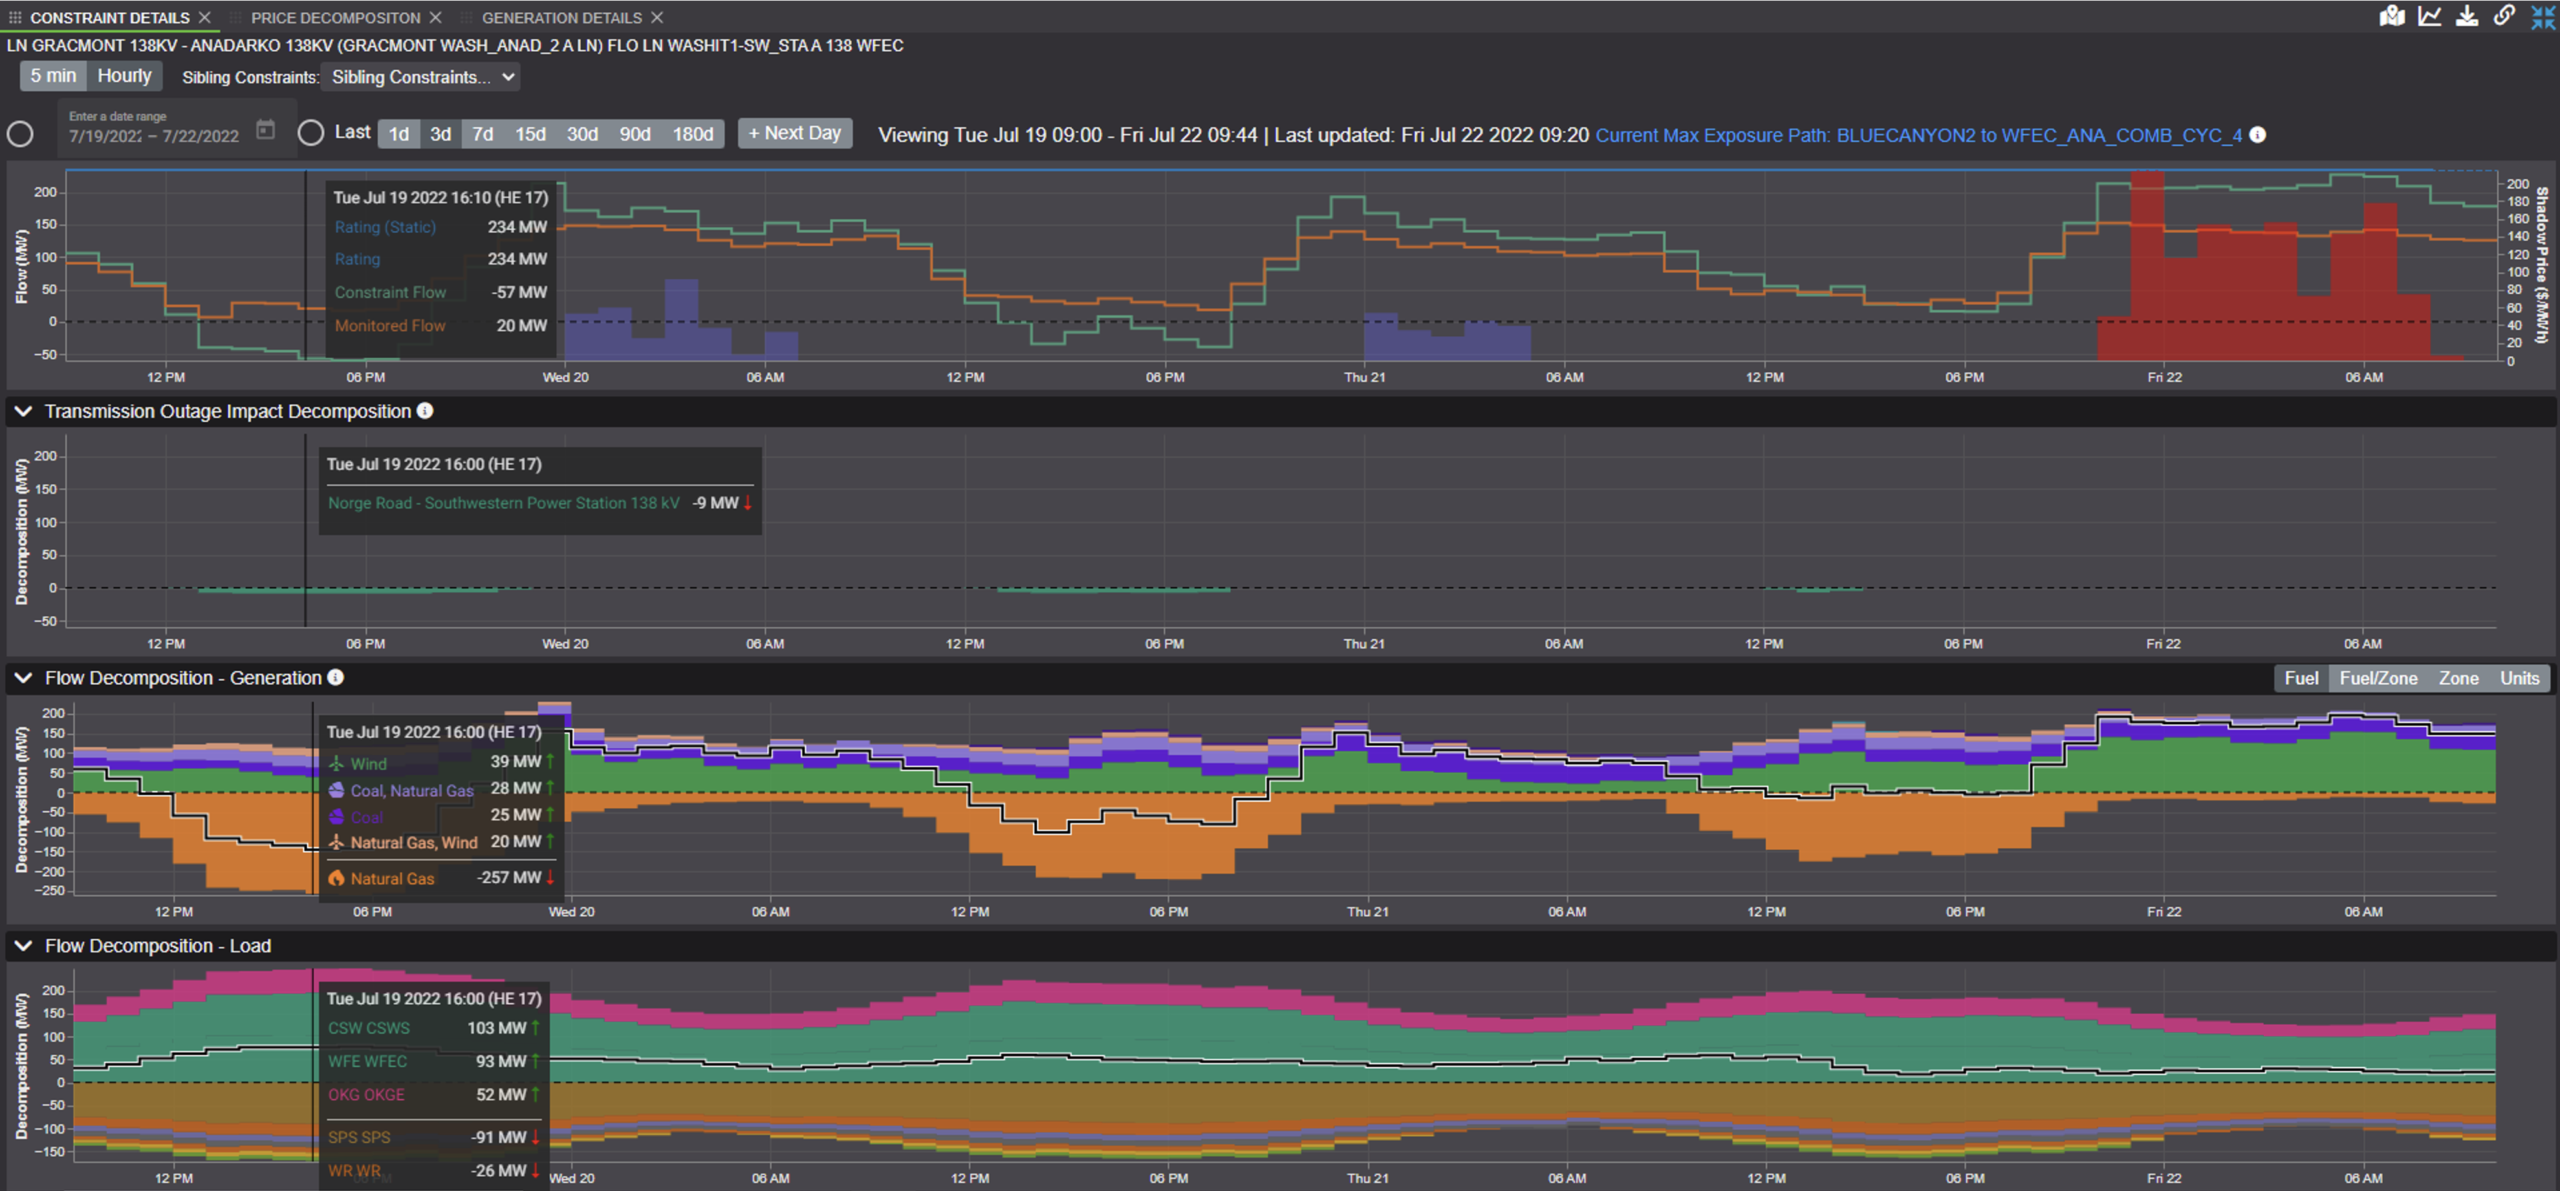
Analyzing past or recent constraints can provide valuable insights and guide future efforts to identify paths that may become constrained. To determine potential paths of interest, it is important to understand the underlying drivers of these constraints and predict whether they will persist in the future. Commercial diagnostic tools are available to aid in identifying the causes of constraints and building a case for their potential continuation.
Instantly decompose a constraint driver and understand why it happened with Enverus Mosaic.
Analyze scenarios
After identifying a constraint driver, it is possible to use constraint analysis tools to simulate different scenarios and assess their impact on the affected paths. Weather scenarios such as high or low wind, or cold or hot temperatures, can be inputted into the analysis tool to model the grid and identify potential paths that may become constrained. Running these types of scenarios can be time consuming though, so it is advisable to use automated constraint analysis tools to accelerate the process. These tools can significantly reduce analysis time and let users examine hundreds of constraints in just a few minutes while focusing on the most interesting paths.
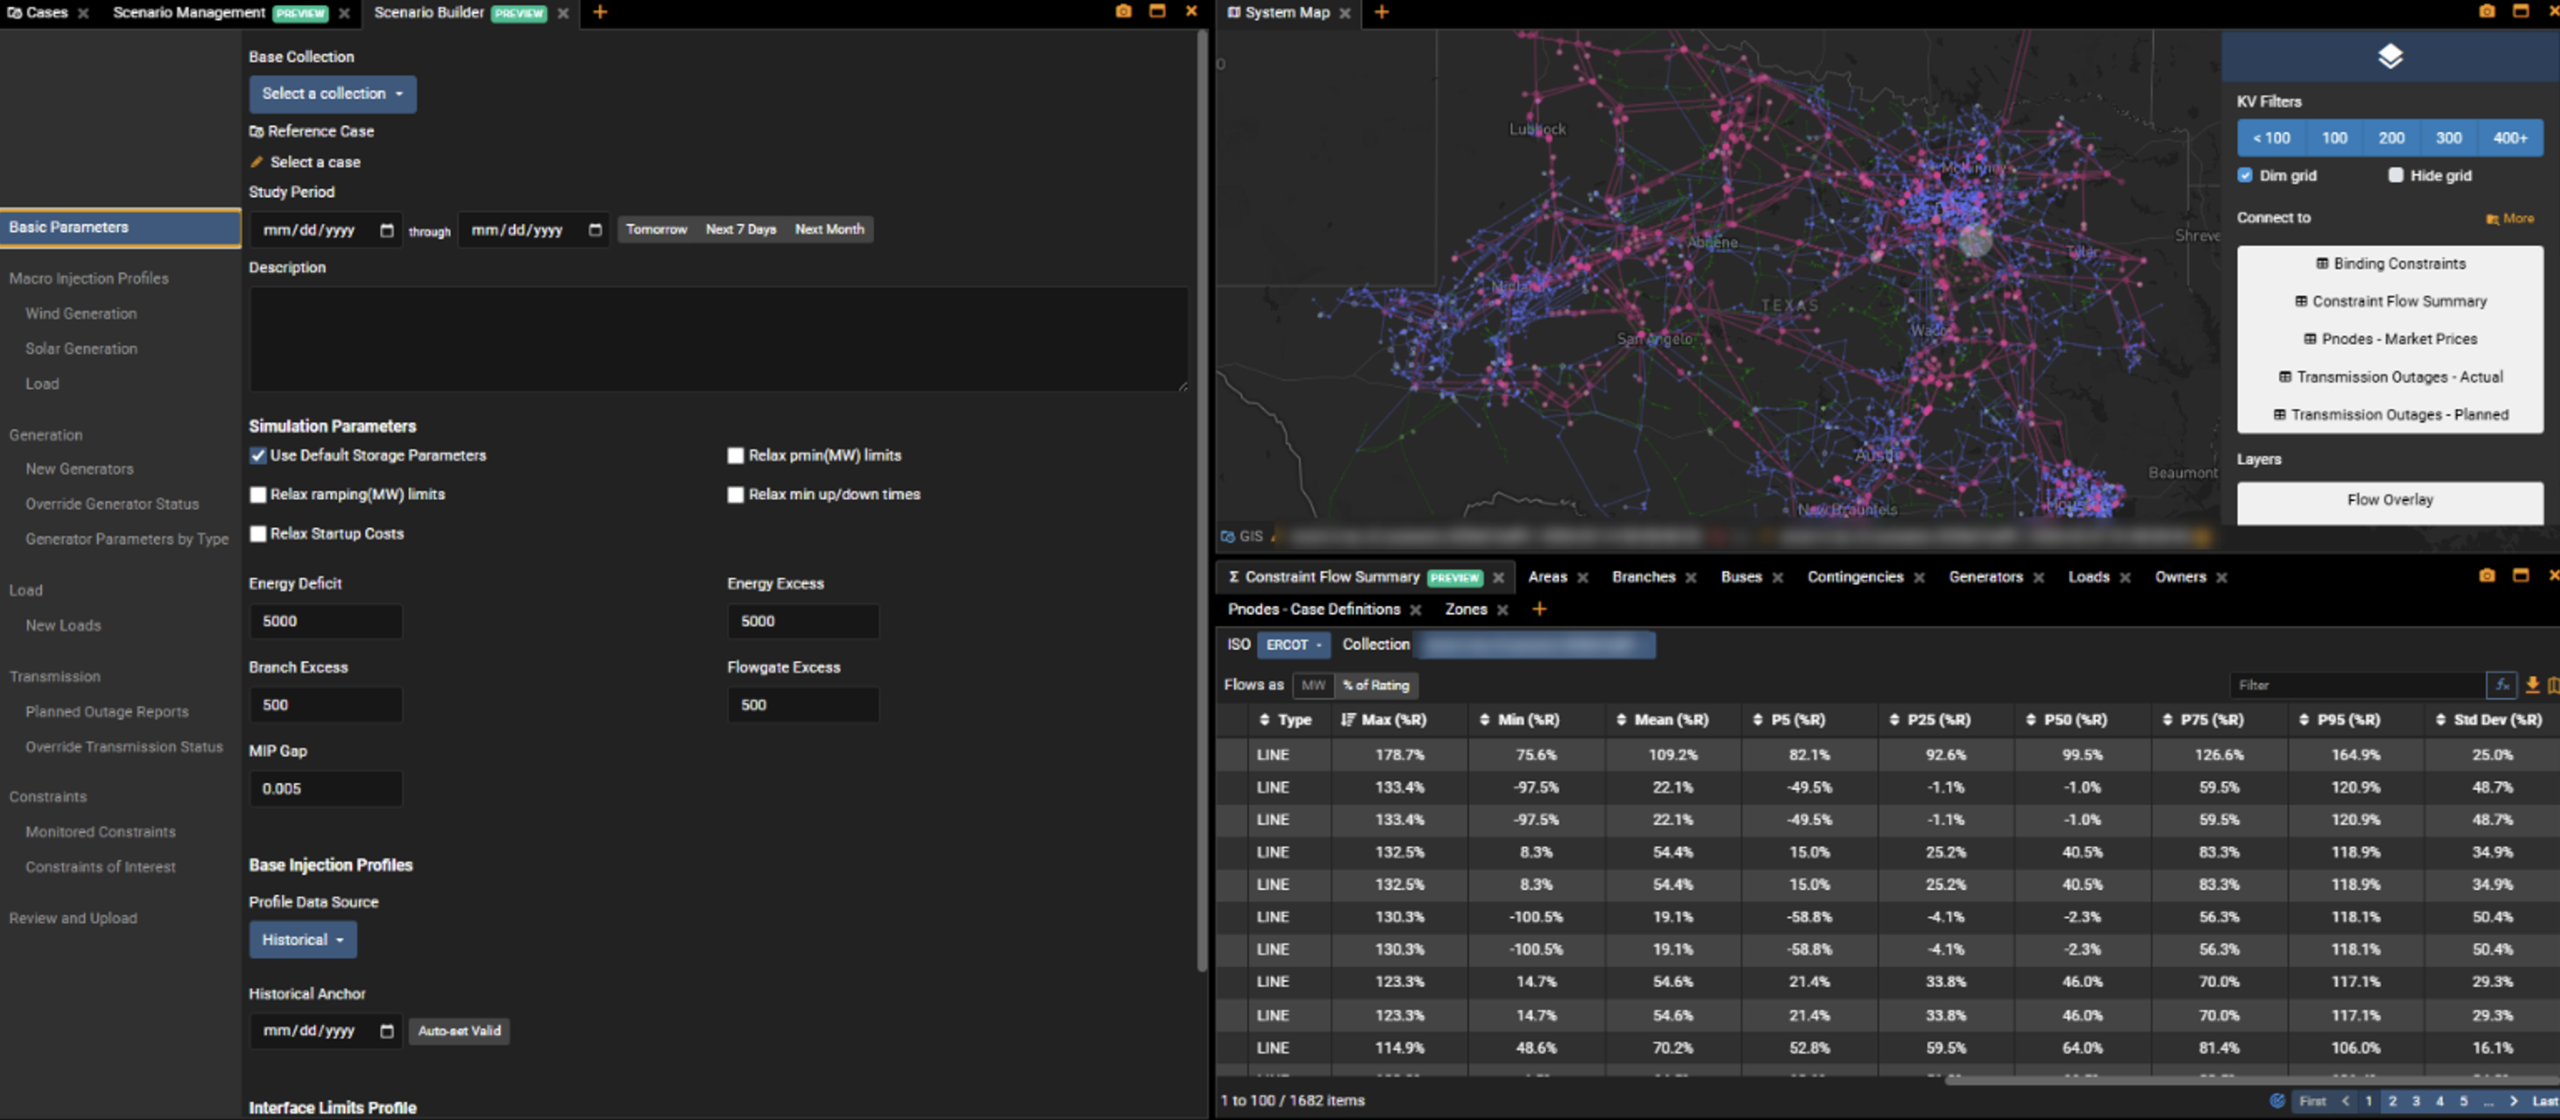
Tools like Power Flow Studio take this further, letting you build a fully customizable, rebalanced grid scenario directly in Panorama to see exactly how a specific weather or outage assumption would move congestion and shadow prices, all without leaving the workflow you already use for historical analysis.
Leverage advanced tools to simulate different scenarios and evaluate their impact on key transmission paths, helping identify potential congestion risks and trading opportunities.
Transmission and Generation Outages
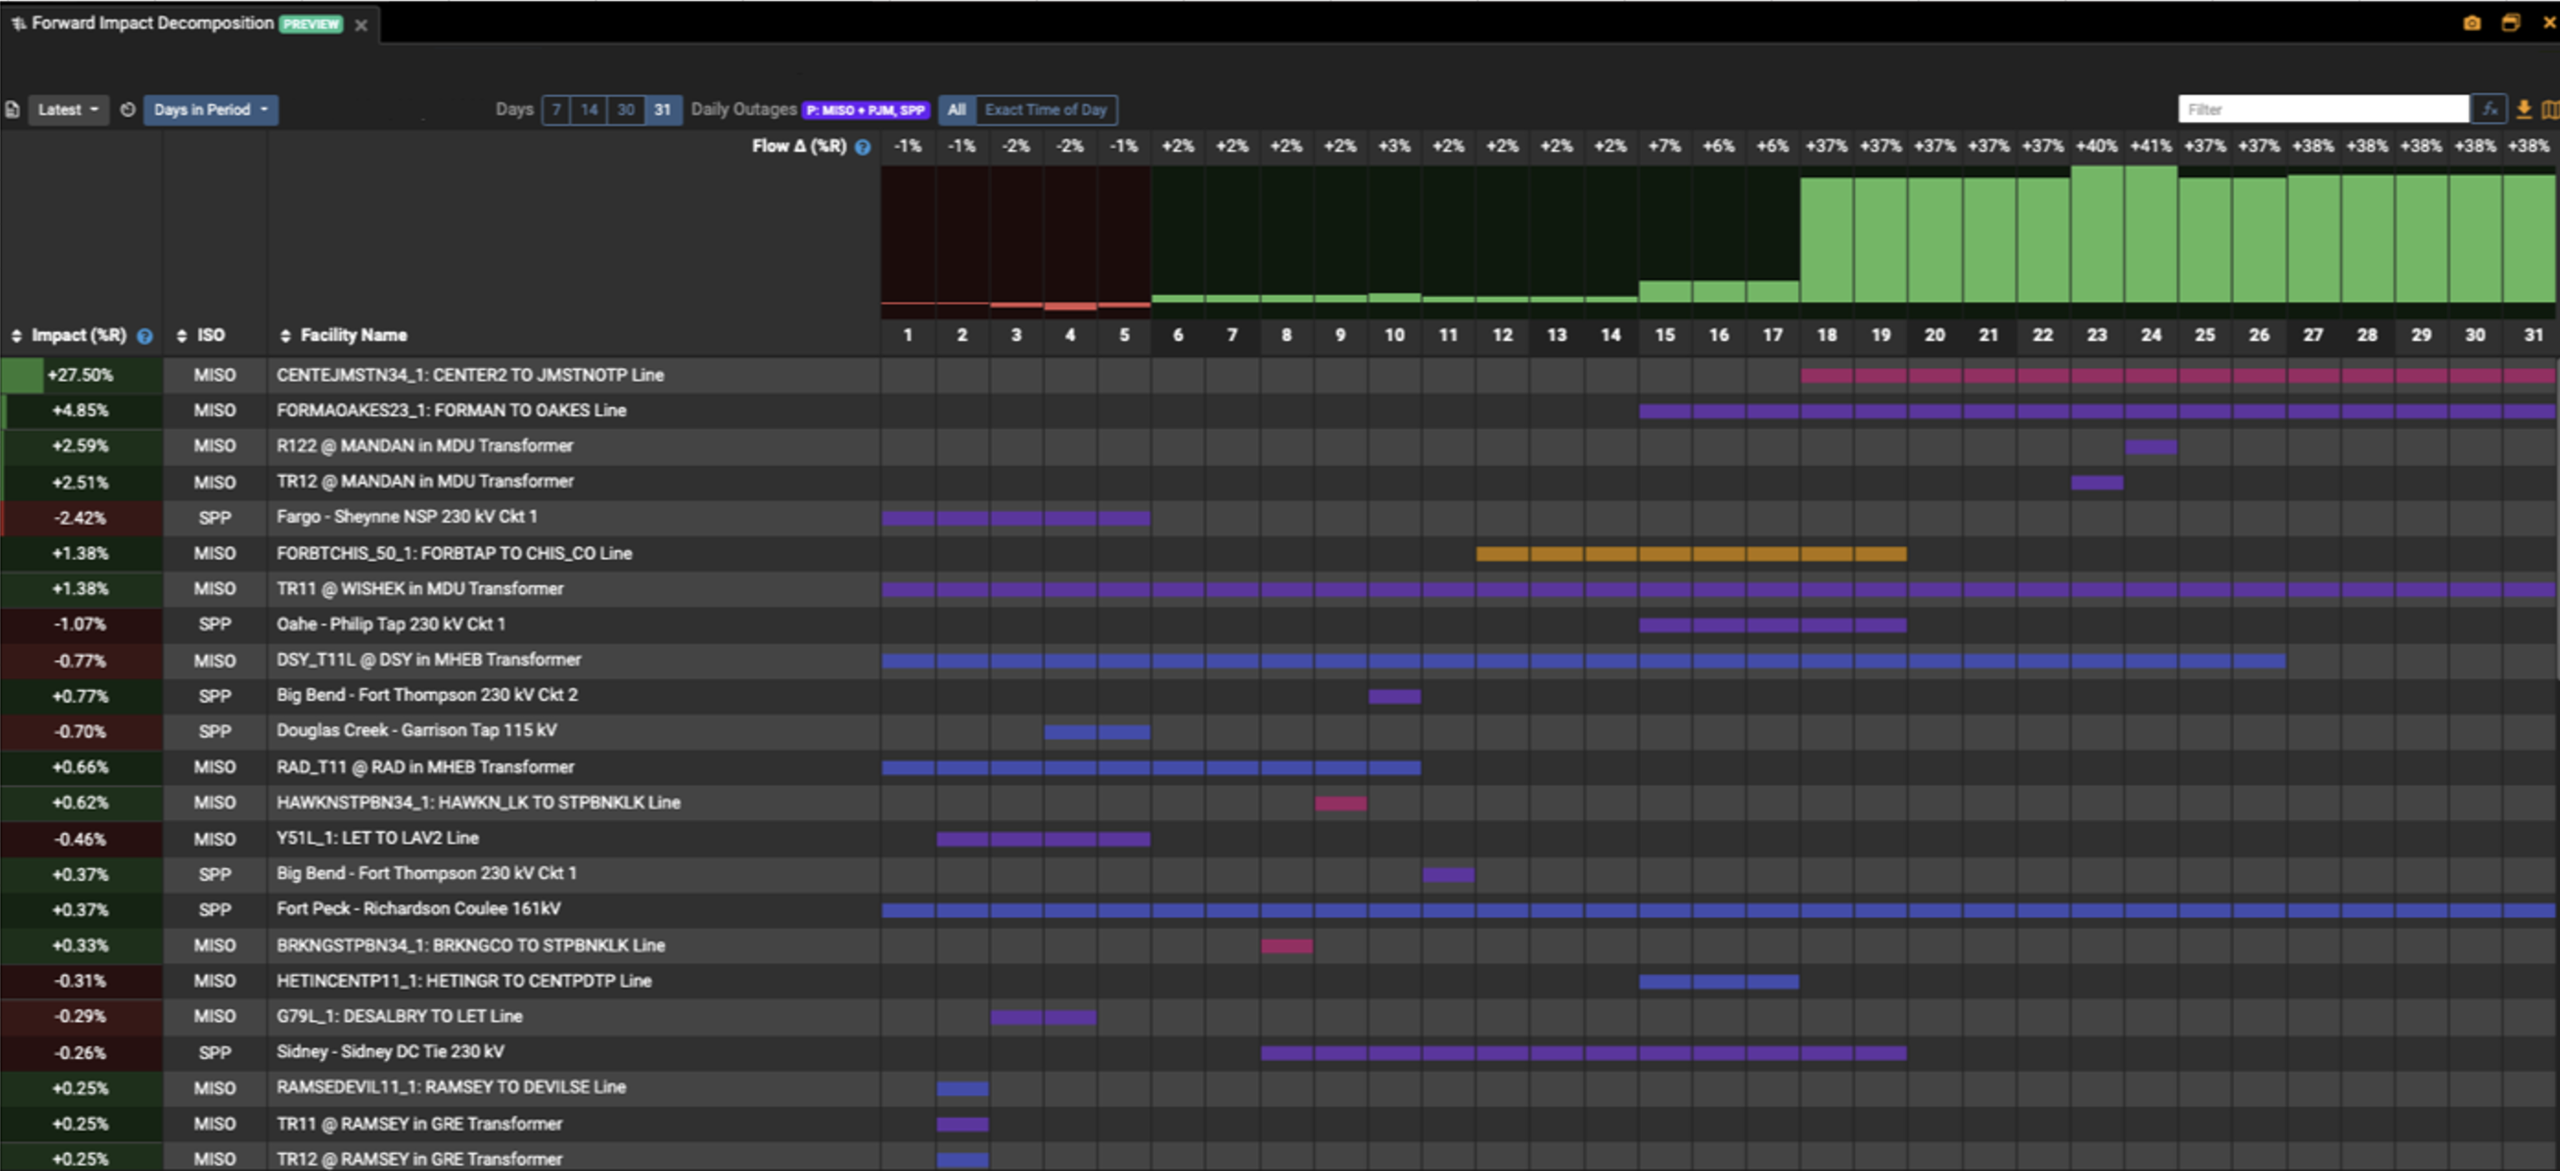
Reports on transmission and generation outages provide valuable information on upcoming maintenance that will impact generation and flows on the grid. Reviewing and understanding these reports can help identify constraints with a high likelihood of binding.
Users can dig into these reports and check historically how these same outages have impacted the grid and which constraints had bound. Tools are readily available on the market that simulate the effects of transmission or generator outages on the grid, helping uncover potential paths most impacted by this binding congestion.
Simulating outages enables FTR traders to efficiently uncover where congestion is most likely to emerge, allowing for broader scenario testing and quicker identification of high-risk areas across the grid.
These simulations can be tedious, so it is recommended to use automated tools that can help reduce analysis time, sometimes by tenfold, so that the focus can be on preparing trades instead of analysis. Power Flow Studio is built for exactly this, running the outage through an automated grid model so you can see its real effect on congestion and pricing without digging through historical cases by hand.
New, Retiring Generation, Load and Transmission
New generation projects, especially renewables and energy storage, keep coming online, and new large load like data centers and crypto mining operations keep ramping up, all while retiring generation and aging transmission infrastructure add their own uncertainty to how power will flow across the network. Traders who overlook these shifts risk misjudging congestion patterns, which can turn into costly misallocations of capital and missed revenue.
Gain insights from solutions that track load, renewables generation, outages and congestion.
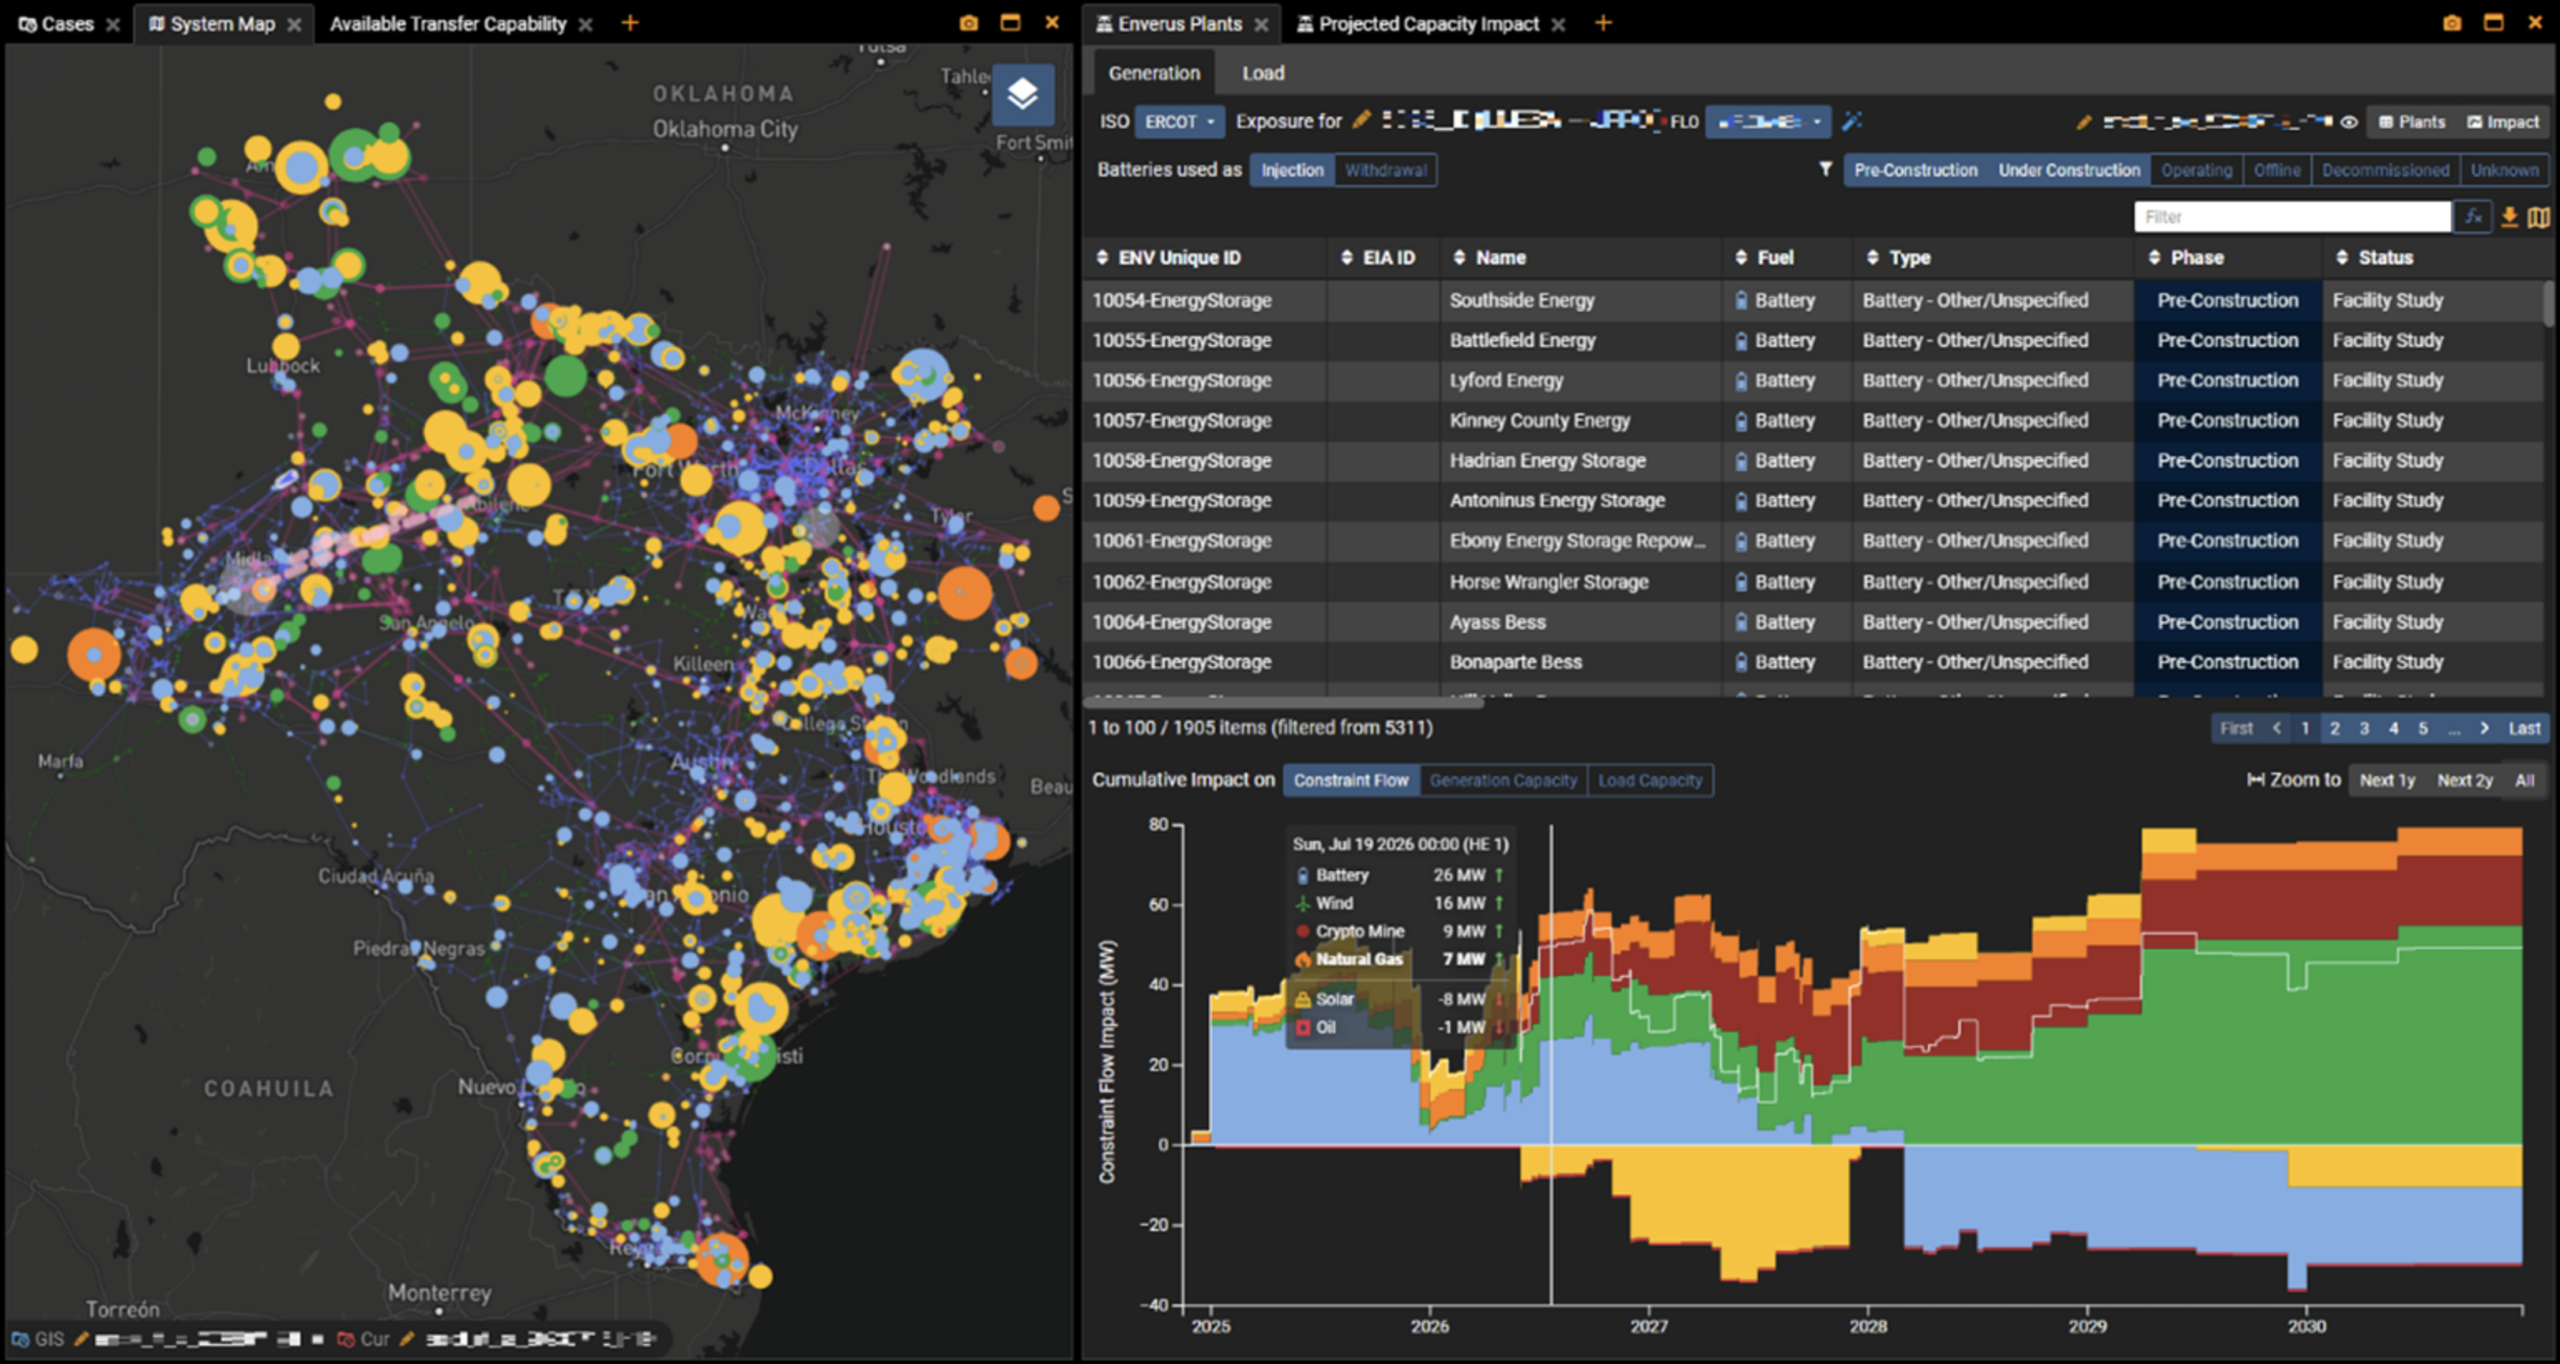
Getting a sense of where and when new generators or transmission lines will come online will bring clarity to what the electricity supply of the grid will look like. Once a date is determined for a new generator or transmission line, users can use tools to analyze its impact on the grid relative to existing constraints or its potential to create new constraints, creating new opportunities to look at.
Staying ahead means keeping visibility into planned and retiring generation, transmission buildouts, and upcoming load additions, and tracking where each one sits in the interconnection queue. That visibility helps traders see where congestion risk is most likely to build, especially in areas where transmission constraints are already tightening, and it makes evaluating transfer capability at key interconnection points a much more grounded exercise.
Similarly, when a generator or transmission line is taken offline, analysis can be done to see how its decommissioning will impact the grid. This kind of forward modeling is far less manual than it used to be, whether you’re adding a new resource or pulling one offline.
Project Delays
When power projects are delayed, power that was expected to come online will be later than originally anticipated. As a result, positions that were based on those original timelines will need to be adjusted. Staying informed about the latest updates on power project timelines can provide an opportunity for traders to adjust and capitalize on the new projected start date. Comparing a delayed timeline against the original one is a quick exercise if you’re already set up to model grid scenarios, and it can surface exactly how much a slipped in-service date shifts congestion and pricing.
Regulatory Considerations
It is important to keep on top of regulatory changes as they can have a significant impact on the power markets. Changes in regulation, for example, could affect the cost of generation, transmission or distribution of power, which will impact your trading strategy. Regulatory changes could also lead to changes in the availability of FTRs or the rules governing their trading, which could affect the market dynamics and FTR prices too. At monthly cadence, this matters even more than it does for annual auctions, since a single rule change can touch multiple auction cycles a year before it fully works through the market.
Navigating this complexity is easier with direct access to veteran power analysts who track these shifts daily, and their real-time commentary and interpretation help you understand what a given regulatory change actually means for your positioning before it shows up in price.
After completing the analysis and identifying attractive trading constraints, it’s important to determine the appropriate price to pay for them. Rather than manually cross-referencing forecasts, portfolios, and market activity across systems, you can ask Power Analyst directly. It pulls the right data from your Mosaic and Panorama subscriptions automatically and returns a structured, decision-ready answer in minutes, whether that’s what’s driving a specific congestion price or how your portfolio compares to the market.
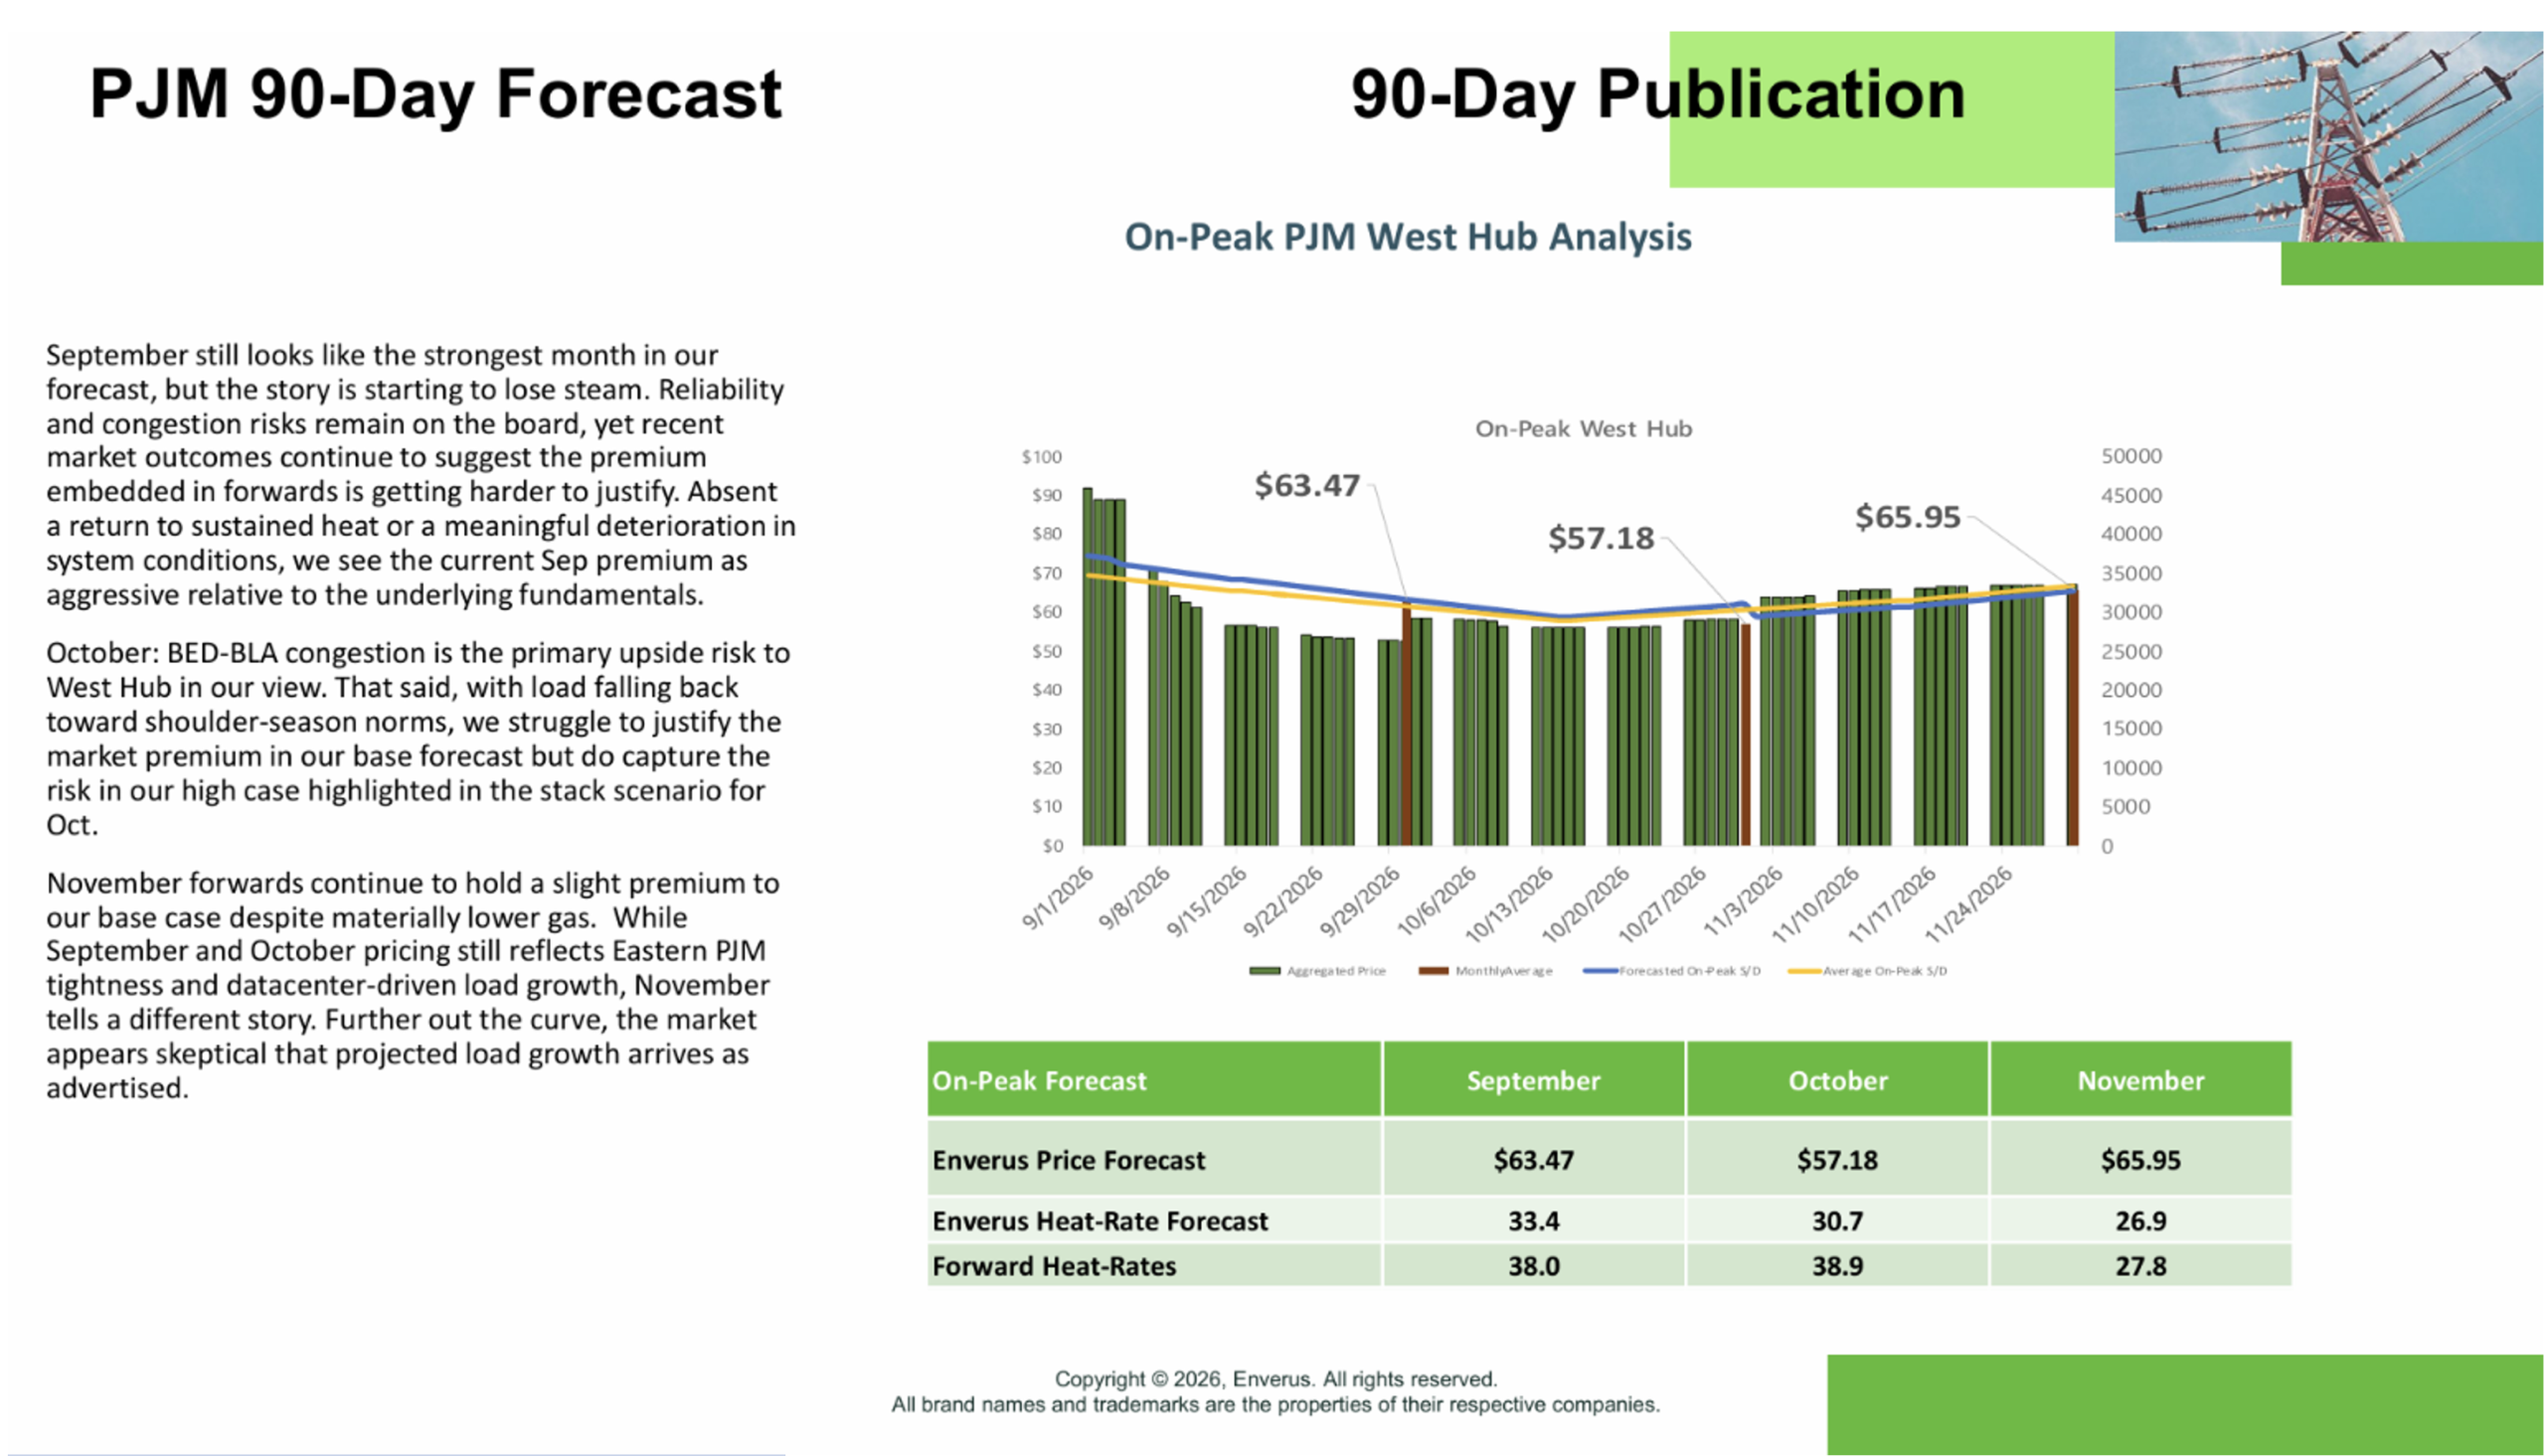
Enverus PJM 90-Day Forecast Report
Bringing It All Together
Power Flow Studio and Power Analyst are built to work together across your monthly auction prep. Use Power Flow Studio when you need to answer what if, modeling how a weather event, outage, new generator, or delayed project would move congestion and pricing. Power Analyst is there when you need to answer what’s happening and why, pulling instant, structured answers from your Mosaic and Panorama data without making you hunt through dashboards. Together, they turn the seven factors in this e-book from a multi-week manual process into a repeatable monthly workflow.
Enverus Power Flow Studio
Let’s get started!
We’ll follow up right away to show you a quick product tour.
Let’s get started!
We’ll follow up right away to show you a quick product tour.