Enverus Press Release - CO2 pipeline economics: The missing link

CO2 pipeline economics: The missing link

CALGARY, Alberta (April 2, 2024) — Enverus Intelligence Research (EIR), a subsidiary of Enverus, the leading generative AI and energy-dedicated SaaS company, has developed a CO2 Pipeline Economic Model that can be used to analyze transportation economics in the carbon, capture, usage and storage (CCUS) value chain.

Utilizing the CO2 Pipeline Economic Model, a new EIR report analyzes the differences between CO2 and natural gas pipelines and outlines the importance of minimizing CO2 transportation costs through hub and trunkline pipeline designs. For example, EIR has used the model to analyze the canceled Navigator CO2 Heartland Greenway project economics to illustrate the hub-scale economics the project was targeting.

“With carbon capture gaining momentum as a method to lower emissions, many industries still face challenges in terms of economic viability for the entire capture and storage value chain,” said Jeffery Jen, senior associate at EIR.

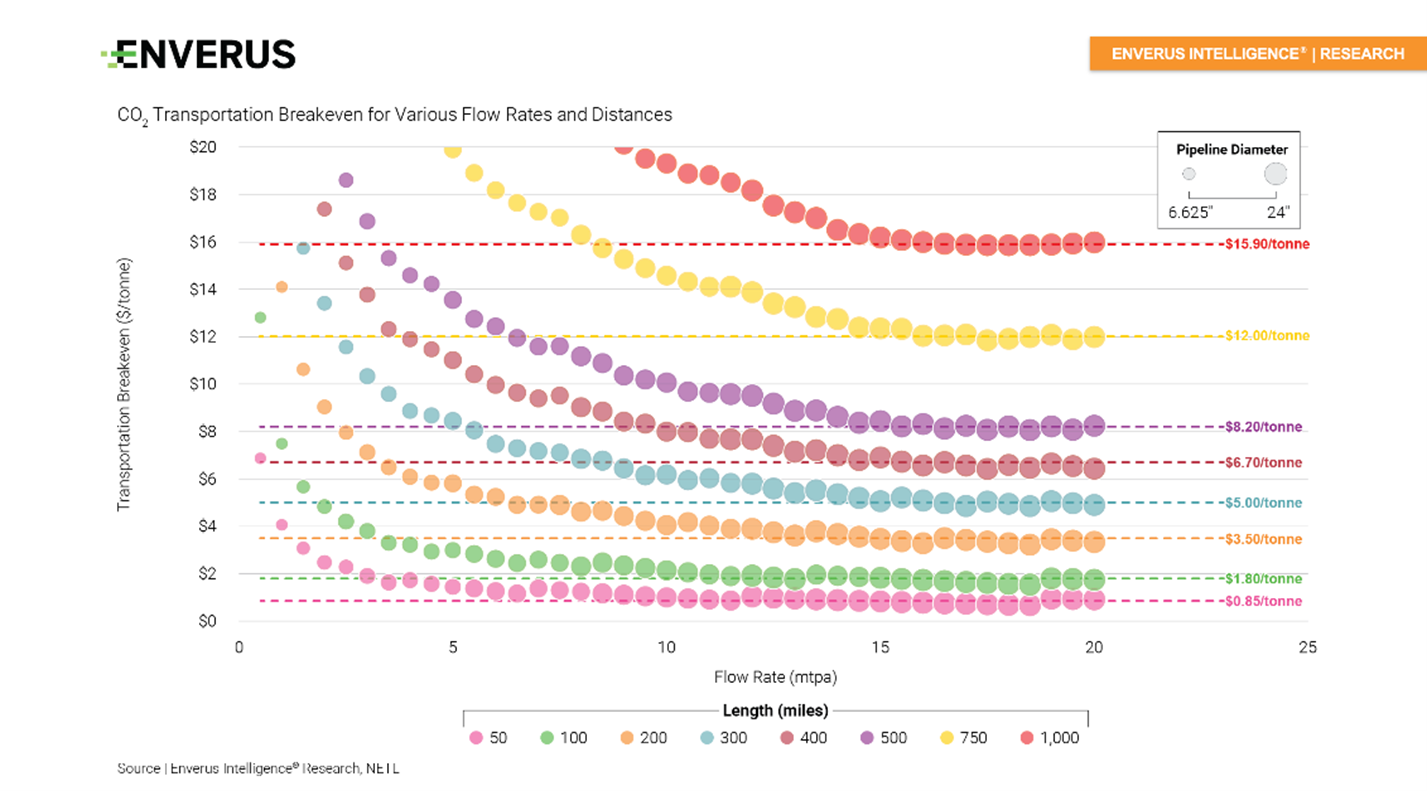
“A key component of the overall cost and ultimate success of these projects will be their transportation strategies — whether they can leverage trunkline designs to connect to higher-quality storage reservoirs and reduce transportation and storage costs,” Jen said. “EIR calculates that projects should target bundled captured emissions of 12-18 million tonnes per annum (mtpa) as part of their transportation strategies to minimize transportation costs and maximize profitability.”

Key takeaways:

  • Only 290 mtpa, or 13%, of U.S. emissions break even below $85/tonne assuming top decile storage costs. Developing transportation strategies that utilize trunkline design to maximize flow rate while connecting emitters to higher-quality reservoirs will be a key strategy for profitable CCUS projects.
  • The CO2 transportation breakeven ranges from $0.85-$15.90/tonne, contingent on optimal flow rates of 12-18 mtpa.
  • Labor and materials constitute 50% of the CO2 transportation breakeven, creating cost escalations more than 10 times caused by locational disparities in labor costs, access to materials and terrain variability.
  • The canceled Navigator CO2 Heartland Greenway project showed cost savings of almost 10 times through the utilization of a trunkline design. The CO2 transportation breakeven would have been under $10/tonne with 15 mtpa of capacity.
  • With the addition of the CO2 Transportation Economic Model, EIR can now model the economics of the entire CCUS value chain.
Enverus graph showing Co2 transportation breakeven for various flow rates and distances

EIR’s analysis pulls from a variety of Enverus products including Energy Transition Research and Enverus Infrastructure.

You must be an Enverus Intelligence® subscriber to access this report.

About Enverus Intelligence Research
Enverus Intelligence ® | Research, Inc. (EIR) is a subsidiary of Enverus that publishes energy-sector research focused on the oil, natural gas, power and renewable industries. EIR publishes reports including asset and company valuations, resource assessments, technical evaluations and macro-economic forecasts; and helps make intelligent connections for energy industry participants, service companies and capital providers worldwide. EIR is registered with the U.S. Securities and Exchange Commission as a foreign investment adviser. Enverus is the most trusted, generative AI and energy-dedicated SaaS platform, offering real-time access to analytics, insights and benchmark cost and revenue data sourced from our partnerships to 98% of U.S. energy producers, and more than 35,000 suppliers. Learn more at Enverus.com.

Media Contact: Jon Haubert | 303.396.5996

View all press releases at Enverus.com/newsroom.

Enverus News Release - Utility growth prospects: Quantifying long and short opportunities

CAISO This Month: Transmission Outages and Bearish Prices

For much of March, the California Independent System Operator (CAISO) experienced significant fluctuations in power prices due to congestion, transmission outages and bearish pricing trends in SP-15. My team used Panorama to better understand and the Power Market Publications in Mosaic to explain the wholesale power market trends going on this month to our customers.

In March, Enverus launched CAISO into our Panorama platform, which allows us to see transmission outages and how they impact wholesale power markets by showing price decomposition, binding constraints and constraint shadow prices. The image below is our Panorama tool showing transmission flows throughout the Western Electricity Coordination Council.

Panorama helped my team get a better understanding of SP-15 prices and how bearish prices were going to be in the month of March. We were able to highlight some of the volatility in prices and the large spread between SP-15 and NP-15 with daily commentary and price forecasts in our Power Market Publications that come out daily in our Mosaic platform by 7:00 a.m. CT. For example, as early as the week of March 4, the Power Market Publications were highlighting the risk that transmission outages would have on SP-15 prices especially during high renewable periods.

Our price map showcased the wide basis, with NP15 maintaining the premium hub in the day-ahead market, while SP-15 struggled to transmit megawatts northward into Mid-C or NP-15. SP-15 on-peak prices averaged $7.57 and NP-15 $29.60 from March 1-27. The map below is the average RT prices from March 8-14 and is good example of how transmission outages and strong renewable generation in the south impacted wholesale power prices.

Through much of March, Panorama highlighted trouble spots, most notably the congestion in NP-15 around Moss Landing and in the southern San Francisco Bay area, which contributed to increased prices in NP-15. Transmission outages in key corridors, such as the Mid-way/Vincent/Los Banos hindered the flow of electricity toward the north, resulting in trapped megawatts (MWs) in SP-15. Furthermore, we saw transmission line outages in the Central Valley trapping MWs in the south and transmission work in the Imperial Valley leading to congestion on the Mexican border exacerbating supply imbalances. The SP-15 price forecast continues to take on a bearish outlook as we continue to see numerous outages and ongoing maintenance work so bearish conditions are expected to persist. There should be some relief by mid April as the DC line work ends and SP-15 can send flow up to Mid-C. In addition, power units planned outages begin to increase.

The relationship between transmission outages, renewable generation forecasts, and market dynamics emphasizes the complexity of managing wholesale electricity in CAISO. As the region grapples with infrastructure challenges and evolving renewable energy integration, traders and power market participants must navigate market uncertainties with care. Leveraging solutions like our Power Market Publications and Panorama can help better manage against these uncertainties in the power markets.

energy-transition-group-of-professionals-meeting

Data Center Demand | Framing the Frenzy 

TeleGeography Submarine Cable Map used under license CC BY-SA 4.0

One of the most common and important questions for the power sector today is what impact artificial intelligence and the data centers needed to generate it will have on energy consumption. AI is quite unlike any energy challenge we’ve seen, and it is a key part of why 15 consecutive years of near-flat power consumption in the U.S. is about to come to an end.

Some of the biggest uncertainties we see:

  • How will technological efficiency gains offset potential load growth?
  • If generative AI is achieved, how much faster will power supply have to grow?
  • What energy technologies are fit to meet this unprecedented source of demand?
  • Where will these facilities be cited, and will they elect to go behind the meter?

In our view, rapid technological innovation like Nvidia’s new Blackwell chip design (which would have consumed 75% less power to train ChatGPT4) and a mystical level of cooperation between federal bodies, regulators, AI companies and energy suppliers is a minimum requirement to allow for the rapid deployment of these facilities. The most readily available power supply will come from gas-fired generators. However, if emissions are as great a concern as the Magnificent Seven group of tech companies claims, the only viable paths forward to achieve zero-emissions and triple redundancy will be the accelerated development of advanced baseload supply solutions, such as nuclear and geothermal.

Research Highlights

(You must be an Enverus Intelligence® Research subscriber to access links below)

Enverus Press Release: Beyond the horizon: US solar and storage solutions are on the rise

Beyond the horizon: US solar and storage solutions are on the rise

CALGARY, Alberta (March 28, 2024) — Enverus Intelligence Research (EIR), a subsidiary of Enverus, the leading generative AI and energy-dedicated SaaS company, has released a report that quantifies annual cost savings of rooftop solar and forecasts residential demand. The report looks at the historical correlation between available cost savings and annual installs, while considering the impacts of incentives, retail power prices, solar panel and storage system costs, interest rates, and the implementation of the net metering tariff.

“The U.S. is expected to witness a substantial surge in rooftop solar installations, with an anticipated 616 gigawatts installed by 2050, representing a 41% adoption rate among eligible households. Texas leads this expansion with over 75 gigawatts of capacity by 2050, followed closely by California, New York and Florida,” said Kevin Kang, senior associate at Enverus.

“As interest rates stabilize and solar panel costs decrease by a projected 29% from the current year to 2030, the period between 2025 and 2029 holds significant economic potential for the residential solar market,” Kang said.

“States expected to implement a net metering tariff before 2030, such as California, Arizona, Massachusetts, Colorado and Rhode Island, are forecasted to experience the greatest impact on new installations.

“In addition, storage solutions paired with new residential solar installs are expected to become economically feasible in 2033, with 29 out of the 48 states showing more savings. Notably, California, Arizona and Massachusetts are poised to reap the highest savings due to their early implementation of a net metering tariff.”

Key takeaways:

  • EIR anticipates 616 gigawatts of installed rooftop solar in the U.S. by 2050, or 41% adoption across households that have the potential to install it.
  • Texas leads the robust expansion of residential solar installations, boasting more than 75 gigawatts of capacity by 2050. Next is California with more than 69 gigawatts, followed by New York and Florida at 46 gigawatts and 41 gigawatts.
  • EIR expects an increase in the number of residential solar customers in the coming years as interest rates stabilize. The period 2025-2029 holds significant economic potential, especially with a projected 29% decrease in solar panel costs from the current year to 2030.
  • States expected to implement a net metering tariff before 2030 (California, Arizona, Massachusetts, Colorado and Rhode Island) are forecast to have the greatest impact on new installs. States such as Texas, North Carolina, Missouri and Indiana are experiencing a smaller impact because of increases in solar prices and a decrease in solar panel costs.
  • Storage solutions paired with new residential solar installs become economically feasible in 2033, with 29 out of the 48 states showing more savings. The highest savings will be in California, Arizona and Massachusetts due to an early implementation of a net metering tariff.

EIR’s analysis pulls from a variety of Enverus products including Enverus Foundations® Power & Renewables.

You must be an Enverus Intelligence® subscriber to access this report.

About Enverus Intelligence Research
Enverus Intelligence ® | Research, Inc. (EIR) is a subsidiary of Enverus that publishes energy-sector research focused on the oil, natural gas, power and renewable industries. EIR publishes reports including asset and company valuations, resource assessments, technical evaluations and macro-economic forecasts; and helps make intelligent connections for energy industry participants, service companies and capital providers worldwide. EIR is registered with the U.S. Securities and Exchange Commission as a foreign investment adviser. Enverus is the most trusted, generative AI and energy-dedicated SaaS platform, offering real-time access to analytics, insights and benchmark cost and revenue data sourced from our partnerships to 98% of U.S. energy producers, and more than 35,000 suppliers. Learn more at Enverus.com.

Media Contact: Jon Haubert | 303.396.5996

View all press releases at Enverus.com/newsroom.

taming-midstream-costs-refined-expense-accruals

Taming midstream costs: Refined expense accruals

Midstream is caught between a rock and a hard place. On one hand, gathering and pipeline operators, processors, storage and energy marketers face abundant opportunities and challenges when meeting customer demand. And it’s only becoming more complex with accelerating operator M&A shaping the production landscape and increasing global demand for both oil and U.S. LNG. On the other hand, midstream companies face fierce competition, low tariffs and lingering inflationary pressure that pushes labor and supply chain costs higher. 

When it comes to best-in-class financial performance, revenue generation is just one side to the cash flow coin. Of equal importance is spend management and accurately accruing for inbound expenses. Without a clear view of your inbound expense pipeline, teams can overbudget accrual and lose return on capital deployed. Or perhaps worse, come in underbudget and be short on cash when it is time to pay the bills. Either way, missing the moving expense accrual target signals poor financial discipline for investors and shareholders. 

Obscuring a clear view of the inbound expense pipeline, many midstream companies are flooded each month with hundreds or even thousands of vendor invoices, each vendor having negotiated different payment terms (e.g., net 30, pay early for 3% discount). At best, these invoices arrive in a PDF or other digital form. And at worst, they arrive in envelopes stuffed with multiple invoices from the same vendor. None of these fit neatly into your AP and accounting system, leading most teams to throw people at the problem, close the month with a flurry of activity, and hope that duplicate invoices or overpayment didn’t slip through the cracks. 

Energy accounting professionals know that accounts payable automation is often easier said than done. There’s a technology piece for extracting AP invoice metadata from an unstructured data format (PDF or paper), coding, validating, routing and approving. This is the “ante up” for AP automation solutions, of which there are many on the market. Those who do it well, like OpenInvoice from Enverus, layer on value added features for streamlining each step in the process to further simplify and accelerate invoice coding with pre-filled fields, assign delegates when primary approvers are out and escalate approval when amounts exceed budget. 

But the technology really is the easy part. Where AP automation can fail or flourish is getting vendor buy-in to participate directly in the process. That’s where OpenInvoice stands out from a crowded room of seemingly similar AP solutions, and that’s before you understand the network effect. 

Yes, OpenInvoice antes ups and raises the stakes with its best-in-class, cloud-based AP automation. But in this game, we’re the only vendor who can raise the other players at the AP automation table with a reciprocal data sharing network that plugs as much as 75% of the midstream supply chain directly into your AP and general ledger. That’s because a vast network of suppliers is already in the OpenInvoice network and can be added to AP invoice workflows with a few clicks. 

By definition, a “network effect” increases the value of a product the more people who join a network and actively participate (which explains why LinkedIn and Facebook are so powerful). It’s also a compounding benefit – the more midstream companies and suppliers who collaborate with OpenInvoice, the larger the network grows along with increased value. But how does having access to the premier buyer/supplier network in energy help with hitting your accrual target each month? 

OpenInvoice accelerates AP invoice processing efficiency through leading tech and access to existing network users. Suppliers simply submit their invoices directly to you in a standardized and consistent format for coding and quick validation, then routed with flexible workflows that can accommodate many branches and steps up in approval. Invoices can also be rejected back to an approver or to the starting line again with the vendor. 

Once invoices are approved by AP, 25 pre-built integrations with major ERP providers (think SAP) and energy-specific financial packages (think WolfePak) bring invoices that are ready to be paid into your financial accounting. Getting them in the queue fast means you can plan when to pay them with more granular control. OpenInvoice gives you a clear view of the entire expense pipeline, showing the inbound amount broken out by stage (coding, approving, rejected, etc.). In turn, midstream companies large or small gain greater control over their financial destiny, eliminate the monthly invoice scramble, and bring budgeted and actual accruals closer together than ever. 

Enverus press release - Renewing Alberta’s path for renewables

Renewing Alberta’s path for renewables

CALGARY, Alberta (March 27, 2024) — Enverus Intelligence Research (EIR), a subsidiary of Enverus, the leading generative AI and energy-dedicated SaaS company, is shedding light on the impact of ending a Feb. 28 moratorium by Alberta Premier Danielle Smith that also included a host of new restrictions on renewable power installations.

“Enverus identified nearly 60 planned renewable projects that are at risk of becoming restricted for development due to Alberta’s new regulations. That includes more than 2 gigawatts of wind projects and more than 5.6 gigawatts of planned solar projects,” said Ryan Luther, director at EIR. “The new restrictions pose a major setback to renewable development in the province and further increase the policy risk of investing in Canadian energy.”

Key takeaways:

  • Alberta paused the approval last year of significant new renewable energy projects due to grid reliability concerns and land use issues. This moratorium shut down investments in the sector and posed challenges to the clean energy goals of the federal Liberal government.
  • The end of this moratorium introduced new restrictions to combat some of these issues. The two most notable limits are a 35-km buffer zone around parks and protected areas and an “agriculture-first” policy that will no longer permit renewable generation developments on Class 1 and 2 lands unless the proponent can demonstrate the ability for both crops and/or livestock to coexist.
  • Enverus Intelligence Research has identified 57 pre-construction queued renewable projects and their owners that have now been classified as at high risk because of the new restrictions.

EIR’s analysis pulls from a variety of Enverus products including Enverus Intelligence® Research, Energy Transition Research and Enverus Foundations® Power & Renewables.  

You must be an Enverus Intelligence® subscriber to access this report.

About Enverus Intelligence Research
Enverus Intelligence ® | Research, Inc. (EIR) is a subsidiary of Enverus that publishes energy-sector research focused on the oil, natural gas, power and renewable industries. EIR publishes reports including asset and company valuations, resource assessments, technical evaluations and macro-economic forecasts; and helps make intelligent connections for energy industry participants, service companies and capital providers worldwide. EIR is registered with the U.S. Securities and Exchange Commission as a foreign investment adviser. Enverus is the most trusted, energy-dedicated SaaS platform, offering real-time access to analytics, insights and benchmark cost and revenue data sourced from our partnerships to 98% of U.S. energy producers, and more than 35,000 suppliers. Learn more at Enverus.com.

Enverus Press Release - The surprisingly balanced global LNG market

Gas players approach weak pricing with operational flexibility

Natural gas prices are setting up E&P companies operating in gas plays for a challenging 2024, maybe more challenging than they expected. On March 20, the 12-month strip settled at $2.71/MMBtu, down from more than $3.00/MMBtu when the year started, and the front-month settled at $1.70/MMBtu. The warm winter and growing associated gas production have pushed gas storage volumes 41% above the five-year average and 21% higher than this time last year, at 2.33 Tcf as of March 15.

The vast majority of Appalachian producers announced maintenance production plans at the start of the year, but Chesapeake Energy, which also operates in the Haynesville, is taking a more proactive approach, and EQT Corp. and CNX Resources announced additional measures after their guidance announcements. While companies are certainly protective of cash flow, they all want to be ready to service the next wave of LNG projects coming online in 2025.

Chesapeake cutting TILs by 20% YOY, building 1 Bcf/d in deferred capacity.

Chesapeake is addressing lower natural gas demand by planning to turn in line 20% fewer wells in 2024 than in 2023. In late February, the company had five rigs running in the Hayesville, four in the Marcellus, and four frac crews evenly split between the two plays. One Haynesville rig is being dropped in March, along with a frac crew in each of the plays, and one Marcellus rig will be cut at mid-year. The resulting seven-rig, two-crew activity level will be maintained through year’s end. Chesapeake plans to drill 95-110 wells in 2024 while turning in line only 30-40 wells. In contrast, during 2023 the company drilled 193 wells and turned in line 166 wells. By deferring TILs in 2024, Chesapeake says it will build capital-efficient production capacity that can be utilized when demand recovers. By year’s end, that capacity could be up to 1 Bcf/d. The company’s output will fall 21% YOY at midpoint to a 2024 average of 2.65-2.75 Bcfe/d.

After announcing its 2024 operational plans in February, EQT said March 4 it was curtailing 1 Bcf/d of gross production from late February through March, after which it would reassess the market. Impacts to Q1 net volumes will total 30-40 Bcf, or about 330-440 MMcf/d. However, recent management comments suggest that the current curtailments will not be followed by a pullback in 2024 capex plans.

EQT deferring 1 Bcf/d of production from late February through March.

“Certainly, for a business like EQT, where we’re drilling 15, 20 wells a pad, the capex we spend this year has no real impact on our production this year. It really has an impact on production next year…We’re just not under the same pressure that most of our peers are,” CFO Jeremy Knop said on a Feb. 14 earnings call. “So that allows us to be a little stickier and plan for the long term and not be as reactive. But look, as we said before, our production guidance gives us flexibility to reduce as needed. But reducing capex activity this year is not—I mean, it’d be window dressing this year at the expense of next year, and it’s just not how we run the business.”

On March 12, CNX announced that it was delaying completion of three Marcellus pads containing a total of 11 wells to “avoid bringing incremental volumes into the current oversupplied market.” The company did not say how long the delay would be. Because of the deferrals, CNX lowered its 2024 production guidance by 30 Bcfe at midpoint to 540-560 Bcfe, or 1.48-1.53 Bcfe/d, which would be a modest 1.6% YOY decline at midpoint. Previously, CNX anticipated a slight increase in production compared to 2023.

CNX deferring 11 wells among three pads in the Marcellus.

Companies in the 2024 maintenance category include Antero Resources and Range Resources. Antero is staring sub-$2.00 gas right in the face, as it is unhedged. The company has significant liquids fractions that will enable it to generate free cash flow, it said in February.

“When we construct the capital plan, the first filter is always to generate free cash flow. So, we’re very focused on that,” CFO Michael Kennedy said on a Feb. 15 earnings call when asked if the company could cut back its activity in the face of low prices. “We’re down to two rigs from three rigs. We stacked one of our rigs. So down to a two-rig program and one completion crew. We just released one of our completion crews and made it a spot crew. That spot crew does have one pad that it’s scheduled to complete in the third quarter, and that’s highly flexible and dependent on liquids prices.”

Kennedy said Antero could “toggle lower” on capex by about $50 million through a change in activity levels, adding, “at today’s gas prices, which is about a $2.25 strip, we’re still generating free cash flow.”

Range aims to keep production flat and build a drilled uncompleted well inventory by year’s end. CEO Dennis Degner said on a Feb. 22 earnings call that the company has flexibility.

“If you look back for our ability to basically shape the curve of when our wells will turn in line this year, when you look at the past several years, there have been times when clearly, we’ve chosen to look at shut-in economics,” Degner said. “And we’ve looked at dry gas portions of the field, and we know where, let’s just say, that gas curtailment could take place and have a commensurate cost reduction that goes along with it, while supporting really our price realization uplift associated with our NGLs in the wet side of it.

“So, as we look kind of on the program going forward and the inventory build that would support our setup for 2025, we see that we’ll have the flexibility to basically adjust timing for turn-in-lines based upon what the macro is telling us, and what the basin fundamentals are looking like.”

Coterra pulls back capex by 55% YOY in the Marcellus; volumes to fall 6%.

Multi-basin operator Coterra Energy is spending 55% less YOY on its Marcellus operations, opting to shift spending to liquids-rich opportunities in the Permian and Anadarko basins. At midpoint, the company expects its Marcellus output to fall 6% in 2024 after producing 2.26 Bcf/d in 2023. Gulfport Energy, which also has a multi-basin portfolio, is spending 10% less in the Utica this year but intends to keep volumes flat, with a focus on liquids-rich acreage. “We are remaining flexible in light of the commodity backdrop and possess the ability to moderately defer or accelerate completions, should commodity prices and rates of return warrant,” CEO John Reinhart said on a Feb. 28 earnings call.

About Enverus Intelligence Publications 
Enverus Intelligence Publications presents the news as it happens with impactful, concise articles, cutting through the clutter to deliver timely perspectives and insights on various topics from writers who provide deep context to the energy sector. 

Enverus Blog - The Texas power market evolution

Improving injection studies with ATC

What is available transfer capacity (ATC)?

Available transfer capacity (ATC) refers to the remaining power transfer capability within a transmission network. It represents the maximum amount of power that can be transmitted over a transmission line without compromising grid reliability and stability.

Why is ATC important for power project developers?

With the increasing demand for electric power and the integration of renewable energy into the U.S. power market, the process of adding new power to the grid and navigating interconnection has become more complex. Historically, fossil fuel plants have been built in centralized locations, simplifying interconnection to the grid. However, an influx of renewables in the U.S. power market is resulting in a decentralized grid, creating a more complex interconnection process.

How does ATC impact injection studies during the interconnection process?

In Texas, the rapid growth of renewable development has created a competitive landscape for developers seeking ideal project sites and interconnection points. The Electric Reliability Council of Texas (ERCOT) manages the electric power delivery to more than 26 million customers. For renewable developers connecting to the ERCOT grid, injection studies are essential to ensure that their projects support grid reliability and stability. These studies analyze the potential impact of proposed projects on the chosen point of interconnection and the surrounding area. Consequently, developers may incur significant costs to complete these studies successfully. To mitigate study costs, developers now seek ways to assess their projects’ impact on the grid early in the site selection process. Understanding the available capacity of substations within the grid is crucial for this purpose.

How can Enverus Power & Renewables ATC solutions help you with your injection study?

Enverus Power & Renewables offers ATC solutions to help developers screen for substations with available capacity early in the project siting process. Using the Enverus PRISM® application, developers can track historical ATC values at the busbar level to identify substations with promising injection capabilities for their future power plants.

When screening all of Texas for less congested areas where interconnection seems feasible, developers need to quickly find counties where historically there has been available capacity to interconnect. Figure 1 outlines counties with the highest available capacity in Texas.

Since ATC values can fluctuate overtime with seasonality and changes to the grid, developers not only need to find areas with higher ATC values, but also areas where available capacity does not significantly fluctuate. This ensures that if they were to interconnect their power plant to a substation within these areas, it is more likely to have constantly high ATC values to support their project’s capacity and not need to be concerned with curtailing any power. Sutton, Kimble and Grimes counties stand out in Figure 2 as regions where both the Average ATC (MW) is consistently high as well as the Minimum Daily ATC, meaning there is likely minimal volatility in ATC values.

There are 14 substations in Sutton, Kimble and Grimes counties with these ATC values in Enverus PRISM. To further assess interconnection feasibility, a developer must also understand the futuristic condition of the given substations that may impact their interconnection. The planned capacity at these substations can help a developer get a full view of how the existing available capacity may decrease based on the up and coming power plants at that point of interconnection. In Kimble County, there are no planned projects that may be interconnecting to the two substations within that area. The two substations in Sutton County have a combined mean ATC that is much higher than the planned capacity at those points of interconnection (Figure 3). Meanwhile, the 10 substations in Grimes County, have a combined mean ATC that is lower than the planned capacity at those points of interconnection (Figure 3). Grimes County thus has more planned capacity than the historical available capacity, meaning interconnection in this region would likely be challenging. This type of assessment allows developers to quickly find regions where the delta between the available capacity and the planned capacity supports the connection of their new power plant in the area.

At this point, a developer can begin to assess at a substation level, where they can potentially interconnect given the grid’s availability for new capacity. Figure 4 outlines, by substation, in Kimble and Sutton Counties, the Average Available ATC in MW over an 11-month period. Segovia and Cauthorn substations, located in Kimble and Sutton Counties respectively, have historically had low ATC values. Meanwhile, Edison and Orsted substations, located in Kimble and Sutton Counties, respectively, consistently have much higher ATC values.

With this knowledge of available capacity at a substation level, the developer can start to consider other project site attributes such as land suitability to continue in their project siting process. The available capacity gives them the confidence to find sites around the Orsted and Edison POIs. When assessing suitability for solar projects, developers can consider metrics such as Average Global Horizontal Irradiance (GHI) to interpret how a solar plant may perform. Between the Orsted and Edison substations, which have comparable available capacity, Orsted sits more optimally amongst parcels with higher GHI values, making it likely more suitable for solar (Figure 5).

As a developer continues in their project siting process, they can also consider land buildability. With Customizable Buildable Acreage in PRISM, they can run a custom buildable analysis of the parcels around the Orsted substation to find potentially suitable sites for their project. Figure 6 outlines the parcels above 100 acres around the Orsted substation, which has the available capacity to support new projects. The green represents areas where a project could likely be built based on the customized buildability model.

Ultimately, developers need to understand the available capacity to interconnect to the grid prior to other steps in their project siting process to ensure successful interconnection and reduce injection study costs further down the line. Enverus PRISM assists developers in quickly finding substations with available capacity, and subsequently the land to support projects around those sites. To further analyze the point of interconnection (POI), available transfer capacity can be viewed in Enverus Panorama.

geothermal-energy-in-the-us

The Geography of Geothermal LCOEs

Geothermal energy in the U.S. is gaining ground, thanks to initiatives like the Enhanced Geothermal Shot which aims to reduce enhanced geothermal systems (EGS) costs 90% to $45/MWh by 2035. The U.S. Department of Energy’s $31-million funding for geothermal tools, $60 million towards the funding of three EGS projects and the bipartisan bill aiming to align geothermal with oil and gas regulations demonstrate increased governmental support. Furthermore, Texas’ Senate Bill 785, clarifying that geothermal energy rights belong to landowners, signifies a major legislative advancement.

Recently, Fervo Energy and Eavor Technologies have marked significant progress in geothermal technology. With their recent EGS success, Fervo raised $244 million, with Devon investing $90 million, highlighting its potential. Additionally, Eavor secured $182 million, backed by BP and Chevron, advancing its Advanced Geothermal Systems (AGS) technology. These achievements underline the growing investor confidence and technological advancements in the geothermal sector.

Considering these advancements in policy, technology and funding, Enverus Intelligence Research’s (EIR) Geothermal Report and Geothermal Model evaluates conventional, EGS and AGS project LCOEs for more than 3000 counties in the U.S. As expected, the traditional hotspots in the West – including California, Nevada, Idaho, Colorado and Oregon – screen well, as do pockets in non-traditional areas such as Montana, North Dakota, Nebraska, Oklahoma, Arkansas, Louisiana, Texas and Mississippi.

The report dives into the LCOEs of the different geothermal technologies and their sensitivities including drilling costs, temperature gradient, flow rates and more. It shows that LCOEs for conventional geothermal power, EGS and AGS can be as low as $64/MWh, $87/MWh and $123/MWh. These LCOEs are still almost $30/MWh higher than conventional renewables like wind and solar, but geothermal benefits from a rising need for stable baseload power to balance the grid.

Research Highlights:

CO2 Pipeline Economics – The Missing Link – This report dives into the economic intricacies of CO2 transportation through Enverus Intelligence Research’s CO2 pipeline economic model, exploring the costs involved and identifying strategies CCUS stakeholders can leverage to create efficiencies.

Texas Grid Storage Gold Rush – Keys to Unlocking Profitability – We explore what battery size, operating strategy and location for storage assets in ERCOT are the most profitable.

IPPSA 2024 – Realities of Implementing CER for Alberta Gas Generation – Enverus Intelligence Research analysts prepared these slides for presentation to a panel at the IPPSA 30th annual conference March 12. Natural gas-fired generation is the backbone of the Alberta grid. If gas generation is to continue to operate in Alberta under the proposed federal Clean Electricity Regulations, it needs to utilize carbon capture and sequestration and achieve stringent emissions targets. We examine whether this is feasible in reality.

available transfer capacity

U.S. rig day rates slip as January hopes turn to February blues

Day rates in the U.S. can’t seem to make up their mind, and neither can drilling contractors. All the Enverus Day Rate Survey’s seven regions saw rig rates decline sequentially in February, for the first time since October. Drillers surveyed in February also turned pessimistic as new-year optimism dissipated, citing the soft natural gas price as the main culprit behind declining rig demand.

The U.S. composite day rate fell $146 or 0.61% in February to $23,759. All seven regions saw rates increase in January and last November, while December was a mixed bag in which the overall composite declined but more regions rose than fell.

February’s decline was hardly a rout, with only two regions falling by more than 0.75%. The national composite rate for each of the survey’s five main rig classes declined; but breaking down day rates by both class and region showed increases for 40% of the categories. However, these gains were confined to rigs with less than 1,500 hp. More than 80% of all active rigs are 1,500-1,999 hp.

The Permian Basin saw the biggest decline in February as its composite day rate fell $349 or 1.46% from January to $23,534. Four of the Permian’s five rig classes moved lower.

us-composite-day-rate-variance-by-region

The other big loser in February was the Ark-La-Tex—no surprise to anyone following Henry Hub prices. The Ark-La-Tex composite fell $274 or 1.11% to $24,491 as a warm U.S. winter drove the final nail into any hope of a natural gas market rebound boosting the Haynesville during 2024.

“Low commodity pricing and soft budgets have caused our wait lists to shrink,” an Ark-La-Tex driller told the Enverus survey team. Only 73 drilling rigs were active in the Haynesville in late February, near the region’s three-year low and a 12-rig decline in two months. Enverus Intelligence® | Research’s (EIR) February Fundamental Edge report, available to EIR subscribers, predicted that Haynesville production in 2024 would be 1.18 Bcf/d lower than in 2023 with sub-$2.00/MMBtu prices “inevitable” this year.

Drilling contractors delivered a similar message in their 4Q23 earnings calls. For example, two Haynesville clients that Independence Contract Drilling expected would sign extensions at the start of the year instead canceled their campaigns, CEO Anthony Gallegos said during a Feb. 28 earnings call, adding that ICD has already moved one of the spurned rigs to the Permian.

Precision Drilling CEO Kevin Neveu said in a Feb.7 earnings call that his company was “transitioning from being very gas-focused a couple of years ago, which served us quite well during the pandemic, to pushing more into West Texas, more into the oilier basins. And it’s tough when there’s not a lot of new opportunities popping up.” However, Patterson-UTI CEO Andy Hendricks was more upbeat in his Feb. 15 earnings call, saying his company was having discussions with its natural gas customers about adding rigs later this year.

Respondents to the Enverus survey also mentioned Q1’s traditional softness, weather issues and recent M&A activity among major operators holding up the release of new 2024 capex spending. Those factors are more likely to support a near-term rebound. “The decrease in activity is related to the Q1 softness. I do expect the market to recover, though, in Q2 and Q3,” an Appalachian driller told the survey team.

“With some of the mergers and acquisitions going on in the industry, you would think these companies are getting ready to increase their activity,” an Ark-La-Tex driller told the Enverus survey team. U.S. upstream M&A valued at $144 billion was announced in 4Q23—an all-time high, according to an EIR report—driven by the ExxonMobil-Pioneer Natural Resources, Chevron-Hess and Occidental Petroleum-CrownRock megadeals.

Still, the Enverus Day Rate Survey revealed drillers’ mindsets had darkened dramatically between January and February. Roughly 20% of participants expect more work during the next six months compared with 75% during the prior survey. Two-thirds of drillers surveyed in February expect the work volumes to stay the same.

Only 7% of drillers surveyed in February reported bid requests were increasing, far below the 55% recorded in the January survey. The percentage of drillers reporting a decline in bidding activity surged to 61% compared with 27% in the prior survey.

Three-fourths of respondents reported that daily operating costs had stabilized during the past three months. The remaining 25% of drillers were basically split evenly between saying costs had increased and decreased. Similar to January’s survey, respondents reporting declines attributed them to better in-house maintenance of rigs and more experienced crews, which possess the know-how to run equipment more efficiently.

To see the full results of the Enverus Day Rate Survey for February, check out the latest issue of Oilfield Pulse.

About Enverus Intelligence Publications 
Enverus Intelligence Publications presents the news as it happens with impactful, concise articles, cutting through the clutter to deliver timely perspectives and insights on various topics from writers who provide deep context to the energy sector. 

Let’s get started!

We’ll follow up right away to show you a quick product tour.

Let’s get started!

We’ll follow up right away to show you a quick product tour.

Register Today

Sign Up

Power Your Insights

Connect with an Expert

Access Product Tour

Speak to an Expert